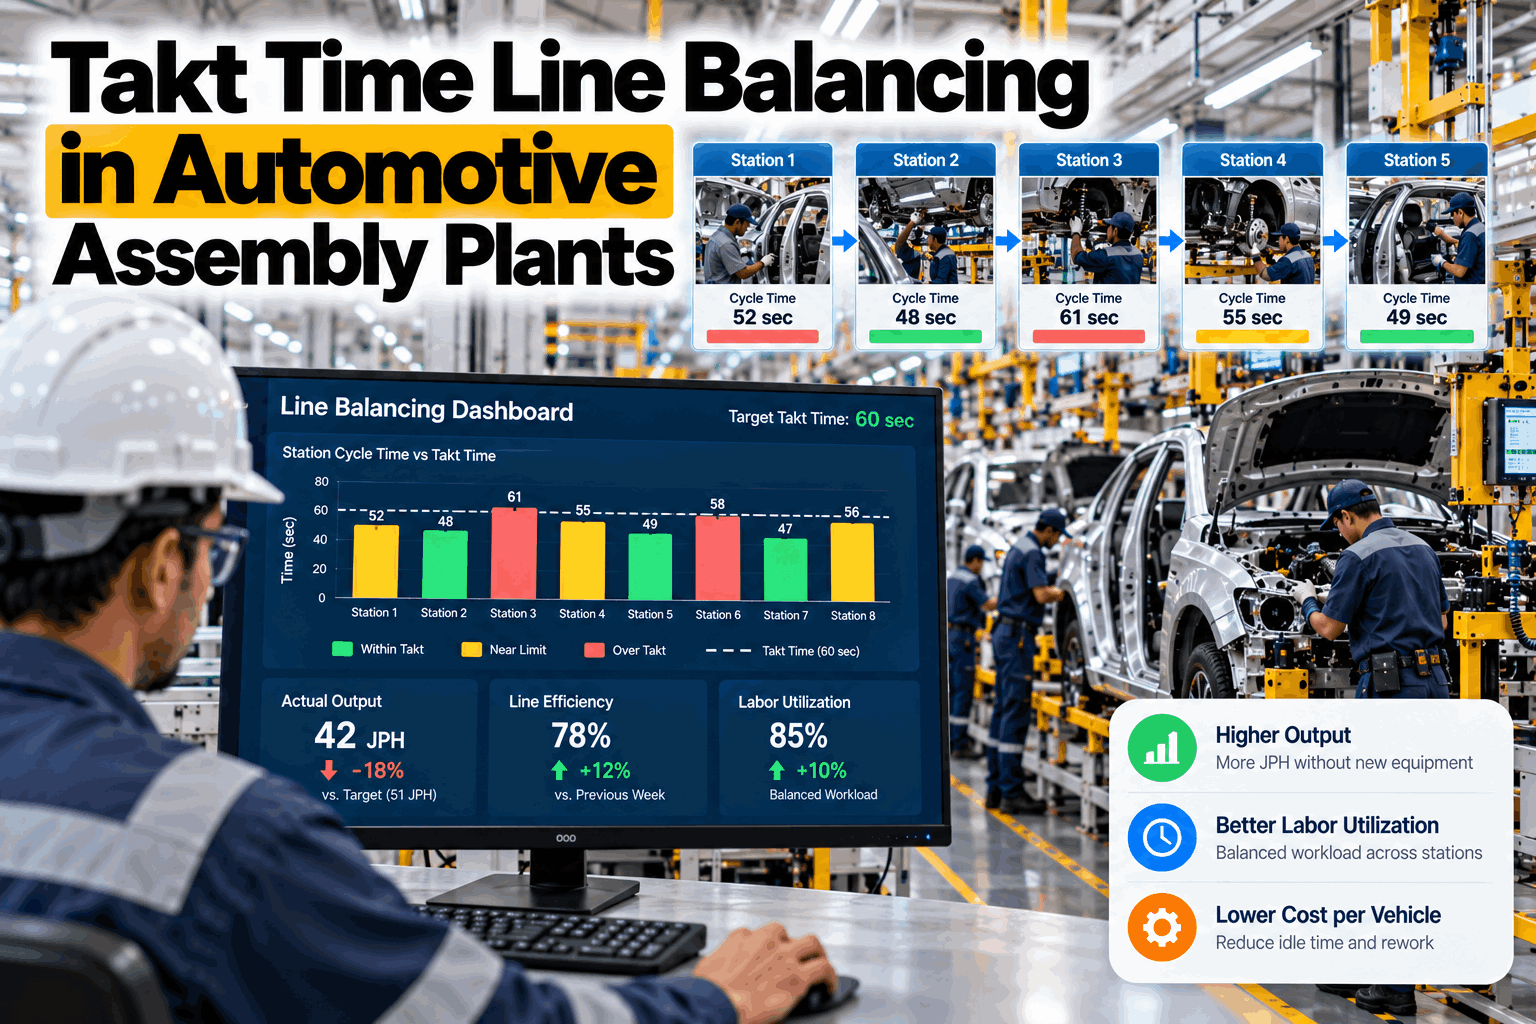
A line that can reach 60 jobs per hour on paper and runs at 54 in practice rarely has a work problem. It has a balance problem. The total work content fits inside the takt, but it sits unevenly across the stations, so one station sets the pace while others wait. The usual response is more labour or new equipment, when moving a few tasks would do more. This guide shows how to balance an automotive assembly line to takt time: how to define takt and station load, where lines lose their balance, which measures prove it and how to move work between stations without breaking precedence, ergonomics or the model mix. To see how it looks on your own station data, book a line balancing walkthrough.
Takt Time Line Balancing in Automotive Assembly Plants
A practical guide for planning teams: how to measure station load against takt, find the pacer and the idle stations, and rebalance the line so output rises without new equipment and without overloading anyone.
- How takt, station load and balance efficiency fit together
- Where assembly lines lose balance across model mix and shifts
- How to rebalance stations and prove the gain in JPH
Idle time is the gap between each station's work content and the 60 s takt, in seconds per vehicle. Five stations hold more than four fifths of it, and the dashed line marks where the cumulative share passes 80%. At the same time station 6 runs 6 s over takt and station 3 runs 1 s over, so the line waits on two stations while eight have spare time.
What Takt Time Line Balancing Really Is
Balancing spreads work content so that no station sets the pace and none waits.
Takt time is the pace the customer sets: available production time divided by demand. Target jobs per hour is 3,600 divided by takt in seconds. Station load is the work content a station carries for each vehicle, including walk and wait time. Balance efficiency is total work content divided by the number of stations times takt. A line is balanced when every station sits at or under takt with a margin for variation, and the work is spread evenly enough that no one station is the constraint. Our line analytics team can show how this looks on your own line data.
Set the pace
Available time over demand, updated when shifts or volumes change.
Measure station work
Actual cycle per station and variant, with walk and wait included.
Respect the limits
Precedence, zoning, tooling and ergonomics decide what can move.
Move the work
Tasks reassigned so loads even out and the pacer is relieved.
An average load of 50 s per station hides the one station at 66 s. The line runs at the speed of its slowest station, so balance against the worst variant and the pacer, not against the mean.
Where Assembly Lines Lose Their Balance
Lines drift out of balance for a handful of repeat reasons.
A line is balanced when it launches and drifts from there. Models and options change, tasks are added to whichever station had room, and staffing shifts. For a planning team the useful question is not whether the line is unbalanced but which of these causes is doing the damage. To find out for your line, book a station load review.
When several heavy-option variants run back to back, one station absorbs the peak. Level the build sequence so heavy variants are spaced apart, and the balance holds with fewer task moves.
Set the Balancing Measures First
A balance is only real if everyone measures it the same way.
Two plants can report different balance on the same line because they count walk time, variants or stops differently. Agree the definitions, take a baseline and then change the line, so a better number means a better line and not a new way of counting.
A station loaded to exactly takt has no room for variation, so every small delay becomes a stop. Leave a margin sized from your own measured variation, and agree it with the line leaders.
What a Better Balanced Line Is Worth
A few jobs per hour can look small on a board. Multiplied by a year of productive hours and the contribution of each vehicle, they become a number worth planning around.
From Station Load to Rebalanced Line
A rebalance is a set of task moves, each one checked.
The load tells you which stations to look at, and the constraints tell you what can move. Together they give a short list of task moves, each with a before and after load, which is what a planning team needs to take to the line leaders and industrial engineers for approval.
Measure
Actual station cycle by variant.
Constrain
Precedence, zoning and ergonomic limits.
Rebalance
Move tasks from the pacer to idle stations.
Simulate
Check every variant against takt.
Trial
Pilot with operators and line leaders.
Verify
JPH and loads checked against the baseline.
Common Line Balancing Mistakes
Most failed rebalances fail on the data or the people, not the arithmetic.
Balancing looks easy on a spreadsheet and gets hard on the line. A few simple rules keep the result real and keep the operators on side.
Good practice
- Balance on actual cycle times by variant
- Keep precedence, zoning and ergonomic limits visible
- Re-check the balance after every model or mix change
Common mistakes
- Balancing to the average model
- Loading every station to 100% of takt
- Moving tasks without checking fit order and ergonomics
Involve line leaders and operators early, and review each change for ergonomics and against your labour agreements. A balance that looks perfect on paper but overloads a person will not last.
How iFactory Line Balancing Analytics Works
Station data in, a ranked balance picture out.
iFactory collects station cycle times, stop events and counters from your PLC, MES and line systems and builds station load by variant, shift and line. It shows the pacer, the idle stations and the balance efficiency, runs what-if moves of tasks between stations and tracks the result against the baseline. It runs on an on-prem server inside your network, with one view across all lines and sites. Your planning and industrial engineering teams still decide the task assignments. Questions on fit go to our support desk.
All station signals
Cycle times, stops and counters from PLC, MES and line systems.
Load by variant
Station load against takt for each model, option and shift.
What-if task moves
Test a move against every variant before it reaches the line.
Gain against baseline
JPH and station loads checked after each change, with owners.
Gains depend on your lines, your model mix and how quickly changes are made. We measure the balance and the effect of each change on your own data during the pilot, rather than promising a general figure.
Turnkey AI: Delivered, Connected and Live in 6–12 Weeks
You do not build this. It arrives ready.
iFactory ships as a pre-configured NVIDIA AI server with the software pre-loaded. Rack it, plug in power and Ethernet, and the AI is live on your network. Our team handles cabling, network setup, PLC and SCADA integration, team training and 24×7 remote monitoring. Data stays on your own network. For a scope matched to your lines, request a turnkey quote.
Ship, network and station data
Server installed. Station cycle and stop data connected for the pilot line.
Station loads and baselines
Takt and standard times agreed. Loads by variant baselined with your teams.
Go-live and training
Dashboards and what-if tools live. Teams trained. 24×7 remote monitoring begins.
Frequently Asked Questions
What is takt time in automotive assembly?
Takt time is the pace set by customer demand: available production time divided by the number of vehicles required. A shift with 27,000 seconds of productive time and a demand of 450 vehicles has a takt of 60 seconds, or 60 jobs per hour.
How is line balance efficiency calculated?
Divide the total work content across all stations by the number of stations times takt. Ten stations carrying 495 seconds of work against a 60 second takt give 495 over 600, or 82.5%. The rest is idle time.
Can we balance a line without new equipment?
Often a good part of the gain comes from moving tasks, cutting walk and wait time and relieving the pacer station. Some moves do need new fixtures or tools, so check each one against the constraints before counting it.
How does model mix affect balancing?
Each variant loads the stations differently, so a line that is balanced for the average model can still overload one station on the heaviest variants. Measure load by variant and check the worst case against takt.
How does scheduling affect line balance?
The build sequence decides how often heavy variants arrive back to back. Levelling the sequence spreads the peak across the line and can protect the balance without moving any tasks.
How do we start?
With one line and its pacer stations. A 6-week pilot connects the station data, agrees takt and standard times and shows the first load and idle time ranking. To plan it, contact our team.
Know Which Station Is Really Holding Your Line
In thirty minutes we look at your line, your station data and how you calculate takt and balance today. You keep the notes whether or not you go further with iFactory.
- 1The takt calculation and demand plan
- 2Station task lists with standard work times
- 3Actual cycle times by variant
- 4Model mix and option take rates
- 5Precedence and zoning constraints