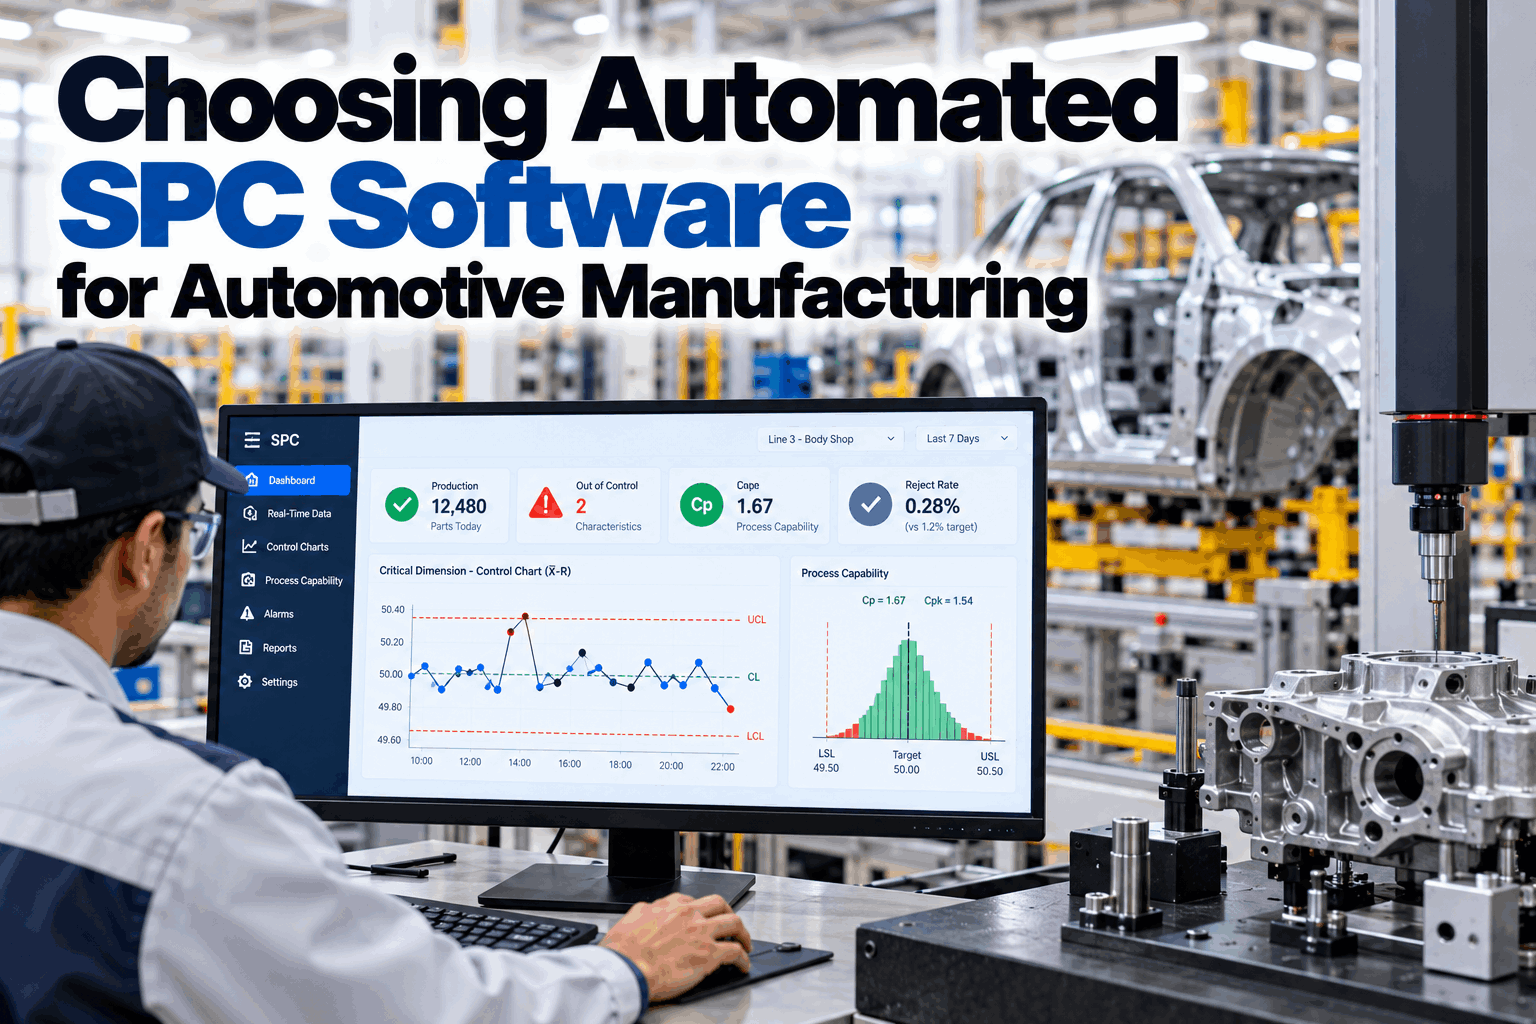
Manual SPC in spreadsheets cannot keep pace with IATF requirements, real-time reaction needs or multi-line data volume. Automated SPC software gives automotive plants a controlled, auditable way to collect measurements, detect process shifts and prove capability. To map the right feature set to your lines and quality system, book an SPC software walkthrough.
Choosing Automated SPC Software for Automotive Manufacturing
A practical guide for quality and operations teams at OEMs and Tier 1 suppliers: move beyond Excel, meet IATF expectations and act on process signals before they become defects or audit findings.
- Collect measurements from gauges, CMMs and line systems automatically
- Detect shifts and trends with real-time control charts and alerts
- Produce audit-ready capability, MSA and reaction records
Why Manual SPC Falls Short in Automotive Plants
Excel and paper charts struggle with volume, timing, traceability and IATF expectations.
Automotive processes generate large volumes of dimensional, torque, leak and functional data across shifts and lines. Manual entry introduces delay and transcription risk. Charts updated after the shift cannot support real-time reaction. Version control, access rights and audit trails are difficult to prove. When a customer or auditor asks for capability history, reaction evidence or MSA status, spreadsheet folders rarely provide a clean answer.
React while the process is still running
Delayed charting means the next parts are already produced before anyone sees the signal.
Handle multi-line, multi-feature data
Critical characteristics across cells and suppliers exceed what spreadsheets can manage reliably.
Prove who changed what and when
IATF and customer audits expect controlled records, not editable files with unclear ownership.
Connect signals to action
An out-of-control point is only useful when the reaction plan is clear and recorded.
Automated SPC also reduces transcription error, standardizes chart rules, preserves history and makes ownership of reactions visible. Those attributes matter as much as real-time display for audit and continuous improvement.
Must-Have Capabilities in Automated SPC Software
Focus on features that support collection, control, reaction and evidence for automotive quality systems.
A platform that cannot connect to your primary gauges or CMM software will force workarounds. Validate collection paths early, including offline or batch measurement scenarios common in automotive plants.
What Automotive Plants Typically Need Beyond Basic Charting
OEM and Tier 1 environments add requirements that generic SPC tools often miss.
Controlled records and reaction evidence
Support for documented reaction plans, capability history and measurement system status that auditors can review without reconstruction.
Consistent methods across plants
Shared characteristic definitions, chart rules and reporting so corporate quality can compare processes fairly.
Reports that match OEM expectations
Capability and SPC packages that can be filtered and exported in the structure customers request during launches and ongoing reviews.
How Automated SPC Changes Daily Quality Work
The value appears in faster detection, clearer ownership and less administrative load.
Selection Criteria for Automotive SPC Software
Evaluate vendors against the constraints of your plant, not a generic feature checklist.
Fit with existing systems
Confirm connections to measurement devices, MES, QMS and data historians you already run.
Operator and engineer adoption
Screens and workflows must work on the shop floor and in the quality office without constant workarounds.
Roles, audit trail and control
Permissions, electronic records and change control should support IATF and internal audit needs.
Implementation and ongoing help
Assess training, template setup, validation support and response times for production issues.
Select a critical characteristic family or a single cell. Validate data collection, chart behavior, reaction workflow and report output with the people who will use the system every day.
Implementation Sequence That Reduces Risk
A staged rollout protects production while proving value and building competence.
Scope
Choose critical characteristics, lines and measurement sources for the pilot.
Connect
Establish reliable data paths and validation rules for those sources.
Configure
Set chart rules, specification limits, reaction plans and user roles.
Train
Prepare operators, team leads and quality on daily use and exceptions.
Run
Operate the pilot, review alerts and refine reaction discipline.
Expand
Extend to additional features, lines and plants using proven templates.
SPC Software KPIs Worth Tracking
Measure whether the system improves detection, response and audit readiness, not only whether charts exist.
Bring SPC Data and Reaction Into One Controlled View
When measurements, charts and reaction notes live in separate files, teams discover process shifts late and struggle to show a clean audit trail. A shared SPC platform helps quality and operations see signals earlier and close actions with clear ownership.
From Pilot to Sustained SPC Discipline
Software alone does not create control. Standard work and ownership do.
Start with a manageable set of critical characteristics. Validate data integrity, train the people who will react to signals and review outcomes before expanding coverage. Treat the pilot as a process change, not only a software install.
Prioritize
Rank characteristics by risk, customer importance and measurement readiness.
Connect
Establish clean data paths and acceptance checks.
Define
Set chart rules, limits, reaction plans and roles.
Operate
Run daily review of signals and open reactions.
Improve
Tune rules, reduce false signals and close systemic causes.
Scale
Extend templates and training to more lines and plants.
Common Mistakes When Selecting SPC Software
Many projects under-deliver because the decision focused on features instead of plant reality.
Good practice
- Validate data collection with your actual gauges and systems
- Define reaction ownership before go-live
- Pilot on critical characteristics with clear success criteria
- Train operators and quality together on daily use
- Measure detection time and reaction completion, not only chart count
Common mistakes
- Buying charting software that cannot connect to primary devices
- Ignoring reaction workflow and audit trail requirements
- Rolling out plant-wide before proving the pilot
- Leaving operators without simple first-response guidance
- Treating SPC software as a quality-only tool with no operations input
If gauge R&R is weak or sampling plans are unclear, automation will amplify noise. Stabilize measurement systems and characteristic definitions alongside the software deployment.
How Quality and Operations Analytics Can Help
Bring measurement signals, process context and reaction status into a shared workflow.
iFactory can connect operational and quality data sources and provide a shared view of process signals and related actions. A deployment’s usefulness depends on the quality, availability and integration of your source data. Teams should validate characteristic definitions, control rules, user permissions and escalation paths during the project, and retain process and quality decisions with the responsible teams. For questions about fit, contact the support team.
Bring measurement data together
Review gauge, CMM and line data in one controlled environment.
Surface process signals early
Highlight out-of-control points, trends and capability risk while production continues.
Make reaction ownership clear
Track who is containing product, adjusting the process or closing the investigation.
Learn from outcomes
Use recurring signals and closed actions to improve rules and process stability.
Results depend on your source systems, measurement practices and data quality. Define measures and validate them with your team using your own parts, processes and operating history.
Frequently Asked Questions
What is automated SPC software?
It is a system that collects process and product measurements, applies statistical control rules, displays charts and supports documented reaction and capability analysis without relying on manual spreadsheet maintenance.
Why is Excel often insufficient for automotive SPC?
Spreadsheets struggle with real-time updates, multi-user control, device integration, audit trails and consistent reaction tracking. Those gaps become visible during IATF audits, customer reviews and high-volume production.
Which features matter most for IATF environments?
Controlled data collection, consistent out-of-control rules, linked reaction plans, capability history, MSA support and access-controlled records are typically essential. Exact needs depend on your quality system and customer requirements.
How should we start an SPC software project?
Select a limited set of critical characteristics, confirm measurement sources, define chart rules and reaction ownership, run a pilot and measure detection latency and reaction completion before broader rollout.
Can automated SPC replace process knowledge?
No. Software improves visibility and consistency. Process engineers and operators still diagnose causes, set appropriate limits and improve the underlying process.
How do we judge whether a vendor is a good fit?
Test integration with your devices and systems, review reaction and audit workflows with your teams, run a pilot on real characteristics and assess training and support quality under production conditions.
Review Your Automated SPC Requirements
Bring a sample of critical characteristics, measurement sources and current charting practices to discuss how your team could move from spreadsheet SPC to a controlled, auditable system.
- 1List of critical characteristics and current control methods
- 2Primary measurement devices and data formats
- 3Example control charts or capability studies
- 4Current reaction plan or out-of-control procedure
- 5Recent audit finding or customer request related to SPC