Retailers, investors and your own board now ask a food plant the same three questions: how much water, energy and waste goes into each kilo you ship. Totals off the utility bill can't answer that. Per-unit numbers need meters, production counts and waste weights joined line by line, with a clear trail behind every figure. This guide shows how to build water, energy and waste intensity that holds up in a retailer scorecard, and how to start with your own meters in a sustainability analytics demo.
Water, Energy and Waste per Kilo, Ready for Every Scorecard
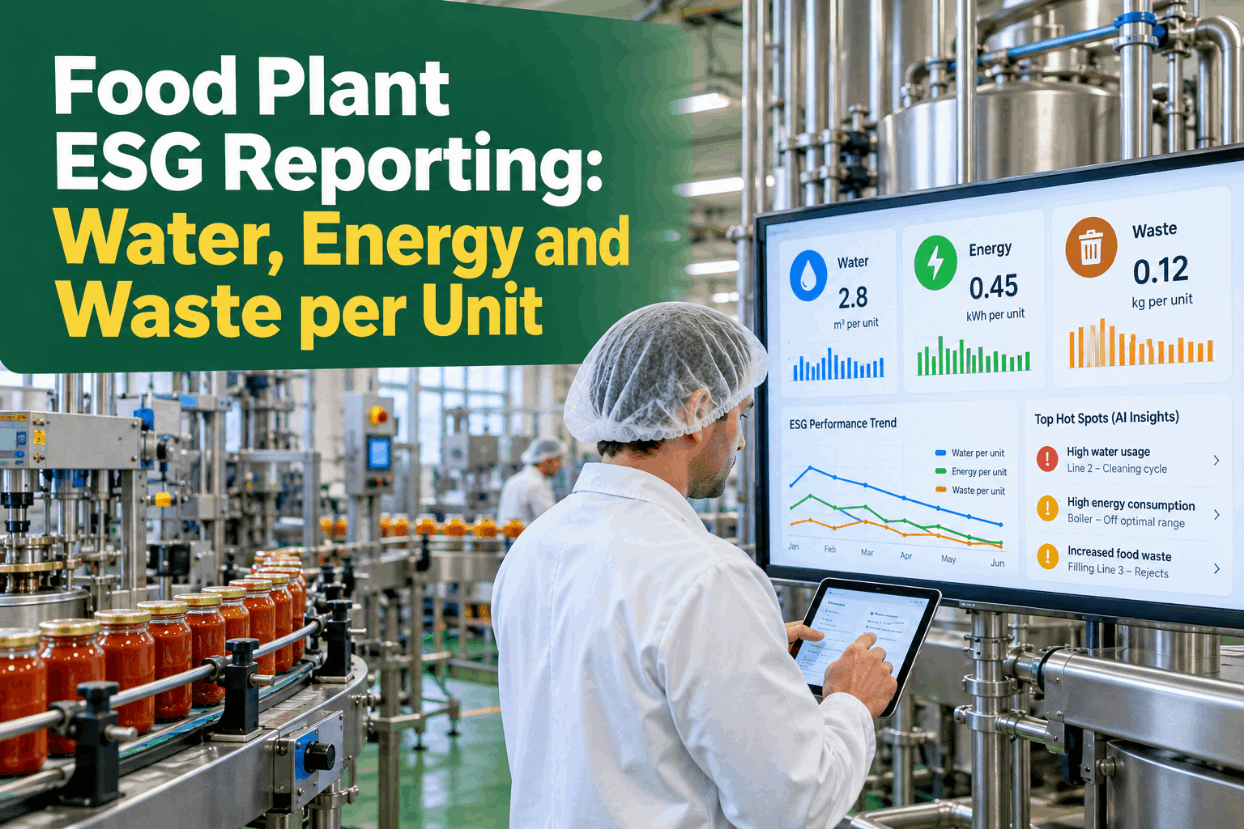
iFactory Sustainability Analytics joins utility meters with production data so each line reports its own intensity. AI flags the waste hot spots behind a rising number, and reports export in the format customer and retailer scorecards ask for.
Three Ratios, One Denominator
Most food plant ESG reporting comes down to three intensity ratios. Each one divides a resource by the same measure of output, usually kilograms or tonnes of finished product, so the three can be read side by side and compared across quarters. Agree the denominator once, write it down, and use it everywhere. Check your own definitions with our support team.
Finished kilos suit most plants. A beverage site may prefer litres packed, and a bakery may prefer kilos baked. Whatever you pick, it has to come from one system of record, such as packed weight from the MES, and stay the same from quarter to quarter.
Where the Litres Go Inside a Food Plant
In many food plants, a large part of the water never touches the product. It goes to clean-in-place cycles, washdown, boiler make-up and cooling towers. A single plant figure hides that split, so sub-meter the big users first. If you answer a customer's CDP water questions or work toward Alliance for Water Stewardship certification, the same metered split is the evidence they rely on. The bars below are illustrative. Plan your meter points in a metering session.
Measure Food Waste the Way Two Frameworks Expect
Two references shape most food waste reporting. The Food Loss and Waste Accounting and Reporting Standard, published in 2016 by the FLW Protocol partnership led by WRI, asks you to state your scope: timeframe, material type (food, inedible parts or both), destination and boundary. The US EPA Wasted Food Scale, built on 2023 EPA research, ranks pathways from prevention and donation down to landfill, incineration and sending food down the drain. Food that is donated stays in the food supply, so the FLW Standard keeps it out of the waste total. Map your waste streams with our support team.
Energy Intensity and Scope 2 in One Paragraph
Energy intensity uses the same metered kWh that feed your Scope 2 figure. Purchased electricity, steam and heat are Scope 2, and the GHG Protocol's Scope 2 Guidance asks for both a location-based and a market-based result. Gas and oil burned in your own boilers and ovens fall under Scope 1. For a food plant the practical point is simple: if kWh per kilo is right by line, the emissions per kilo built on it will be right too. Our cross-industry carbon tracking guide covers factors and assurance in depth, and you can see both views on your meters in a short walkthrough.
Ask Why the Number Moved, Get the Line and the Asset
iFactory reads meters and production counts together, so a rise in water or energy per kilo comes with a reason: which line, which shift, which asset. Plant managers ask in plain words and get the answer with its evidence.
From Main Meter to Kilo, in Five Steps
Line-level intensity means splitting every main meter down to the lines that used the water or energy. Sub-meters do most of the work. Shared services such as compressed air, refrigeration and the boiler house are split by an agreed key, and the remainder is shown, never hidden. Get a meter hierarchy review from our support team.
When the Plant Number Rises but Every Product Improves
A plant that makes both wet and dry products can see its water per kilo jump simply because it made more of the wet one. Restating the quarter at a fixed mix separates real change from mix change. The figures below are assumed for illustration, for two product families in one plant. Run the restatement on your own data in a reporting demo.
Report both numbers. The plant figure is what a retailer sees. The mix-adjusted figure is what shows whether the plant is actually getting better.
Grade Every Number by How It Was Measured
Scorecards and assurance reviews look for the same thing: how much of each figure is measured and how much is estimated. Grading each data point makes gaps visible and gives you a plan to close them, one meter at a time. Ask our support team for the grading rules we use.
Main meters reconcile with the bills within an agreed tolerance. Production kilos match the figure finance reports. Every gap-filled hour is listed with its rule and who approved it.
What Retailer Supplier Programmes Tend to Ask
Large grocers run supplier sustainability programmes with their own portals and questions. Walmart's Project Gigaton asks suppliers to report emissions they avoid across pillars including energy, waste and packaging. In 2018, Tesco announced that 27 of its own-label suppliers, plus the wholesaler Booker, would publish food waste data for the first time. The detail varies by retailer and changes often, but the requests rhyme. See how exports map to your customers in a scorecard review.
One Monthly Record per Line
Keep one record per line per month and build every report from it. Retailer scorecards, customer surveys and your own ESG summary then draw on the same figures. Ask for the blank monthly record from our support team.
Three Hot Spots the AI Typically Raises
These illustrations show the kind of finding Sustainability Analytics brings forward. They are not case studies, and the numbers will differ in your plant. Walk through your own lines in a live session.
Size the Reporting Effort You Get Back
The clearest value is the time spent assembling numbers by hand each quarter, plus whatever the hot spots are worth once fixed. Every input below is assumed and shown only to make the arithmetic clear. Plug in your own request count with our support team.
Add savings from water, energy and waste projects only after they are measured on the same meters, against a baseline you agreed before the change.
Meter Connectors, Sustainability Analytics and AI Server in One Package
iFactory delivers Sustainability Analytics as a turnkey system. A pre-configured NVIDIA AI server ships racked and ready with connectors for your meters, MES and waste logs, so data stays on site. You rack it, plug in power and Ethernet, and the AI is live. Size the package for your meters with a turnkey quote.
- Pre-configured NVIDIA AI server, racked and ready
- Connectors for water, power, gas and steam meters
- MES and ERP links for packed kilos and product mix
- Waste logging by stream and FLW destination
- Line-level intensity with data grades on every figure
- Scorecard exports for customers and retailers
- 24×7 remote monitoring of models and hardware
Meters mapped to lines, server installed, MES and waste sources linked.
Intensity calculated by line, bills reconciled, data gaps graded and logged.
AI hot spot alerts switched on, first scorecard export checked with your ESG lead.
Food Plant ESG Reporting Software That Starts at the Line
iFactory works from the meters and production counts you already have, so every figure can be traced back to its source. Our support team can plan a first line with you.
What Plant Managers Ask About Food Plant ESG Reporting
Answer Every Scorecard From One Set of Numbers
Join meters, production and waste weights by line, grade every figure, and let AI show where water, energy and food are being lost. Server, connectors and exports arrive as one turnkey package, live within 6 to 12 weeks.