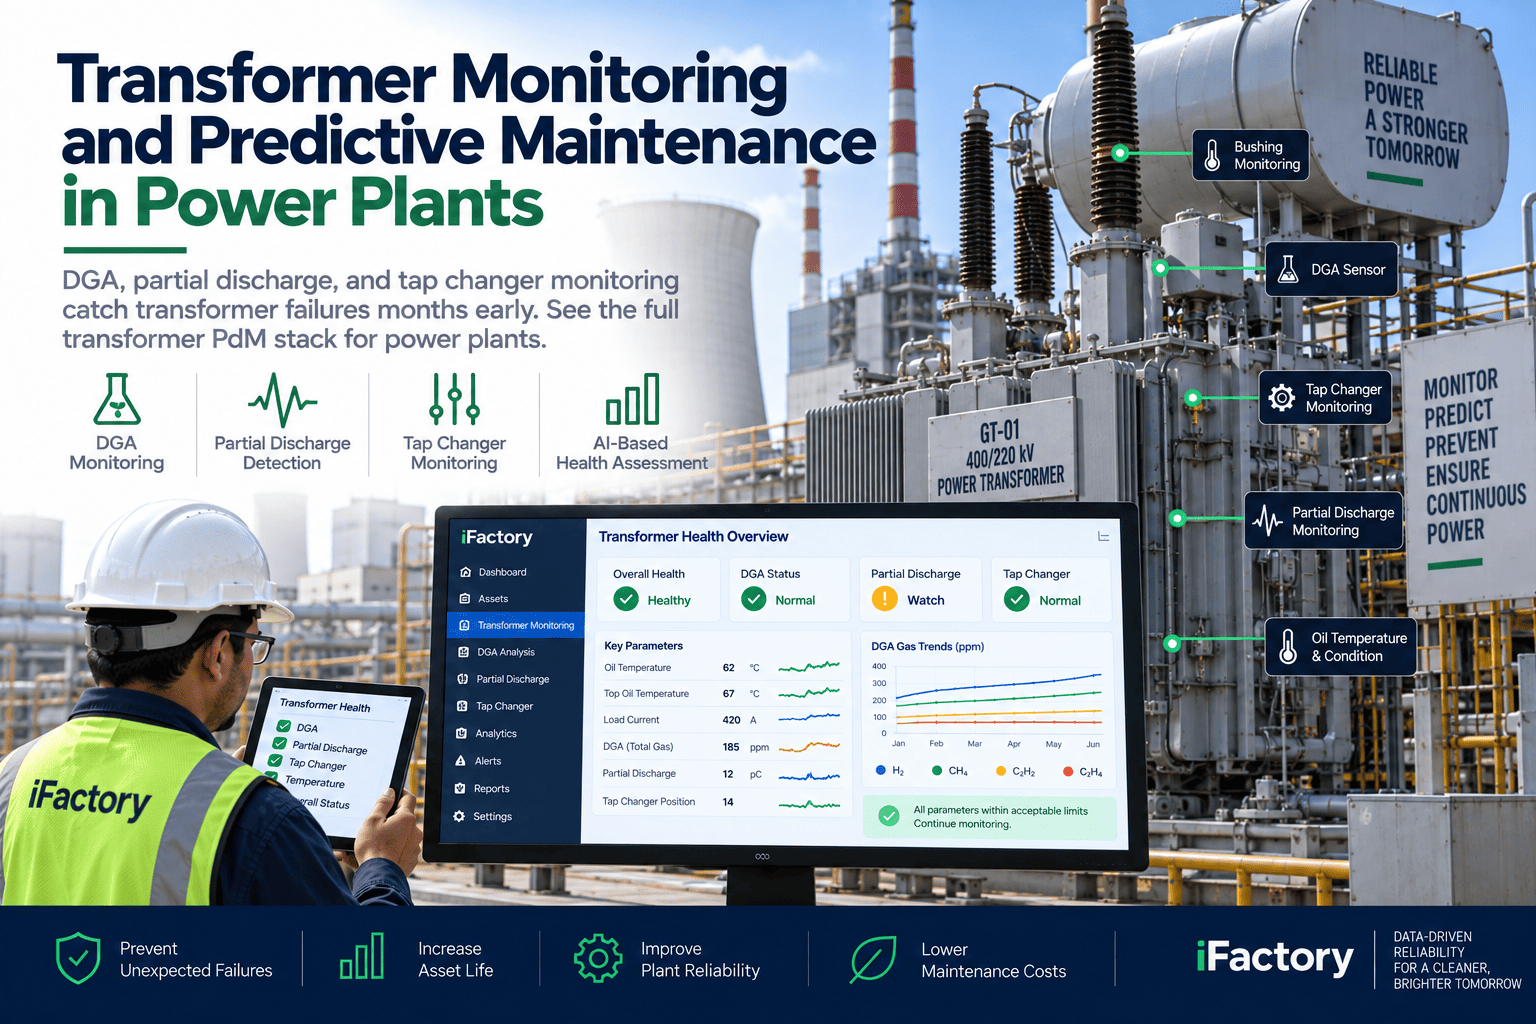
A generator transformer is one of the two or three most expensive assets on a power plant, and the failure modes that end its life are already in progress months before the fault current arrives. Roughly 75% of transformer failures show dissolved-gas warning signs 30 to 90 days ahead of the event — hydrogen and methane for partial discharge, ethylene for a hot spot, acetylene for arcing — and the science is standardized under IEEE C57.104 and IEC 60599. Partial discharge is detectable acoustically and via UHF. Tap-changer contact wear is trackable through operations-count and thermography. Yet many plants still run DGA on an annual sample interval, react to results in a spreadsheet, and never see the trend that would have caught the fault. A $300 DGA test can flag an incipient fault weeks ahead of a $2M forced outage — but only if the data is trended and acted on. iFactory's Transformer Health Stack is the layer that makes that trending live.
iFactory Transformer Health Stack
Catch Transformer Faults 30 to 90 Days Before the Trip
DGA trending against IEEE C57.104 thresholds, partial-discharge monitoring, tap-changer health tracking, and bushing thermography in one asset view — with the work order pre-cut.
75%
failures show DGA signal early
30–90
days advance warning
IEEE C57.104
gas thresholds enforced
$300 test
prevents $2M outage
The Failures That Actually Kill Transformers
Transformer failure is rarely a lightning strike. It is a slow degradation of oil, cellulose, tap contacts, and bushings that goes on for weeks before the protection trips.
Annual DGA + Rounds
"Last year's DGA looked fine."
DGA sampled once a year, results filed in a folder
Trend across intervals never charted
Partial discharge, if measured at all, on a portable set once a year
Tap changer condition assumed until it fails
Health Stack
"Every gas, every trend, every threshold — live."
DGA trended per gas, per transformer, against IEEE C57.104
Rate-of-rise flags catch gas generation before absolute limits
Partial discharge continuous where fitted, portable elsewhere
Tap-changer ops count and thermal signature tracked
The Gases and What They Actually Mean
Each fault gas points to a specific temperature range and fault type. IEEE C57.104 gives the thresholds; the trend line gives the action window.
Hydrogen H2
Below 150°C partial discharge and arcing. Action threshold ~100 ppm; a rising trend is the earliest signal a transformer will give you.
Signal: PD / corona
Methane CH4
150–300°C low-temperature thermal fault. Rising CH4 with H2 shifts the diagnosis toward a developing thermal problem.
Signal: low-temp thermal
Ethylene C2H4
300–700°C hot spot in winding or core. Action threshold ~50 ppm; this is the gas that most often correlates with a winding fault.
Signal: hot spot
Acetylene C2H2
Above 700°C high-energy arcing. Any acetylene at all warrants urgent review; presence with elevated H2 is a red-flag combination.
Signal: high-energy arc
CO / CO2
Cellulose insulation breakdown from thermal or long-term aging. Elevated CO with rising CH4 points at paper degradation, not just oil.
Signal: paper decomposition
What the Transformer Health Stack Actually Does
The stack is the four PdM techniques a good utility already tries to run — DGA, PD, tap-changer, thermography — held in one asset record with the trending, threshold logic, and CMMS write-back that turns findings into work orders.
DGA
Every gas trended per transformer with IEEE C57.104 thresholds live, rate-of-rise flags on top of absolute limits, and Duval-triangle diagnosis suggestion.
PD
Partial discharge monitoring — continuous UHF and acoustic where fitted, portable spot data elsewhere — with signal correlation against DGA trends.
OLTC
On-load tap-changer operation count, temperature differential vs main tank, and oil sample data — the three signals that catch OLTC contact wear.
Bushings
Bushing thermography on route, capacitance and power-factor testing at outages, dielectric trend against the bushing's baseline.
What Continuous Trending Delivers
When DGA, PD, tap-changer, and bushing data are read as a single asset view and the trends have action thresholds, transformer forced outages stop being surprises and start being scheduled outages.
Weeks
Early warning
on gas rate-of-rise
Fewer
Forced outages
transformer-attributable
Scheduled
Interventions
in economic-dispatch dips
Lower
Insurance loss ratio
documented preventive actions
Pull your last five DGA results on your main GT. If they were reviewed as five separate numbers rather than a rate-of-rise line, the trend was invisible. Book a plant assessment — we'll plot one transformer's three-year gas history live.
Frequently Asked Questions
Do I need to buy new DGA hardware?
Not necessarily. Many plants run DGA via periodic oil sampling to an external lab, which is fine — the constraint is not the sample method, it's that the results never get trended. iFactory's stack ingests both periodic-lab DGA and continuous online DGA monitors if you have them fitted. Where a critical GT or GSU would benefit from continuous DGA, the pilot recommendation is data-driven, based on your rate-of-rise history and criticality, not a hardware upsell.
How does partial discharge fit into this?
Partial discharge is the second signal that catches faults DGA alone can miss, particularly the low-energy PD in solid insulation that gets to hydrogen but not to the higher hydrocarbons. Continuous UHF PD monitoring on critical transformers is the gold standard; on the rest, portable acoustic and UHF spot readings on the route capture the risk. The stack correlates PD activity against DGA hydrogen so the two signals reinforce each other, and false positives on either alone drop sharply.
What about tap changers — they fail differently, right?
Yes. On-load tap changers are mechanical devices that wear with operations count, not with dielectric fatigue like the main tank. The stack tracks operations count against manufacturer service intervals, temperature differential between the OLTC compartment and the main tank (a widening gap is a sign of contact heating), and OLTC oil sample data separately from main-tank DGA. Ignoring OLTC health because "the main tank DGA is clean" is a common failure path.
Book a plant assessment to see the OLTC view on one of yours.
How does this write work orders?
Every threshold trip — whether it's a gas crossing a C57.104 limit, a rate-of-rise flag, a PD amplitude excursion, or an OLTC ops-count trigger — creates a work order in the CMMS with the fault class named, the recommended next test (repeat DGA in 7 days, PD spot check, OLTC oil sample), and the criticality-appropriate priority. The maintenance planner reviews and releases; the stack does not auto-schedule a transformer outage without human approval.
Can we start with one transformer?
Yes — and most plants do. Typically the pilot starts on the main GT or GSU, or on the most-run large auxiliary transformer, ingests three years of historical DGA plus any PD and thermography data on hand, and produces the trend view live. That single-transformer pilot proves the trending and the write-back before the plant rolls the stack across the transformer fleet. Book a plant assessment and we'll pick the right first unit.
Stop reading DGA results one at a time.
See Your Own GT's Three-Year Gas Trend on the Health Stack
Bring three years of DGA results and any PD or thermography data you have on one transformer. We'll plot the trend against IEEE C57.104 thresholds, run Duval, and show what a rate-of-rise flag would have caught.