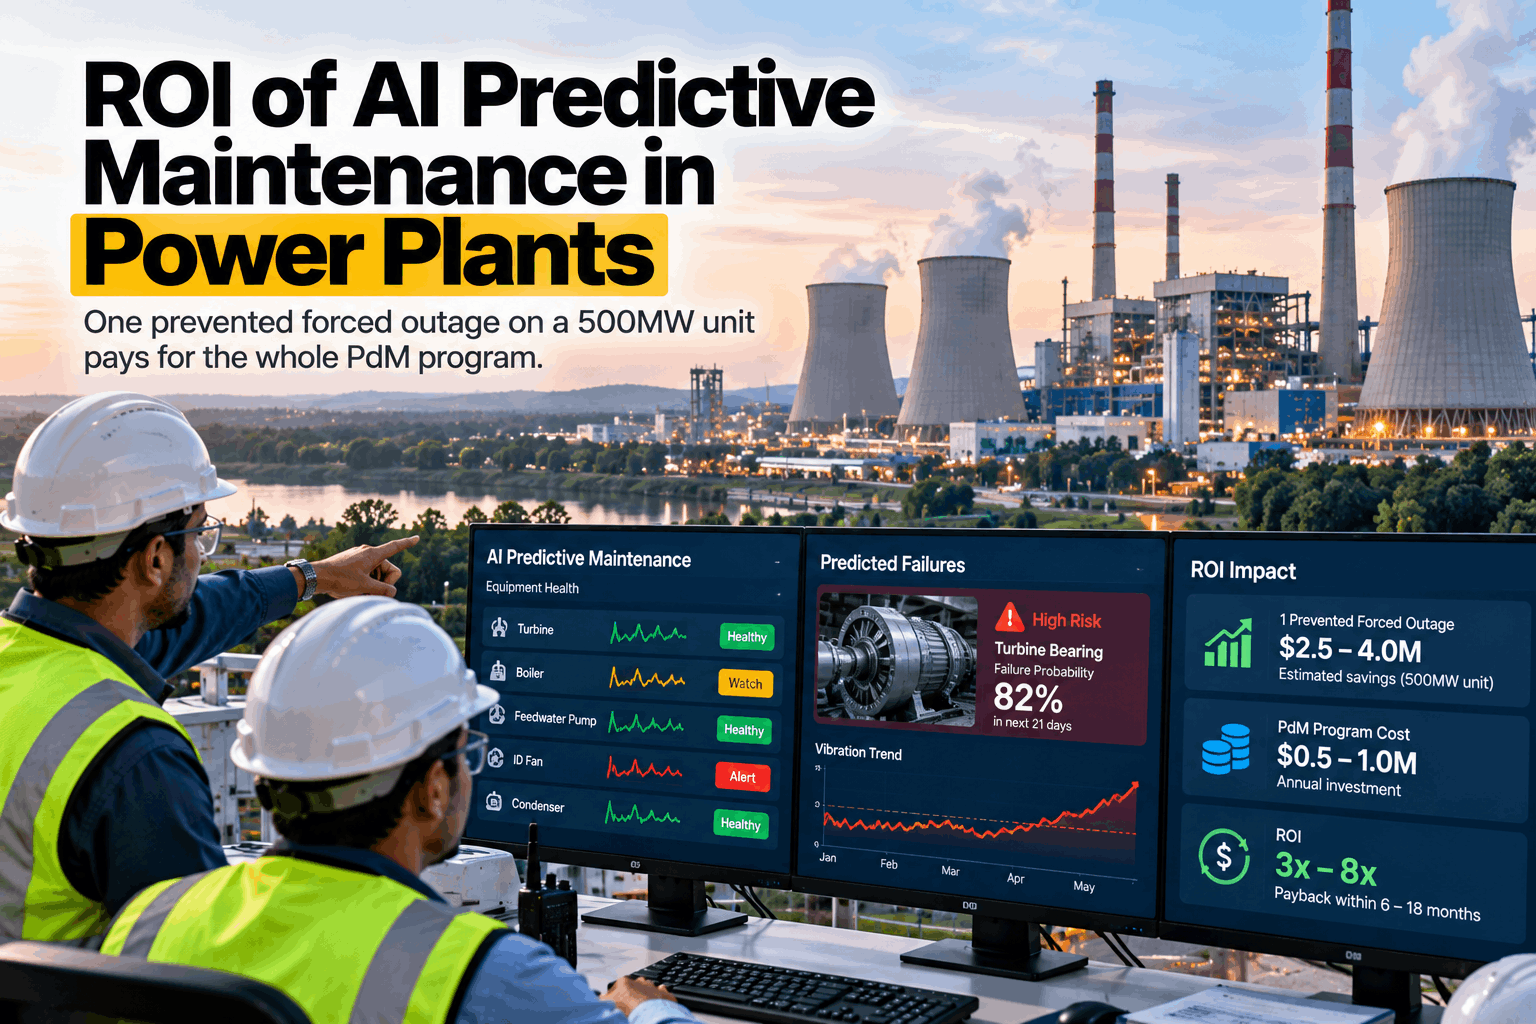
The business case for predictive maintenance in a power plant usually rests on one sentence: a single prevented forced outage pays for the programme. On the gross figures that is true. On a stricter net basis it is nearly true, and the difference is worth understanding before the numbers reach a finance review. This guide sets out the ROI arithmetic for a 500 MW unit line by line — what an outage really costs, how often early warning converts one into planned work, what published deployments have reported, and which costs are usually left out. To run the same model on your own unit, book an ROI session.
The ROI of AI Predictive Maintenance, Worked Through for a 500 MW Unit
Return comes from one thing: a failure seen early enough to be repaired at a time the plant chooses. iFactory watches DCS and historian data for the first signs, and the saving is the gap between a forced outage and the planned stop that replaces it.
- Net outage cost, not just lost revenue
- Three scenarios, including one that loses money in year one
- False alarms and people's time counted as costs
What One Forced Outage Really Costs
The figure usually quoted is lost revenue: 500 MW for 72 hours is 36,000 MWh, and at $40 per MWh that is $1.44 million, with perhaps $0.5 million of replacement power on top — $1.94 million. A finance reviewer will point out that the plant also did not burn fuel for those 72 hours. The defensible number is the net one: lost margin, plus the premium paid to cover commitments, plus what an emergency repair costs over a planned one, plus the restart. Both views are shown here, and every input should be replaced with your own. Our power specialists can help set them from your tariff and dispatch position.
The ROI Model: Probability Times Value
A predictive programme does not prevent every outage. Some failures give no warning in the data, and some warnings are not acted on in time. The honest model multiplies four things: how many major forced outages the unit has, the share with a precursor in the data, the share of those caught and acted on, and the saving each time. Smaller finds and maintenance no longer done on healthy equipment are added, and the cost of chasing false alarms is taken away. The base case uses a programme investment of $1.5 million for a 500 MW coal unit as a planning figure, with $300,000 a year to run it. To set these inputs from your own outage log, book a modelling call.
Does one prevented outage pay for the programme? On the gross figure of $1.94 million, yes — it exceeds the $1.5 million investment. On the net figure of $1.18 million, one converted outage covers about four-fifths of it, and the smaller finds cover the rest. Either way the result depends on roughly one good catch in the first year.
Test the Business Case on One Unit in Six Weeks
Choose one unit. We connect its DCS and historian, replay two years of data against its forced outage log, and report which past outages showed a precursor and how early — the two numbers the ROI model depends on.
What Published Deployments Show
Independent, quantified results from power generation are scarce, and most come from vendors. The best-documented programme is Duke Energy's monitoring and diagnostics centre, which was set up after a transformer failure that caused more than $10 million in damage. The figures here are as published by third parties and by iFactory; none has been audited by us. Our reliability team can talk through how each compares with your fleet.
384 finds, $31.5 million
Over three years the programme recorded 384 early finds and avoided $31.5 million in repair costs, using more than 30,000 sensors and 10,000 models. One vibration find alone avoided $4.1 million.
One catch above $34 million
The software supplier's account of the same programme reports savings of over $34 million from a single early catch in 2016, with five analysts covering more than 60 plants.
$4.2 million a year
A 1,200 MW coal station in the US Midwest: forced outages down from 23 to 9 a year, $4.2 million in documented first-year savings and payback in 8.4 months. The customer is not named.
What the numbers have in common: the value is lopsided. Duke's 384 finds average about $82,000 each, yet single events were worth $4.1 million and more. In the iFactory case, 14 fewer outages account for $1.86 million of the saving, about $133,000 each. Most finds are small. A programme earns its return from a few large ones — which is why the model separates major outages from smaller finds.
Where the Return Comes From, Asset by Asset
Not every asset repays monitoring equally. The return is highest where a failure takes the unit off or holds it at part load, where the failure develops over days or weeks, and where the signs are already in the data the plant collects. To rank your own assets this way, book a criticality review.
The Costs Business Cases Leave Out
A model that counts only benefits will not survive review, and it should not. McKinsey has described a programme where a 10% false-positive rate was enough to remove the savings altogether. These are the lines to include from the start.
False alarms
Every alert that leads nowhere costs an inspection and some trust. Count them, price them and track the rate.
People's time
Someone has to review alerts, decide and plan the work. An alert nobody acts on is worth nothing.
Missing instrumentation
Some critical assets have too few sensors for early warning. Adding them is a cost, and it should be in the plan.
Keeping models current
After an overhaul, a fuel change or a new operating regime, normal behaviour changes and models need retraining.
How to Build the Case From Your Own Data
The strongest business case contains no industry averages at all. It is built from the plant's own outage history, and it can be assembled in a few weeks. Our project engineers can supply the working sheet.
List the outages
Every forced outage and major restriction for two or three years, with duration and cause.
Price each one, net
Lost margin, replacement premium, repair premium and restart — using your tariff and what the unit was scheduled to do.
Ask what gave notice
For each, look back in the historian. Was there a change in the data, and how many days ahead?
Price the planned stop
What the same repair would have cost in a chosen window. The difference is the saving per event.
Add the costs
Programme, running cost, sensors, people's time and a false-alarm allowance. Then show three scenarios.
What the AI Adds to the Maintenance Team
A maintenance team already knows which machines matter. What it lacks is time to watch several thousand signals against load and ambient conditions. iFactory's models run on a GPU server inside the plant, learn each machine's normal behaviour, and bring a short list of changes to the morning meeting — with the evidence, and a record of what each alert led to.
- Early warning in context. A reading is judged against load, ambient and the machine's own history, not a fixed alarm limit.
- Precedents. Each alert is matched with earlier events that looked the same and what they turned into.
- An honest ledger. Every alert is closed as a find, a false alarm or still open, so the ROI is counted from outcomes, not promises.
- Plain-language answers. Planners ask about a machine, a trend or last quarter's results and get the data behind the reply.
Delivered as a Turnkey AI System — Hardware and Software Together
iFactory ships as a complete bundle: a pre-configured NVIDIA AI server, racked and ready, with the predictive models and analytics pre-loaded. Rack it, plug in power and Ethernet, and the AI is live on your network — plant data stays inside the station. Our team handles cabling, network setup, read-only connections to your DCS, historian, PLC and SCADA systems, links to your maintenance system, operator training and 24×7 remote monitoring. For a scoped proposal, book a deployment call.
Ship, network and data
Server delivered and racked. DCS and historian connected. Two years of operating data and the outage log loaded. Critical assets ranked with your team.
Model training and pilot
Models trained on the unit's own history and replayed against past outages. Live alerts begin on the top-ranked assets, reviewed weekly.
Go-live and training
Coverage extended across the unit. Maintenance, operations and planning teams trained. Alert ledger and ROI tracking handed over.
Frequently Asked Questions
Does one prevented forced outage really pay for a predictive maintenance programme?
Often, yes, on gross figures: a 72-hour outage on a 500 MW unit is commonly put near $2 million. On a net basis, after fuel not burned and the cost of the planned stop that replaces it, the saving in our worked example is about $1.18 million against a $1.5 million investment. One good catch plus the smaller finds covers the first year.
What payback period is realistic?
In the worked example, about 7.5 months from go-live in the base case, about 17 months in the conservative case and about 5 in the strong one. The spread comes almost entirely from how many major outages have a precursor in the data and how many alerts are acted on.
Why might the return be lower at our plant?
If the unit is often on reserve shutdown, lost margin per outage is small. If availability-based payments are already secured, extra hours earn less. If failures are sudden, with no warning in the data, there is less to convert. The pilot measures the last of these directly.
How much do false alarms matter?
A great deal. Each one costs an inspection, and enough of them teach people to ignore alerts. Count false alarms as a cost line, set a target rate, and review every alert's outcome so the models and thresholds improve.
Are the published savings figures reliable?
Treat them as direction, not proof. Most come from vendors or operators describing their own programmes, with different baselines. The US Department of Energy's 8–12% saving over preventive maintenance is among the better-founded. The strongest evidence for your case is a replay of your own outage history.
Do we need new sensors?
Usually not to begin. Most early warning comes from signals already in the DCS and historian. Gaps on specific critical assets are identified during the first weeks and priced separately.
How long does deployment take, and what do we need to provide?
A typical unit is live in 6–12 weeks. You provide rack space, power, an Ethernet connection, read access to the DCS or historian, the outage log for the last two years, and a maintenance lead for the pilot. iFactory supplies the pre-configured NVIDIA AI server, software, integration and training. To scope your station, contact our deployment team.
Build the Business Case on Your Own Outage Log
One turnkey system — NVIDIA AI server, predictive models, integration and training — delivered and live inside 12 weeks. Start with the unit whose last forced outage is still being argued about.
- 1Net cost of a major forced outage at your plant
- 2How many major outages a year
- 3Share with a precursor in the data
- 4Share of alerts acted on in time
- 5False-alarm rate and what each one costs