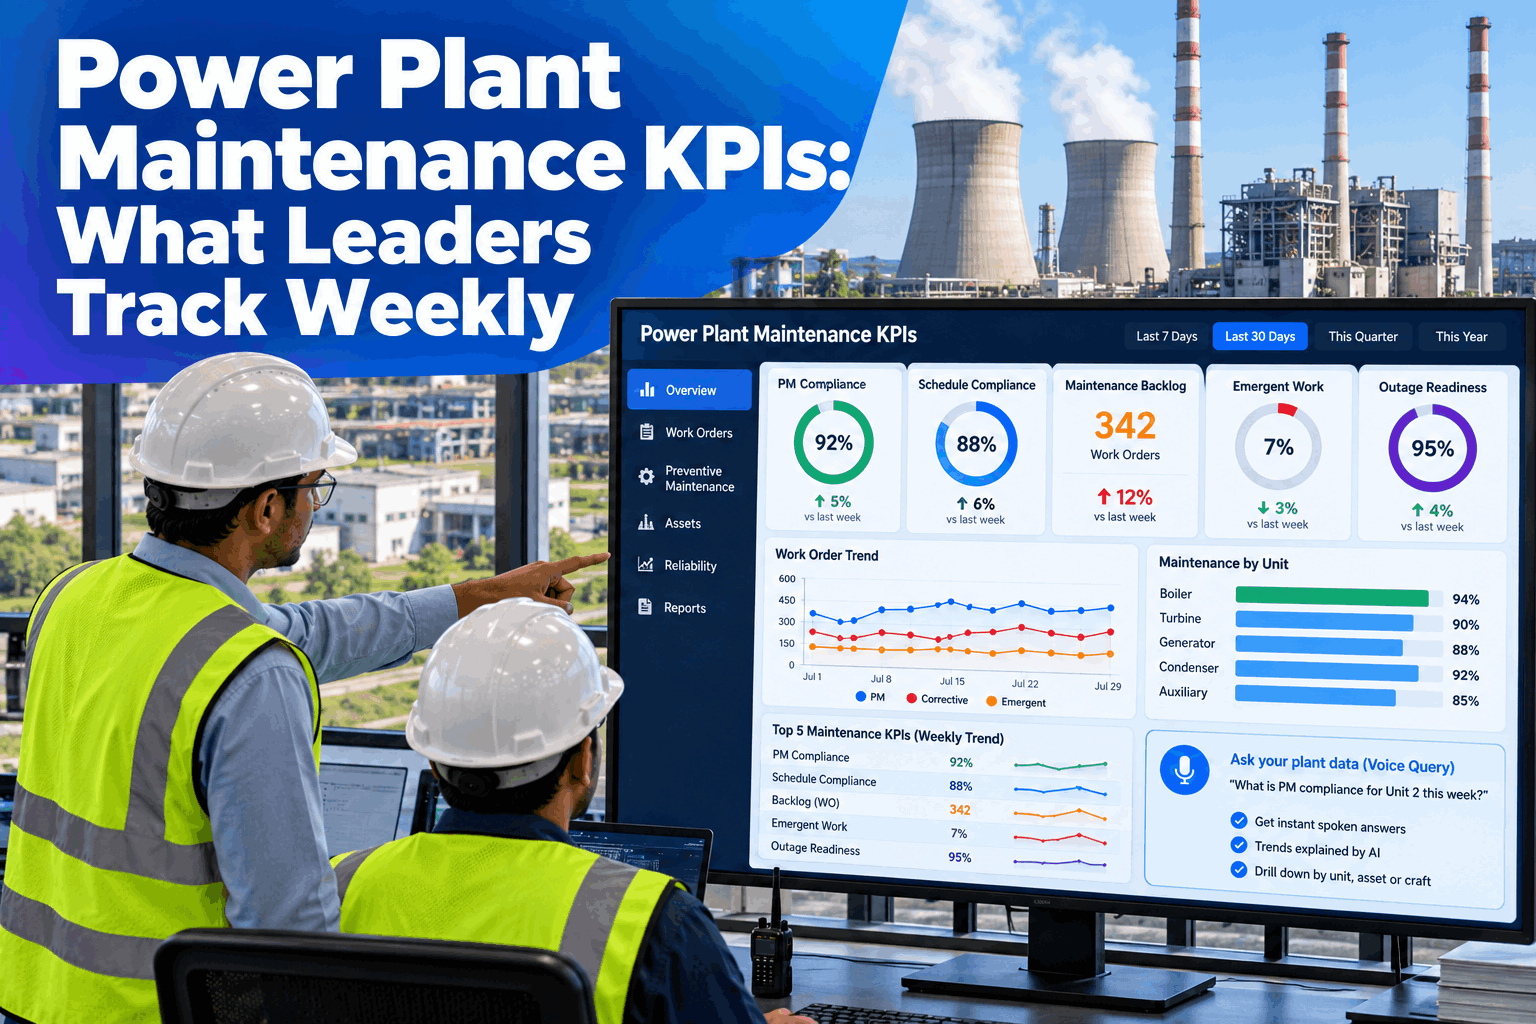
Every weekly maintenance meeting hits the same problem: the numbers arrive late, differ from unit to unit and mean different things to different people. Leaders who run reliable plants track a short list of KPIs, define each one once and see them refreshed from the work order system without anyone compiling a spreadsheet. This page covers the five KPIs worth reviewing every week, a worked example scorecard and how to put them on one board. Plant managers can see the board on their own data in a KPI walk-through.
Power Plant Maintenance KPIs: What Leaders Track Weekly
Track PM compliance, schedule compliance, backlog, emergent work and outage readiness by unit and craft, updated automatically from your work orders and explained by AI, on a turnkey on-prem server.
- Five KPIs, each with one written definition
- Unit and craft views, refreshed automatically
- Trends explained and answered by voice
Why Weekly Maintenance KPIs Lose Their Value
The meeting debates the number instead of the plant.
When two units calculate PM compliance differently, or the report is built by hand on Monday morning, the first half hour goes on whether the figure is right. A good KPI set removes that argument. Our maintenance analytics specialists can help you agree the definitions.
Mixed definitions
Each unit counts differently.
Manual reports
Figures compiled by hand, days late.
Number, no reason
A trend with no explanation.
Too many KPIs
Thirty measures, no actions.
The Five KPIs Leaders Review Every Week
Each one answers a different question about the plant.
The table is the template. Each KPI starts from records your plant already keeps, has a single formula and tells you where to look next. Set your own targets with your reliability and operations teams, as the right level differs by plant and equipment. See it built on your records in a working session.
Decide what counts as due, on time, emergent and ready, and apply it to every unit. A KPI that changes meaning between sites is a source of argument, not insight.
A Worked Example: One Weekly Scorecard
Five lines from one week of work orders.
Take a plant with 190 preventive tasks due this week, 160 jobs on the schedule, 2,400 open planned hours against 800 craft hours a week, 900 hours worked of which 180 were emergent, and 60 outage work packages in scope. All figures are illustrative, and the targets are examples to replace with your own.
See Your Own Maintenance KPIs on One Board
Bring a recent work order export and leave with the five KPIs calculated by unit and craft, with your definitions written down.
Read the KPIs Together, Not One by One
The pattern across KPIs points to the cause.
A single number rarely says what to do. Two moving together usually does. These are common patterns to check, and each should be confirmed against the work orders behind it.
PM down, emergent up
Deferred preventive work may be turning into breakdowns.
Schedule low, backlog flat
Look at planning, parts and access before crew capacity.
Readiness stuck, backlog up
Outage scope may be growing faster than packages are planned.
Ask the KPI Board a Question
Ask in plain words and get the answer with its reason.
Plant managers can ask the board by voice or text instead of opening reports. The answer comes from the same work orders as the dashboard, so the number and the explanation always agree. Try it on your own data in a live walk-through.
A Weekly Rhythm That Turns KPIs Into Action
A KPI is useful only if something changes after the meeting.
Keep the review short and the same every week. The board refreshes, the team reads the gaps, and each gap leaves the room with an owner. Plan the routine with our implementation team.
Refresh
KPIs update from work orders.
Review
Scan by unit and craft.
Explain
AI notes what moved and why.
Assign
Each gap gets an owner and a date.
Track
Next week shows the change.
Power Plant Maintenance KPI Best Practices
A short list, trusted by everyone, beats a long list nobody checks.
These are common gaps in maintenance KPI programs. A short readiness review can catch them before the first meeting.
What works
- One written definition per KPI
- The same data source for every unit
- Targets agreed with operations
- A trend and a reason, not a number alone
What fails
- Different formulas by unit or shift
- Reports built by hand every Monday
- Dozens of KPIs and no owners
- Targets copied from another plant
How iFactory Runs the Maintenance KPI Board
Definitions, data and answers in one place.
iFactory connects to your work order system, applies the definitions you agree and keeps the five KPIs current for every unit and craft, with AI explanations and spoken answers for plant managers. All of it runs on one on-prem server. Fit questions go to our solutions team.
KPI dashboard
Five KPIs by unit and craft.
Trend explanations
AI notes what moved and why.
Voice query
Spoken answers for plant managers.
Work order data
Figures come from the source records.
Outage readiness
Package status ahead of the outage.
On-prem
Maintenance data stays in the plant.
The figures and exchanges on this page are illustrative. Your own KPIs depend on your work order data, definitions and practices, and we measure them on your data during the pilot.
Turnkey AI: Delivered, Connected and Live in 6–12 Weeks
You do not build this. It arrives ready.
iFactory ships as a pre-configured NVIDIA AI server with the software pre-loaded, racked and ready. Rack it, plug in power and Ethernet, and the AI is live on your network. Our team handles cabling, network setup, PLC, SCADA, DCS and CMMS integration, operator training and 24×7 remote monitoring. Data stays on your network. For an implementation guide and a quote matched to your plant, request a turnkey quote.
Ship, network and connect
Server installed. Work order history connected and definitions agreed.
Setup and pilot
KPI board configured by unit and craft. Live pilot runs in a few areas.
Go-live and weekly review
Roll-out across the plant. Teams trained. Weekly review running from the board.
Frequently Asked Questions
Which power plant maintenance KPIs should leaders track weekly?
PM compliance, schedule compliance, backlog in weeks, emergent work percent and outage readiness. Together they show whether routine care, planning, capacity, reactive load and outage preparation are on track.
How is PM compliance calculated?
Divide preventive tasks completed on time by preventive tasks due in the period. Write down what counts as on time, such as a grace window, so every unit calculates it the same way.
What is a good emergent work percentage?
It depends on the plant, the equipment age and how work is classified, so set your own target from your history. The trend and its causes matter more than a single benchmark.
How do you measure outage readiness?
Divide the work packages that are planned and staged by the packages in scope, and track it each week ahead of the outage. Define what ready means, for example scope approved, parts available and permits drafted.
What are the best practices for maintenance KPIs?
Keep the list short, define each KPI once, use the same data source for every unit, agree targets with operations and review each trend with its reason and an owner.
Is there software that updates these KPIs automatically?
Yes. iFactory calculates the KPIs from your work order records, shows them by unit and craft, explains the trends and answers questions by voice, so nobody compiles a weekly report by hand.
What does it cost and what is the return?
Cost depends on the number of units, the systems connected and the modules chosen, so we issue a turnkey quote after a short scoping call. The return shows up as less time spent compiling reports and earlier warning of slipping KPIs, and the pilot measures both on your data.
How do we start?
Start with a short session using a recent work order export. A 6-week pilot then connects your records, agrees the definitions and runs the board in a few areas. To plan it, contact our team.
Put Your Weekly Maintenance KPIs on One Board
In thirty minutes we take a recent work order export, calculate the five KPIs for your units and show how the weekly review would run. You keep the definitions either way.
- 1A recent work order export
- 2Your current PM schedule and due list
- 3Your KPI definitions, if written
- 4Backlog and craft hours by unit
- 5Next outage scope and package list