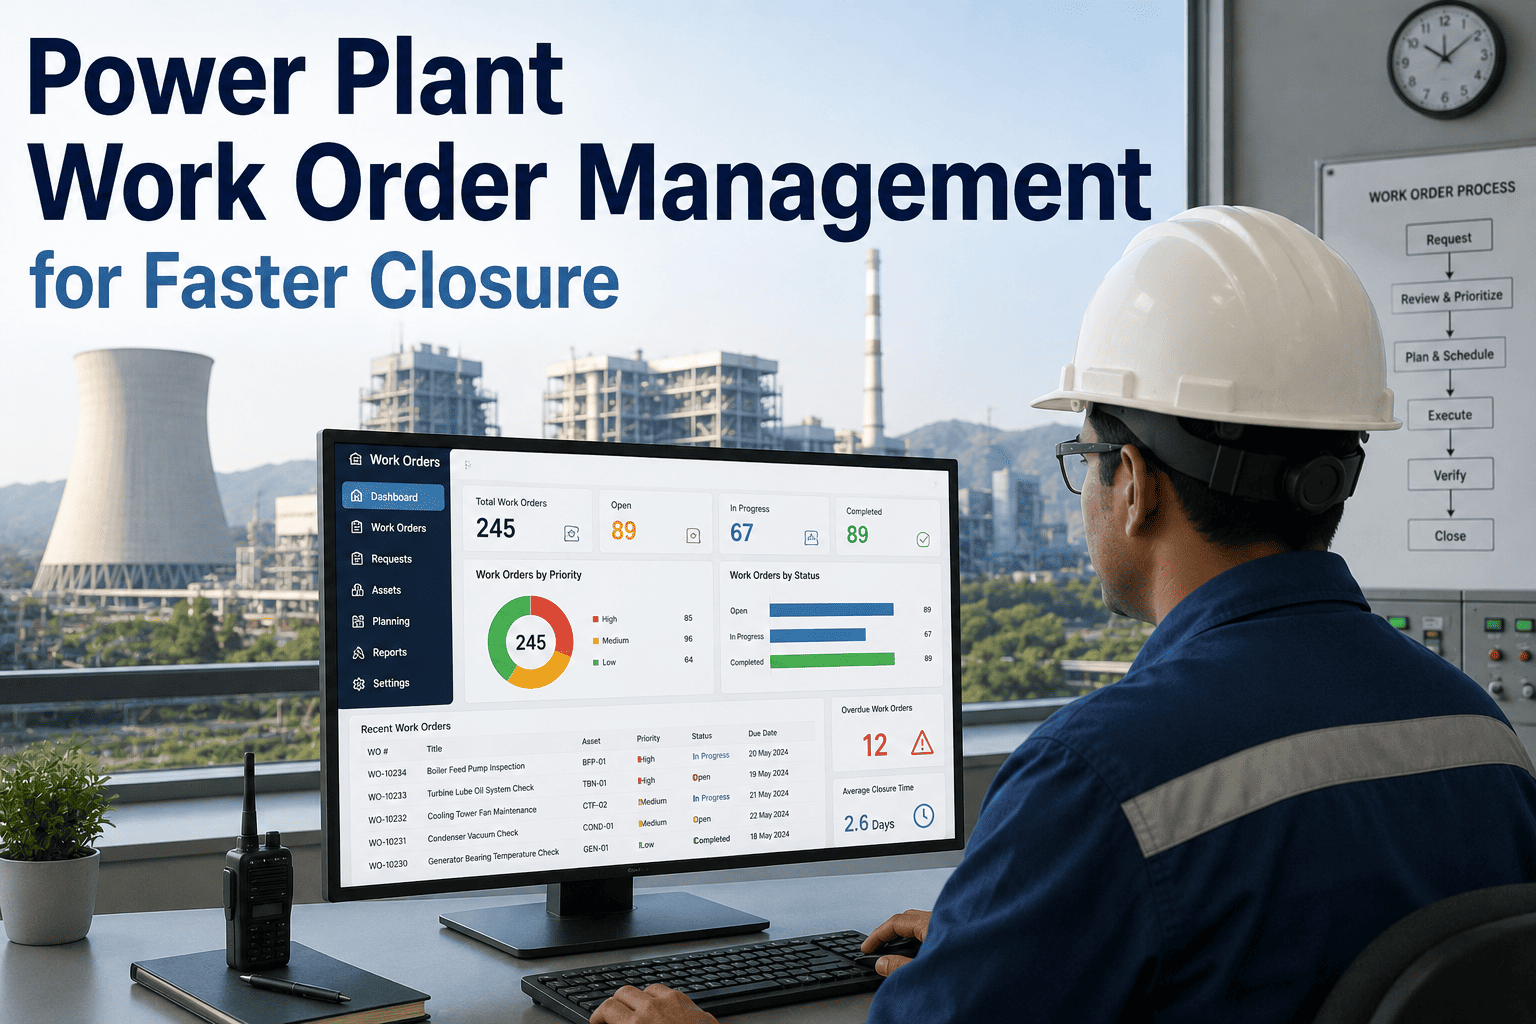
In most power plants, the maintenance backlog is not a list — it is a fog. A defect written on a log sheet during a night shift, a verbal "watch that bearing" passed to a supervisor already headed home, a corrective action that got done but never closed. The stakes are what make it different from any other plant: a deferred Tier A turbine job doesn't slow a line, it removes megawatts from the grid and triggers reliability penalties. Plants running without a structured work order system report reactive ratios of 35 to 50 percent — firefighting half the time — while a below-70-percent planned-maintenance ratio is the industry's definition of a team that has lost control of its backlog. The fix is giving every work order one visible path from raised to verified closed. To see how the analytics layer fits on top, book a demo.
MAINTENANCE RELIABILITY · POWER GENERATION · WORK ORDER MANAGEMENT
Every Work Order on One Path — From Raised to Verified Closed
Lost requests, no clear priorities, and work that's done but never closed are universal in power plants — and here they cost megawatts, not just minutes. A structured work order model puts every job on a tracked lifecycle so nothing gets left on a log sheet between shifts.
THE COST OF AN UNCONTROLLED BACKLOG
What a Fragmented Work Order Process Is Costing You
35–50%
Reactive maintenance ratio typical of plants running without a structured work order system
<70%
Planned-maintenance ratio that defines a team stuck firefighting instead of in control
47%
Backlog reduction reported within 90 days of moving to a structured digital work order system
90%+
PM compliance a controlled program targets — versus the 60–74% typical of paper and spreadsheets
A single deferred Tier A job — a gas-turbine bearing, a major feed pump, a compressor — is not one open ticket. It is systemic exposure that surfaces later as a forced outage, where every hour costs five figures in lost generation and reliability penalties. Getting every work order onto one tracked path removes the gaps that let those jobs slip.
THE SIX-STAGE WORK ORDER LIFECYCLE
Where Power Plant Work Orders Get Lost — and Where They Get Fixed
Every work order moves through the same six stages from creation to closure. Knowing exactly where your process breaks down is the starting point, because each stage has its own failure mode — and its own fix.
1
Request
Where it fails A defect spotted on rounds never gets written down, or lands as a verbal ask that dies at shift handover.
The fix Any operator raises a request from the field in under a minute — unit, asset tag, plain-language symptom, and a photo — no CMMS training required.
2
Triage
Where it fails Duplicate and low-consequence requests clog the queue, and priority is set by who shouts loudest rather than asset criticality.
The fix A request is reviewed, de-duplicated, linked to the correct asset in the register, and assigned a priority tier by consequence before it becomes an active work order.
3
Assign
Where it fails The wrong crew gets the job, or it waits on a part nobody confirmed was in the storeroom before work started.
The fix The order routes to the right skill set with the procedure, LOTO and permit requirements, and parts availability all confirmed up front.
4
Execute
Where it fails Status lives in one technician's head, so nobody else knows if the job is started, blocked, or waiting on a unit to come offline.
The fix The technician updates status, labor, and parts from a mobile device in the field, so the whole team sees live progress on every open order.
5
Close
Where it fails Work gets done but never formally closed, creating phantom backlog and corrupting every reliability report built on it.
The fix Closure requires the technician to record findings, failure code, and parts used, with photo evidence — the same asset-linked record that satisfies NERC and OSHA.
6
Analyze
Where it fails Closed orders are archived and forgotten, so the same asset fails the same way with no one connecting the pattern.
The fix Completed orders feed backlog-by-tier, MTBF, MTTR, and repeat-failure reports that show where to tighten PM and routing next.
See where your work orders are getting stuck
iFactory reads your work order and asset data to reveal where requests are lost, deferred behind lower-priority jobs, or closed without a record — and turns closed-order history into failure-pattern insight.
WHEN EVERYTHING IS URGENT, NOTHING IS
A Priority Model Built on Asset Criticality, Not Volume
The biggest driver of a chaotic backlog is the absence of an objective priority system. When priority is set by requestor pressure instead of consequence, a cosmetic job competes with a forced-outage risk for the same crew. A tier model tied to asset criticality replaces that with a rule everyone can see.
Emergency
Immediate response
A unit trip, a safety hazard, or a failure actively removing capacity from the grid. Bypasses standard approval and goes straight to the top of the queue.
Tier A Critical
Same-day / next-window
A developing fault on a high-consequence asset — gas turbine, major pump, compressor — that risks a forced outage if left. Scheduled ahead of routine work.
Routine
Planned window
Wear and minor faults that need attention soon but do not threaten the current run. Planned into the next available window with parts staged.
Deferrable
Next outage
Non-critical work batched into the next planned outage, so it never pulls a crew off higher-tier work or a forced-outage response.
LOG SHEET VS. CONNECTED WORK ORDERS
What Actually Changes on the Maintenance Floor
The work does not change — turbines still need their inspections, pumps still need their overhauls. What changes is whether every order is visible, prioritized by consequence, and provably closed, or whether half of them live in someone's memory until they become a forced outage.
| Work Order Factor |
Log Sheet / Spreadsheet |
iFactory-Connected System |
| Raising a request |
Verbal, log sheet, or radio — often never logged |
Under-60-second mobile submission with photo |
| Setting priority |
Whoever applies the most pressure |
Objective tier by asset criticality and consequence |
| Assignment |
Whoever's nearest, parts checked later |
Right crew, with parts, LOTO, and permits confirmed first |
| Status visibility |
Lives in one technician's head |
Live status on every open order, plant-wide |
| Closure |
Often done but never formally closed |
Findings, failure code, and photo required to close |
| Regulatory record |
Reconstructed from paper when the auditor arrives |
Timestamped NERC / OSHA trail already built |
THE KPIs THAT TELL YOU IT'S WORKING
Six Numbers a Power Plant Should Watch
Once every work order runs through one system, the backlog stops being a guess and becomes a set of live numbers. These six most directly reveal whether a plant's maintenance program is gaining or losing ground.
Backlog by Priority Tier
Size and age of open orders split by tier — the fastest signal that Tier A work is being deferred behind lower-consequence jobs.
Planned Maintenance Percentage
Share of work that is scheduled versus reactive. Below 70% means firefighting; above 90% means maintenance is controlled and budgetable.
Mean Time to Repair
Failure-to-restoration time by asset. A connected system cuts it 20–30% through faster coordination and mobile repair history.
PM Compliance Rate
PM orders completed on or before their due date — the leading indicator most tightly correlated with MTBF improvement over 6–12 months.
Reactive Maintenance Ratio
Reactive versus planned work. Moving from 40% to 20% reactive is tied to a 25–35% reduction in maintenance cost per MWh.
Schedule Compliance
Whether PM orders are completed in the planned week. Low compliance even with high PMP quietly builds the backlog that becomes a failure.
Turn your backlog from a fog into a roadmap
Give your maintenance team a single consequence-ranked queue, mobile closure with photo evidence, and live reliability KPIs — so work gets done in the right order and provably closed.
FREQUENTLY ASKED QUESTIONS
Common Questions About Power Plant Work Order Management
What's the difference between a work request and a work order?
A work request is an unvalidated notification that maintenance may be needed — anyone on rounds can raise one. It only becomes a work order after a planner reviews it, confirms it is valid, assigns a priority tier by asset criticality, and allocates resources. That two-step gate keeps duplicate and low-consequence requests from clogging the active queue while making sure nothing real falls through the transition. In a plant where a missed Tier A defect can become a forced outage, that gate is what protects the crew's time for the work that actually matters.
How do we prioritize when every unit supervisor says their job is urgent?
Use a tier model based on asset criticality and consequence of delay, not requestor pressure. Emergency covers a trip or a capacity-removing failure, then Tier A critical, routine, and deferrable each carry a defined response expectation. Because the rule is visible and applied the same way every time, a cosmetic job can no longer outrank a gas-turbine bearing simply because someone pushed harder. The criticality ranking comes from the asset register, so the priority reflects grid and safety consequence rather than who asked last.
How does work order closure tie into NERC and OSHA compliance?
Closure that requires findings, a failure code, parts used, and photo evidence produces exactly the timestamped, asset-linked record these standards expect, captured on every work order whether reactive or planned. Because the record is built at the point of work rather than reconstructed before an audit, a compliance history package for any date range or asset is generated on demand instead of compiled over weeks. That turns audit prep from a six-week scramble into a report, and closes the documentation gaps that manual assembly inevitably leaves.
Won't a formal system slow down simple jobs and get bypassed?
It should not — over-engineering approval is a real failure mode that pushes technicians toward workarounds. Match approval complexity to the work: routine, low-consequence jobs can move straight to assignment, while only high-cost or unit-affecting work routes through additional review. The goal is to remove friction from real work, not to add three approval steps to a filter change. Mobile field entry with under-a-minute request capture is specifically designed so that logging a job is faster than not logging it.
Where does iFactory fit alongside our work order system?
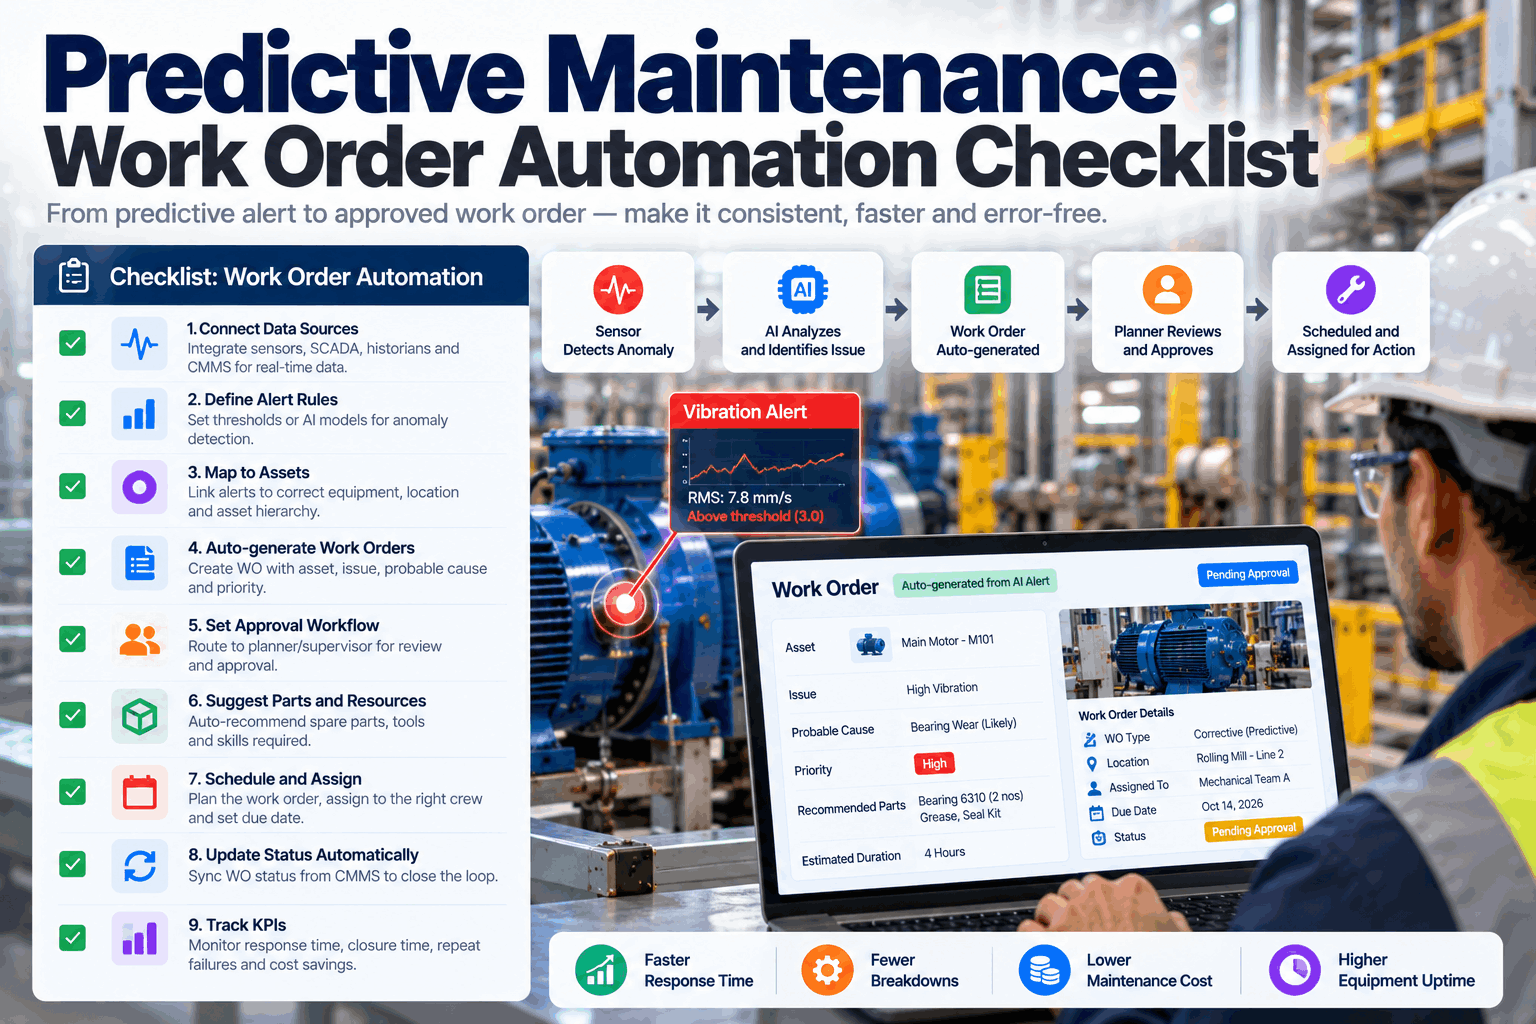
iFactory is the analytics and AI layer that reads the work order, closure, and asset data your system captures and turns it into failure-pattern and reliability insight — backlog-by-tier trends, repeat-failure detection, and predictions that route back in as prioritized work orders. The work order system remains the system of record for requests, priority, and closure; iFactory makes that accumulated history predictive rather than just historical. Better closure discipline means better prediction, which is why the six-stage lifecycle and the analytics layer reinforce each other.
Contact our support team to see how the layers fit your setup.
NOTHING LEFT ON A LOG SHEET
Put Every Power Plant Work Order on One Tracked Path
From the defect raised on rounds to the photo-verified closure that satisfies NERC, iFactory keeps every work order visible, prioritized by consequence, and provably done — and turns your backlog into a roadmap the whole team can see.