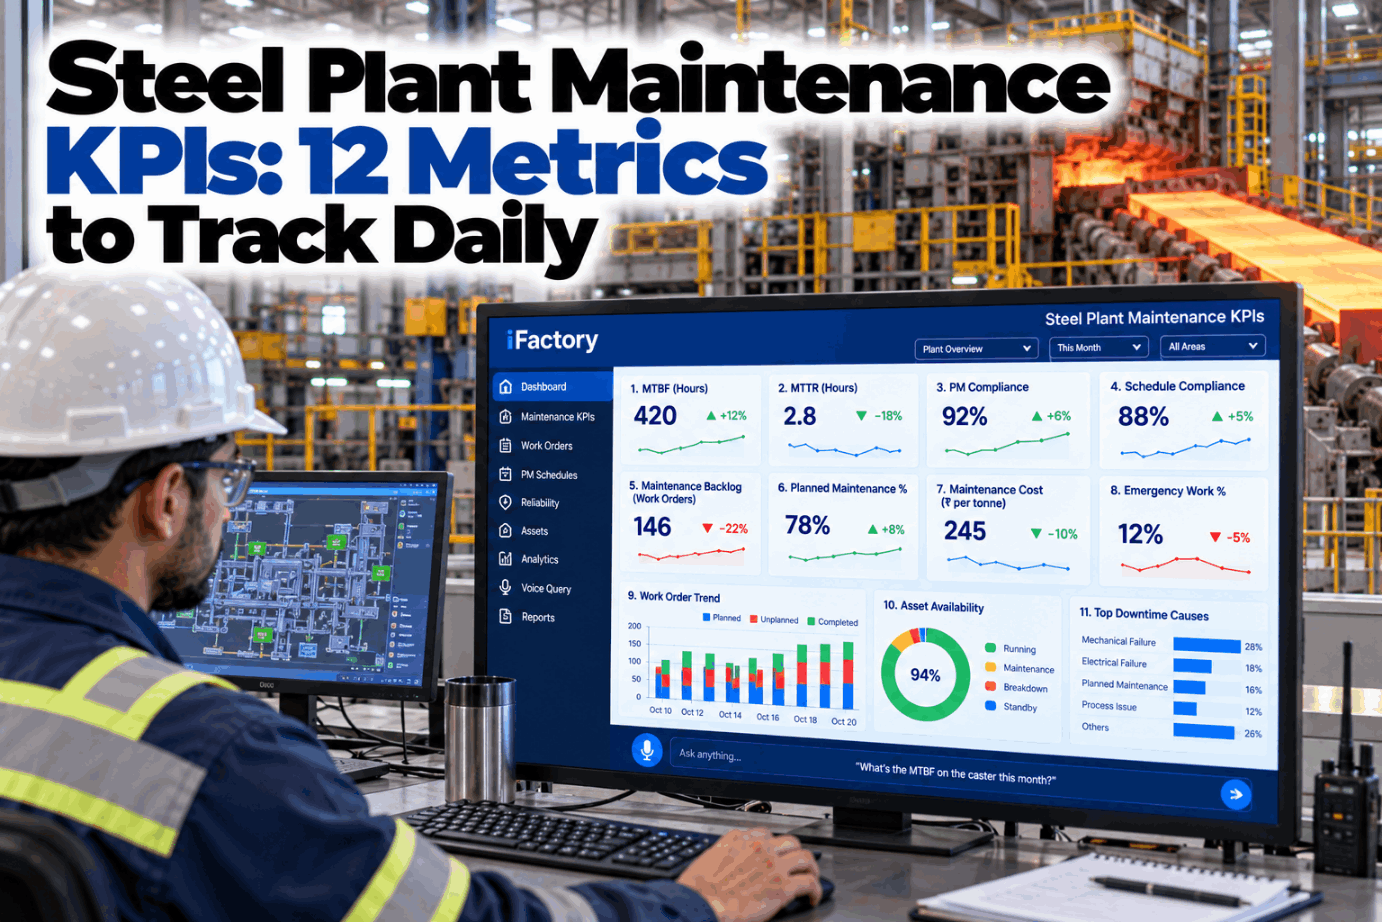
A steel plant produces more maintenance data in a day than most teams can read in a week. Stop logs from the caster, delay sheets from the hot strip mill, work orders and PM records all sit in different places, so the morning meeting argues about numbers instead of acting on them. The answer is a fixed list of steel plant maintenance KPIs, calculated the same way every day from the same records. See how a manager can simply ask for any of them in a short voice KPI demo.
KPI DASHBOARD · VOICE QUERY · STEEL
Ask for MTBF on the Caster and Hear the Number With Its Cause
iFactory calculates maintenance KPIs by area from your stop logs, work orders and PM records, and refreshes them every shift. Ask out loud for a metric on any area and the answer comes back spoken, with the trend and what is driving it.
Voice query · Maintenance managerListening
"What's MTBF on the caster this month?"
Caster 2 · MTBF, October136 h
Down from 171 h in September
Main driverSegment 6 roll bearings, 3 of 5 stops
Repeat failures2 this month
STEEL PLANT MAINTENANCE KPIS
The 12 Metrics, Their Formulas and How Often to Judge Them
Twelve is enough. Each metric below answers one question, has one formula and comes from records your plant already keeps. "Track daily" does not mean every number should be judged daily. All twelve refresh every shift, but some, such as MTBF, only make sense over a rolling month, while delay minutes and work order completion are judged shift by shift. Agree the list and the definitions with our KPI support team.
MTBF MTTR STEEL
Three Reliability Numbers From One Caster Stop Log
MTBF, MTTR and availability all come from the same stop log, so they must agree with each other. The example below uses an illustrative month on a slab caster: 720 calendar hours, a 24-hour planned shutdown and five unplanned stops. Planned stops such as the shutdown and routine tundish changes are kept out of the failure count, or MTBF will look worse than the equipment really is. Check your own stop coding in a caster KPI session.
Caster 2 · October stop logIllustrative
Stop 1Segment 6 roll bearing3.5 h
Stop 2Mould oscillator hydraulic leak2.0 h
Stop 3Segment 6 roll bearing4.0 h
Stop 4Tundish car drive fault1.5 h
Stop 5Segment 6 roll bearing3.0 h
Total5 unplanned stops14.0 h
Planned operating time720 − 24 = 696 hUptime 696 − 14 = 682 h
1 · MTBF682 ÷ 5 = 136.4 hHours run between breakdowns
2 · MTTR14 ÷ 5 = 2.8 hAverage hold per breakdown
3 · Availability682 ÷ 696 × 100 = 98.0%Cross-check: 136.4 ÷ (136.4 + 2.8) = 98.0%
SCHEDULE COMPLIANCE AND PLANNED MAINTENANCE PERCENTAGE
Six Work Control Metrics for One Hot Strip Mill Week
These metrics show whether maintenance runs to a plan or reacts to the day. SMRP, the Society for Maintenance and Reliability Professionals, publishes standard definitions. Its PM compliance metric counts PM and PdM work orders completed by their due date, and a site must state what "on time" means and keep it fixed. All figures below are assumed, so the arithmetic can be checked. Ask our support team for a formula sheet.
4 · PM compliance92.5%
111 done in window ÷ 120 due × 1005 · Schedule compliance87.0%
1,566 h done ÷ 1,800 h scheduled × 1006 · Planned maintenance %75.0%
2,100 planned h ÷ 2,800 total h × 1007 · Emergency work %12.0%
336 emergency h ÷ 2,800 total h × 10010 · Work order completion, today90.0%
45 closed ÷ 50 due today × 1008 · Backlog weeks3.0 weeks
8,400 ready h ÷ 2,800 crew h per week
Why work order completion, not wrench time
Wrench time, the share of a shift spent on hands-on work, is measured by observation studies a few times a year. It cannot be refreshed daily from records. Work order completion can, and it tells the morning meeting whether yesterday's promises were kept.
MAINTENANCE COST KPI
Cost per Tonne and Repeat Failures, the Steel-Specific Pair
Steel plants talk in tonnes, so cost per tonne is the maintenance number finance understands. It needs care: when output rises, cost per tonne falls even if spending does not, so always show it next to total spend. Repeat failures are the clearest sign that repairs treat symptoms. On the caster above, three of five stops were the same bearing, so two of them were repeats. Review both with our reliability engineers.
9 · Maintenance cost per tonne
Maintenance spend, month, assumed$2,340,000
Tonnes produced, month, assumed390,000 t
$2,340,000 ÷ 390,000 = $6.00 per tonne
Fix the tonnage basis once, such as liquid steel or hot rolled coil, and include labour, parts and contractors.
11 · Repeat failure rate
Failures, plant, last 30 days, assumed40
Same asset, same failure mode within 30 days6
6 ÷ 40 × 100 = 15%
Caster 2 alone: 2 repeats ÷ 5 failures × 100 = 40%, which points straight at segment 6.
STEEL PLANT MAINTENANCE KPIS EXAMPLES
Delay Minutes per Shift on the Hot Strip Mill
This is the metric the mill feels first. Every delay on a critical asset gets a code, and only maintenance-coded delays count here. Roll changes and planned stops belong to production. The illustration shows one day across three eight-hour shifts. Shift C carries more than half the total, most of it from one coiler, which is exactly what the morning meeting needs to see. Set up delay coding with our support team.
020406080 min
Shift A281442 minF4 stand hydraulic leak 28 · Pyrometer fault 14
Shift B1818 minRun-out roller motor 18
Shift C552075 minCoiler 2 mandrel 55 · Descaler header 20
Day total42 + 18 + 75 = 135 min
12 · Delay minutes per shift135 ÷ 3 = 45 min
Critical-asset downtime135 ÷ 60 = 2.25 h
Ask the Board a Question Instead of Reading It
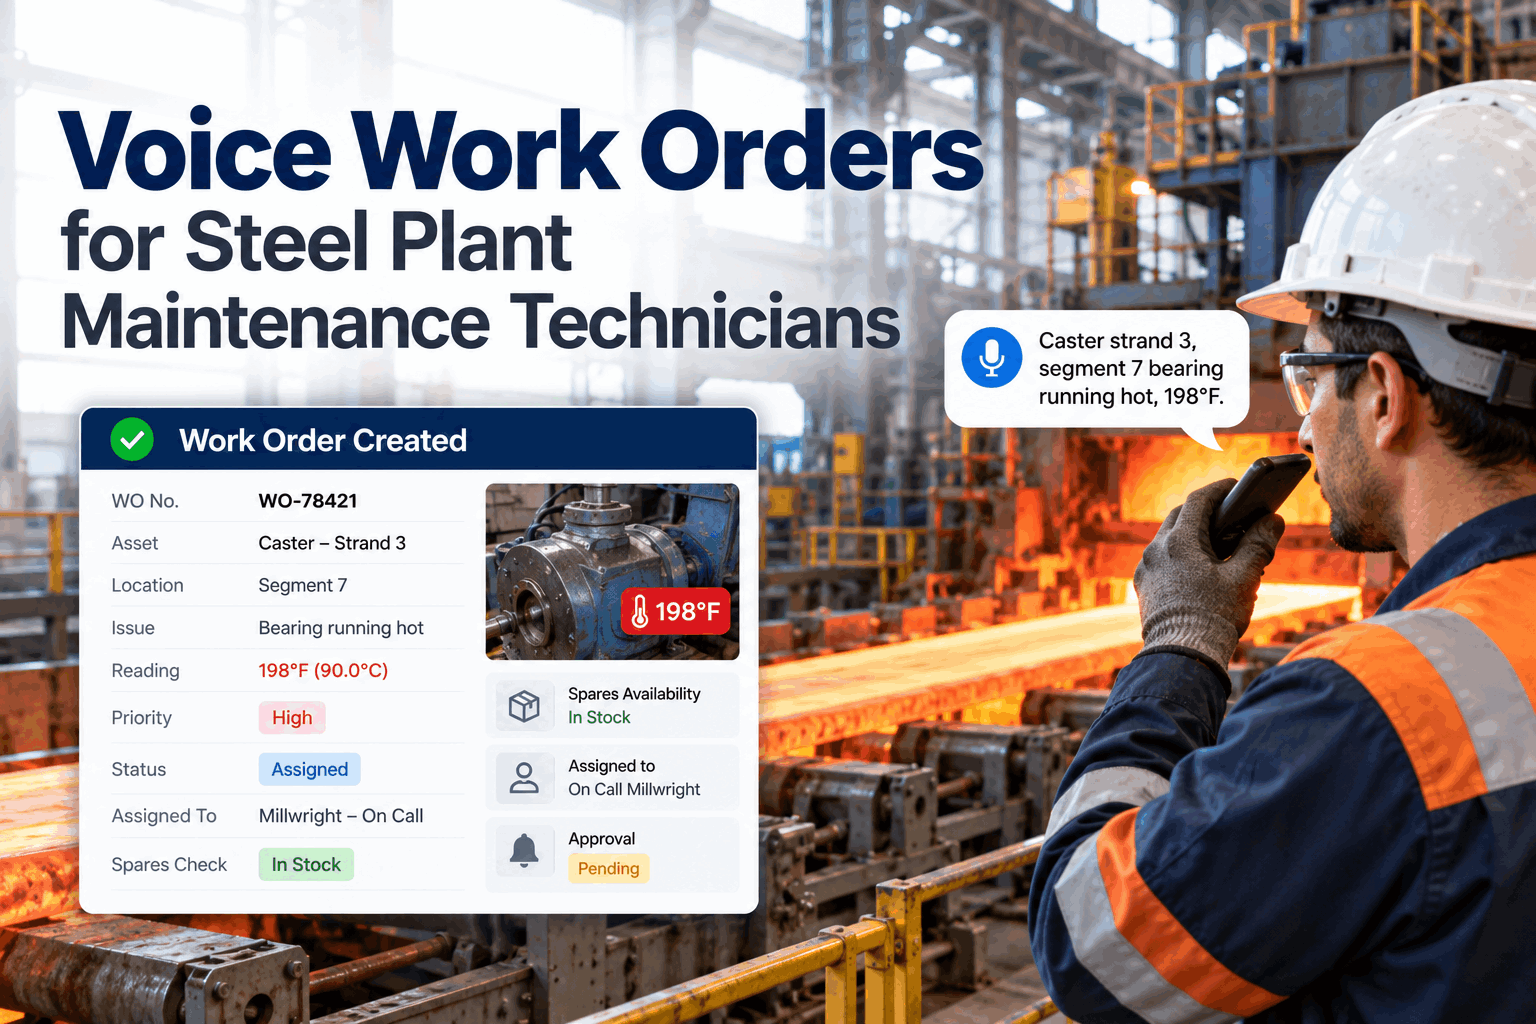
iFactory calculates every KPI from source records by area, so nobody builds the pack by hand. Ask by voice from the pulpit or the office, hear the number and its trend driver, and open the stops behind it when something looks wrong.
Morning meeting · Area manager and iFactory
Area managerWhy is emergency work at 18% on the hot mill today?
iFactoryCoiler 2 mandrel on night shift took 55 minutes and two fitters for three hours. Without it, today is at 11%.
Area managerHas that mandrel failed before?
iFactoryOnce, 19 days ago, same failure mode. It now counts as a repeat failure. Shall I raise an RCA work order?
WHEN A NUMBER MOVES
Where to Look First When MTBF Falls
A KPI is only useful if the team knows what to check next. The twelve metrics link to each other, so a falling result usually has a cause one level down in the planning metrics. Follow the questions in order, and stop at the first one that answers yes. Walk through your own logic in a KPI review session.
MTBF on an area falls for two weeks running
Q1Is the repeat failure rate up on that area?
YesRun a root cause analysis on the top repeat asset before anything else.
Q2Has PM compliance on those assets slipped?
YesFind the missed PMs and why they moved, such as no access window or no parts.
Q3Is emergency work % rising while schedule compliance falls?
YesThe crew is firefighting. Protect planner time and the weekly schedule.
Q4Is backlog above your upper limit?
YesWork is waiting too long. Add contractor hours or recover shutdown time.
DAILY KPI ROUTINE
A 24-Hour Rhythm Built Around the Shift Change
Daily tracking works when the refresh and the meetings line up. Numbers refresh at each shift end, area teams look at their own board first, and the plant meeting only sees exceptions. Weekly and monthly reviews use the same formulas over longer windows. Plan your own rhythm with our support team.
06:00
Shift C ends, KPIs refreshDelay minutes, work order completion and emergency % for the night07:30
Area huddlesCaster, hot mill and raw materials each review their own 12 numbers08:15
Plant meetingOnly exceptions: anything outside its band and every repeat failureFriday
Weekly reviewPM and schedule compliance, planned %, backlog weeksMonth end
Reliability and costMTBF, MTTR, availability and cost per tonne by area
STEEL PLANT MAINTENANCE KPIS TEMPLATE
A One-Page Definition Card for Every Metric
Most KPI arguments are really definition arguments. Write one card per metric before the board goes live, and change it only through a dated revision. The card below is filled in for MTBF on the caster. Ask our KPI specialists for blank cards for all twelve.
KPI definition cardMetric 1 of 12 · Revision 3
MetricMTBF, Caster 2
FormulaUptime ÷ unplanned failures
Counts as failureAny unplanned stop over 10 min needing maintenance
ExcludedPlanned shutdowns, tundish changes, waiting on ladle
Data sourceCaster stop log and corrective work orders
Refresh and windowEvery shift, judged on rolling 30 days
OwnerCaster maintenance superintendent
Action bandBelow your own baseline for 2 weeks: run the MTBF question path
STEEL PLANT MAINTENANCE KPIS BEST PRACTICES
Five Habits, and the Implementation Order That Works
Dashboards rarely fail. Definitions, coding and follow-up do. Treat this list as the implementation guide too: the habits are in the order most plants put them in place, starting with stop coding and ending with targets. Get help with any step from our support team.
1Code every stop at sourceFailure, planned, production or external, chosen by the operator at the time, not by a clerk days later.
2Close work orders with real timesStart, finish and failure mode on every job, or MTTR and repeat failures will be guesses.
3Build three months of baselineRecalculate the past quarter with the new definitions before anyone sets a target.
4Give each KPI one ownerOne named person per metric per area, who answers for it in the meeting.
5Act on one weak metric at a timeChoose the weakest, agree one action, check it next week. Twelve open fronts close none.
TURNKEY AI DEPLOYMENT
KPI Engine, Voice Query and AI Server in One Package
iFactory delivers the KPI dashboard and voice query as a turnkey system. A pre-configured NVIDIA AI server ships racked and ready, with connectors to your CMMS, stop logs and production records, so KPIs are calculated on site. You rack it, plug in power and Ethernet, and the AI is live. To scope it for your areas, request a turnkey quote.
What's Included
- Pre-configured NVIDIA AI server, racked and ready
- Connectors for CMMS, stop logs and delay records
- All 12 KPIs pre-built with editable definitions
- Area boards for caster, mills and raw materials
- Voice query with spoken read-back and answers
- Trend driver analysis behind every number
- 24×7 remote monitoring of models and hardware
Live in 6–12 weeks
Wk 1–4
Connect and Define
Server installed, data sources linked, definition cards agreed for all twelve metrics.
Wk 5–8
Baseline and Check
Three months recalculated, numbers checked against your own reports by area.
Wk 9–12
Go-Live and Voice
Area boards and voice query switched on, owners trained, daily rhythm started.
HOW iFACTORY FITS
Steel Plant Maintenance KPIs Software You Can Talk To
iFactory is built for plants where managers are on the floor more than at a desk, and where one area's numbers must be comparable with the next. Our support team can walk you through a pilot area.
1
Calculates KPIs automatically by area. All twelve metrics come from source records, never from typed-in totals.
2
Answers voice questions. Ask for MTBF on the caster this month and hear the number with its read-back.
3
Explains the trend driver. Every answer names the asset, stop or failure mode moving the number.
4
Refreshes every shift. Boards are current at the shift change, ready for the morning meeting.
1000+
Industrial clients running iFactory
99.9%
Platform uptime for round-the-clock mills
6-12 wks
From racked server to live KPI boards
FREQUENTLY ASKED QUESTIONS
What Steel Plant Managers Ask About Maintenance KPIs
Which maintenance KPIs should a steel plant track daily?
Refresh all twelve every shift, but judge them on the right window. Delay minutes per shift, work order completion and emergency work % are judged daily. PM compliance, schedule compliance, planned % and backlog are weekly. MTBF, MTTR, availability, repeat failures and cost per tonne need a rolling month.
How do you calculate MTBF and MTTR for a caster?
MTBF is uptime divided by the number of unplanned failures. MTTR is total repair downtime divided by the number of repairs. Keep planned shutdowns and tundish changes out of both. In the example above, 682 hours of uptime and five stops give an MTBF of 136.4 hours and an MTTR of 2.8 hours.
What counts as "on time" for PM compliance?
Your site has to decide and write it down. SMRP's PM compliance metric counts PM and PdM work orders completed by their due date, with defined options for the grace window. Many sites use a window tied to the PM interval. Whatever you choose, keep it fixed so months can be compared.
Why use cost per tonne instead of total maintenance cost?
Use both. Cost per tonne lets you compare months with different output and talks the language of a steel business. But it falls when output rises, even if spending does not. Showing total spend beside it stops a busy month from hiding rising costs.
How does the voice query know which asset I mean?
iFactory uses your plant's own asset names and area structure, so "the caster" or "coiler 2" maps to the right records. It reads back what it heard, such as "Caster 2, MTBF, month to date", before answering. If a name is unclear, it asks which one you mean.
How do we start without a long project?
Pick one area, such as the caster or hot strip mill. Agree definition cards for the twelve metrics, connect the stop log and CMMS, and recalculate three months as a baseline. Then switch on the board and voice query for that area. Our
support team can plan the pilot with you.
Twelve Numbers, Every Shift, One Question Away
Put steel plant maintenance KPIs on a board that refreshes itself and answers out loud. The system is delivered turnkey and goes live in 6 to 12 weeks.
Example morning board · Hot strip mill
Delay minutes per shift45 min
Work order completion90%
Emergency work, this week12%
Backlog3.0 weeks
Every number linked to its source records