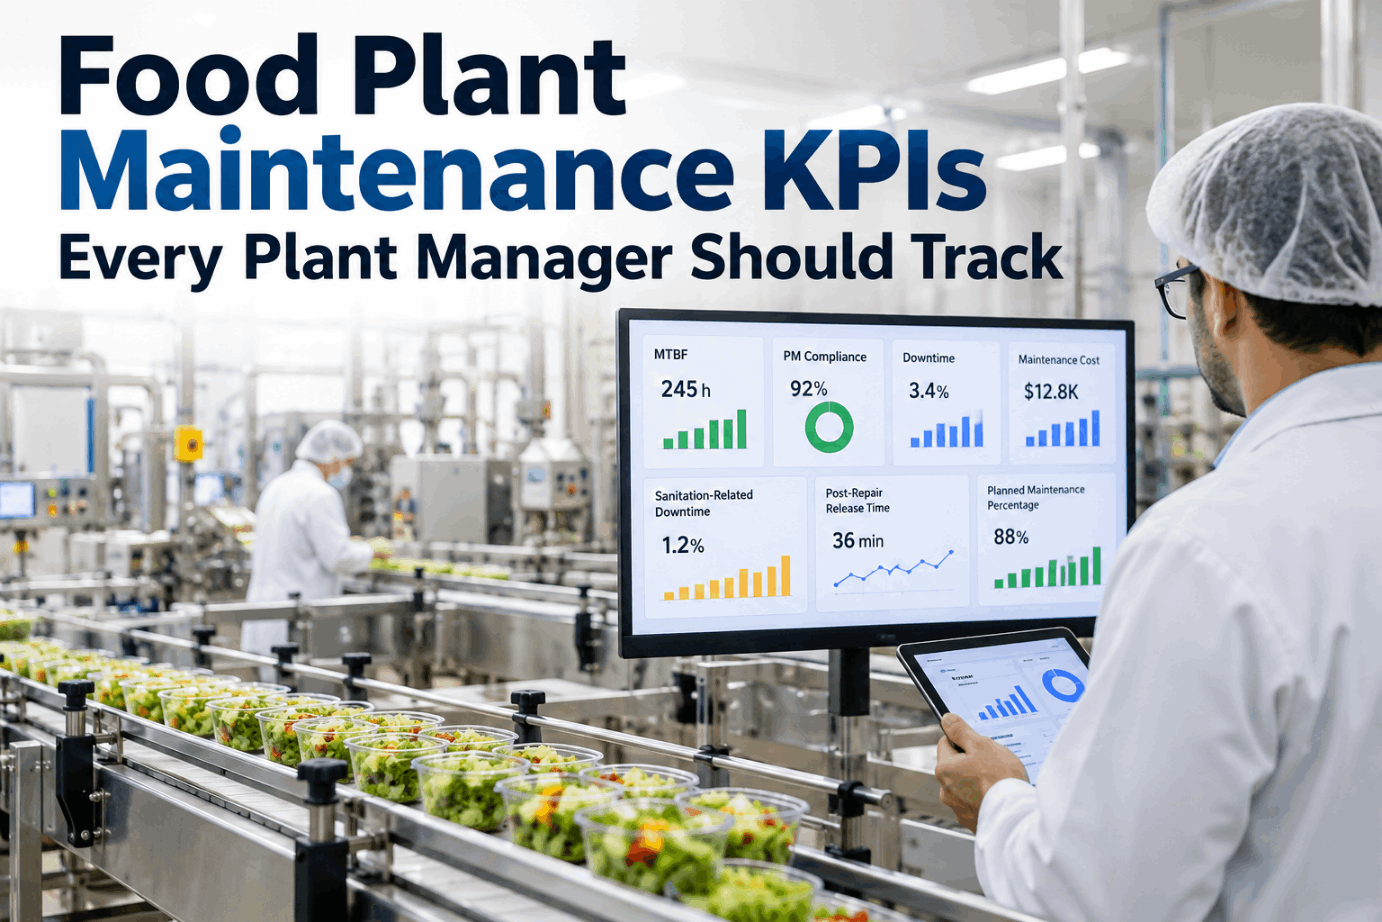
Most food plants already collect more maintenance data than anyone reads. Work orders, downtime codes, sanitation logs and QA sign-offs sit in different places, so the monthly KPI pack is built by hand and is out of date before the meeting starts. The fix is not more metrics but a short list of food plant maintenance KPIs with fixed formulas, calculated the same way every week. Hear how a plant manager can simply ask for them in a short KPI dashboard demo.
Ask for Any Maintenance KPI and Hear the Answer With the Trend
iFactory calculates food-specific maintenance KPIs automatically from work orders, downtime and sanitation records. Ask out loud for post-maintenance release time on line 3, and the answer comes back spoken, with the trend and the slowest event.
Three Layers of KPIs, From Results to Causes
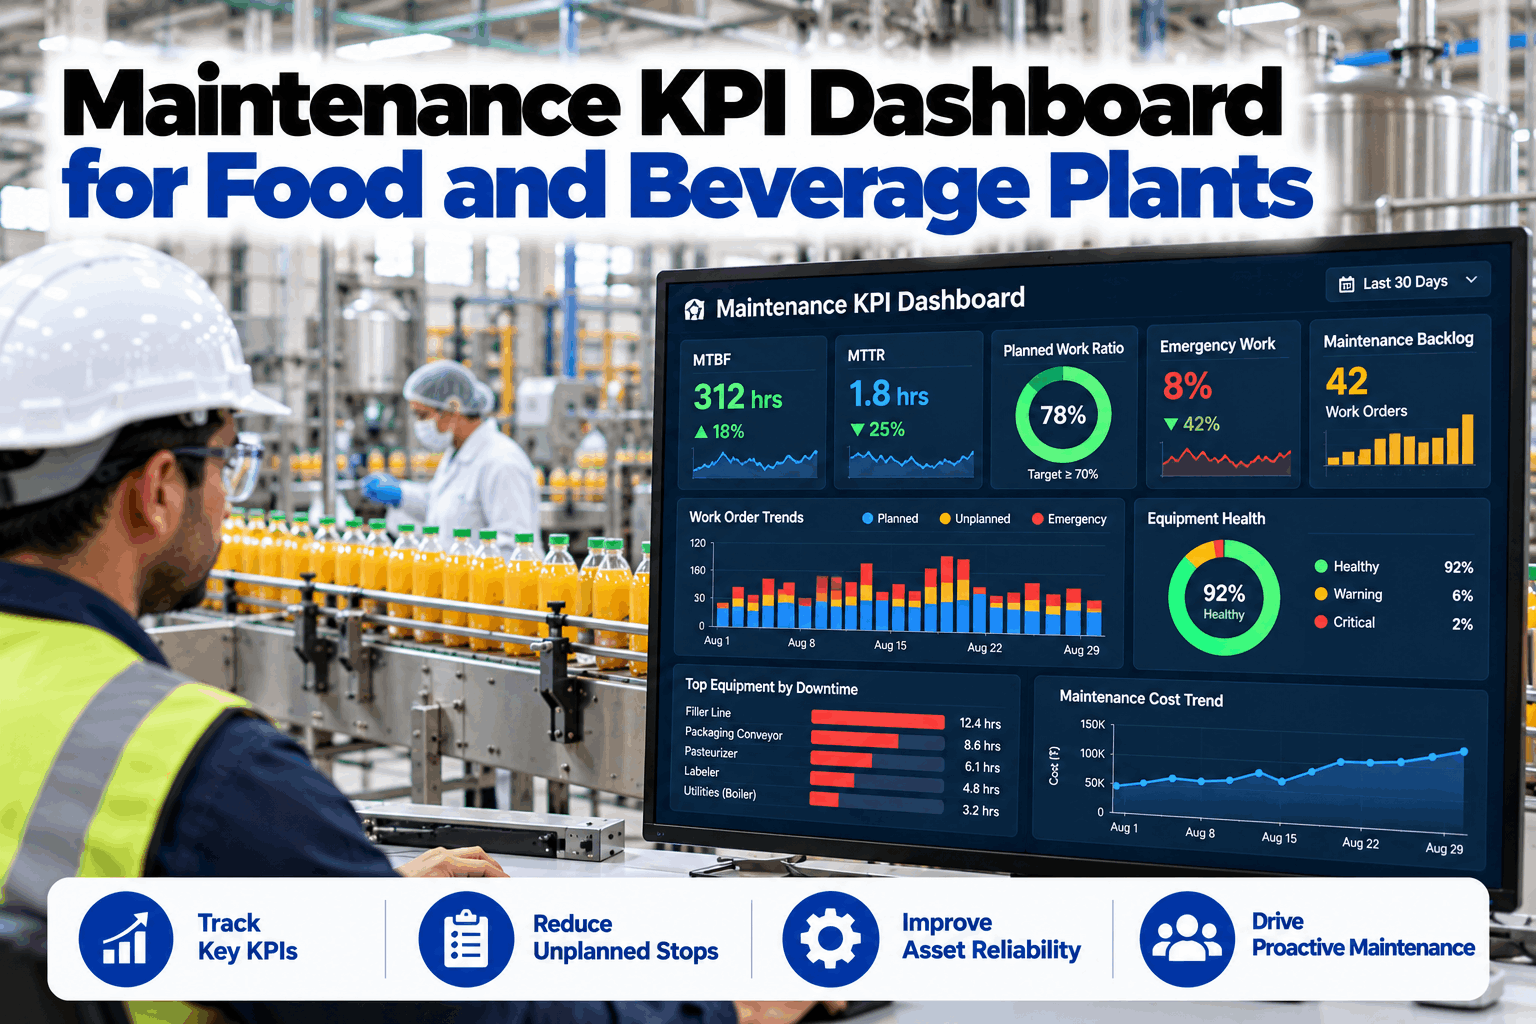
A useful KPI set mixes results with the habits that drive them. Reliability results such as MTBF tell you what happened. Planning measures such as PM compliance tell you whether the work that prevents failures is being done. Food-specific measures capture the time lost to cleaning and food safety release, which generic CMMS reports usually miss. Ten KPIs across three layers is enough for most plants. Review your current list with our KPI support team.
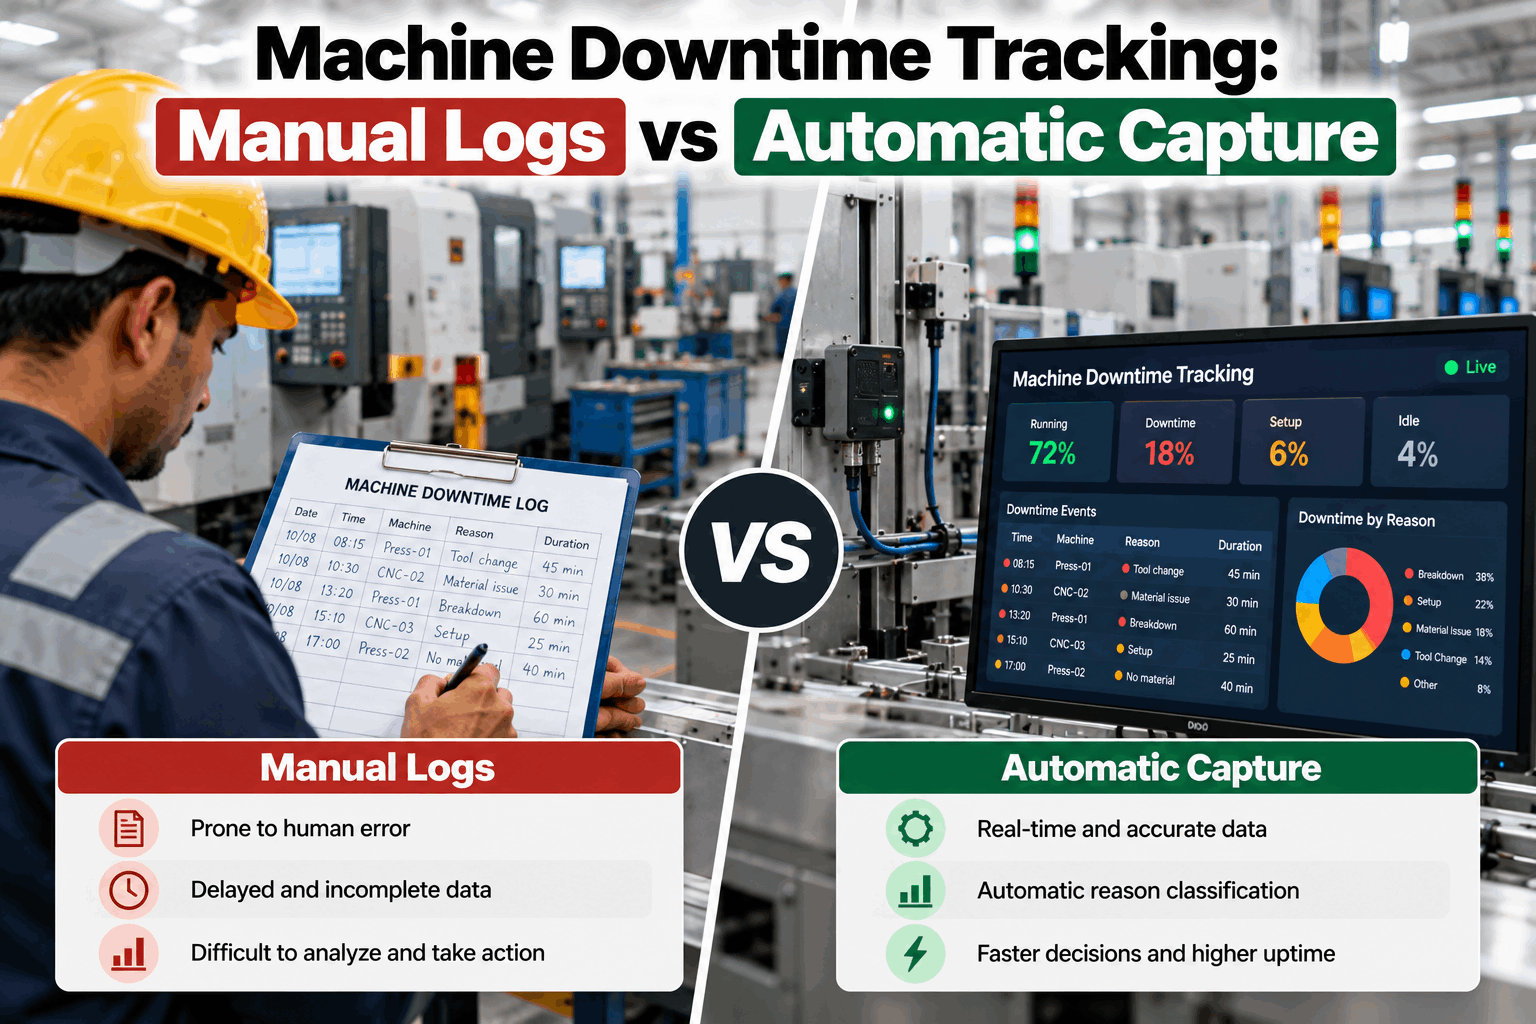
Every KPI on this list depends on how stops are coded. Split each stop into breakdown, planned maintenance, scheduled sanitation, extra sanitation and waiting for release. Without those codes, sanitation time hides inside breakdowns and release delays look like slow repairs, so the wrong team is asked to improve.
MTBF and MTTR, Worked Through for One Line
MTBF is operating time divided by the number of failures, for repairable equipment. MTTR is total repair time divided by the number of repairs. Both depend on clear rules: what counts as a failure, and when the repair clock starts and stops. In a food plant, decide up front whether cleaning and release after a repair sit inside MTTR or are tracked separately. Tracking them separately shows where the time really goes. Walk through your own line data in a KPI setup session.
Five Planning and Cost KPIs With Formulas
These five measures show whether maintenance is running to a plan or reacting to the day. SMRP publishes detailed definitions for most of them, and the important thing is to choose one definition and keep it. The examples below use assumed numbers so the arithmetic can be checked. Replace them with your own CMMS figures. Ask our support team for a formula sheet.
PM compliance depends on what "on time" means. Pick a window, such as a set share of the PM interval, write it into the KPI definition and do not change it to make a bad month look better.
The Two KPIs Only a Food Plant Needs
In a food plant a repair is not finished when the fitter walks away. ISO/TS 22002-1, the prerequisite programme behind FSSC 22000, says the procedure for releasing maintained equipment back to production shall include clean up, sanitizing where specified, and pre-use inspection. BRCGS Food Safety requires maintenance work to be followed by a documented hygiene clearance. That release time is real downtime, and it belongs on the KPI board. See how release steps are timed in a release tracking demo.
KPIs You Can Ask For on the Floor
iFactory calculates every KPI from source records, so nobody builds the pack by hand. Ask by voice from the line or the office, hear the number with its trend, and open the events behind it when something looks wrong.
Why Release Time Should Be a Median, Not an Average
Release times are lopsided. Most repairs clear in under an hour, but one wait for a swab result or a missing QA sign-off can take hours. An average lets that one event hide the normal pattern, while a median shows the typical repair and the outliers are reviewed one by one. The five events below are an illustration. Ask our support team how to set this up on your lines.
One Board, Every Line, Same Formulas
A weekly board works when every cell uses the same definition and links to the records behind it. Shading against your own targets shows where to look first, without needing red and green. The board below is illustrative. Software should calculate each cell from work orders, downtime events and sanitation sign-offs, never from typed-in totals. See a live board in a dashboard walkthrough.
Five Steps to KPIs People Trust
Most KPI projects fail on data definitions, not dashboards. If downtime codes are vague or work orders are closed late, the numbers will be argued about rather than used. Work through these steps in order, and give each KPI a named owner. Our support team can help with the definitions.
A Simple Worksheet for the Value of Faster Release
The clearest value usually sits in release time, because every minute after a repair is a minute the line is stopped. The worksheet uses assumed inputs to show the arithmetic only. Put in your own repair counts and the contribution value your finance team uses for an hour of line time. Build your own version with our KPI specialists.
Habits That Make the Numbers Useful
The same KPI can drive good or bad behaviour depending on how it is used. The habits on the right keep the focus on fixing causes rather than tidying numbers. Discuss your current review routine with our support team.
- Formulas change when a new manager arrives
- Release time hidden inside MTTR
- Averages that one long event distorts
- Monthly pack built by hand in a spreadsheet
- Targets set before any baseline exists
- Written definitions, changed only by agreement
- Release time tracked as its own KPI
- Medians for skewed times, with outliers reviewed
- Every KPI calculated from source records
- Targets set from three months of baseline
KPI Engine, Voice Assistant and NVIDIA Server in One Package
iFactory delivers the KPI dashboard and voice query as a turnkey system. A pre-configured NVIDIA AI server ships racked and ready with the KPI engine and speech models pre-loaded, so queries are answered on site and plant data stays in the plant. You rack it, plug in power and Ethernet, and the AI is live. To scope it for your plant, request a turnkey quote.
- Pre-configured NVIDIA AI edge server, racked and ready
- Links to your CMMS, downtime and sanitation records
- Food-specific KPI library with written formulas
- Voice query on headsets, handhelds and desk
- Spoken answers with trend and read-back
- Weekly line boards and monthly plant packs
- 24×7 remote monitoring of models and hardware
Server installed, data sources linked, KPI definitions agreed with owners.
Three months recalculated, results checked against your current reports.
Boards and voice query switched on, managers and planners trained.
KPIs Built for How Food Plants Work
iFactory treats cleaning and release as part of maintenance, so the numbers match what the line actually experiences. Our support team can walk you through a pilot plan.
What Plant Managers Ask About Food Plant Maintenance KPIs
Stop Building the KPI Pack by Hand
Get food-specific maintenance KPIs calculated automatically and answered aloud with their trend, from the line or the office. The full system is delivered turnkey and goes live in 6 to 12 weeks.