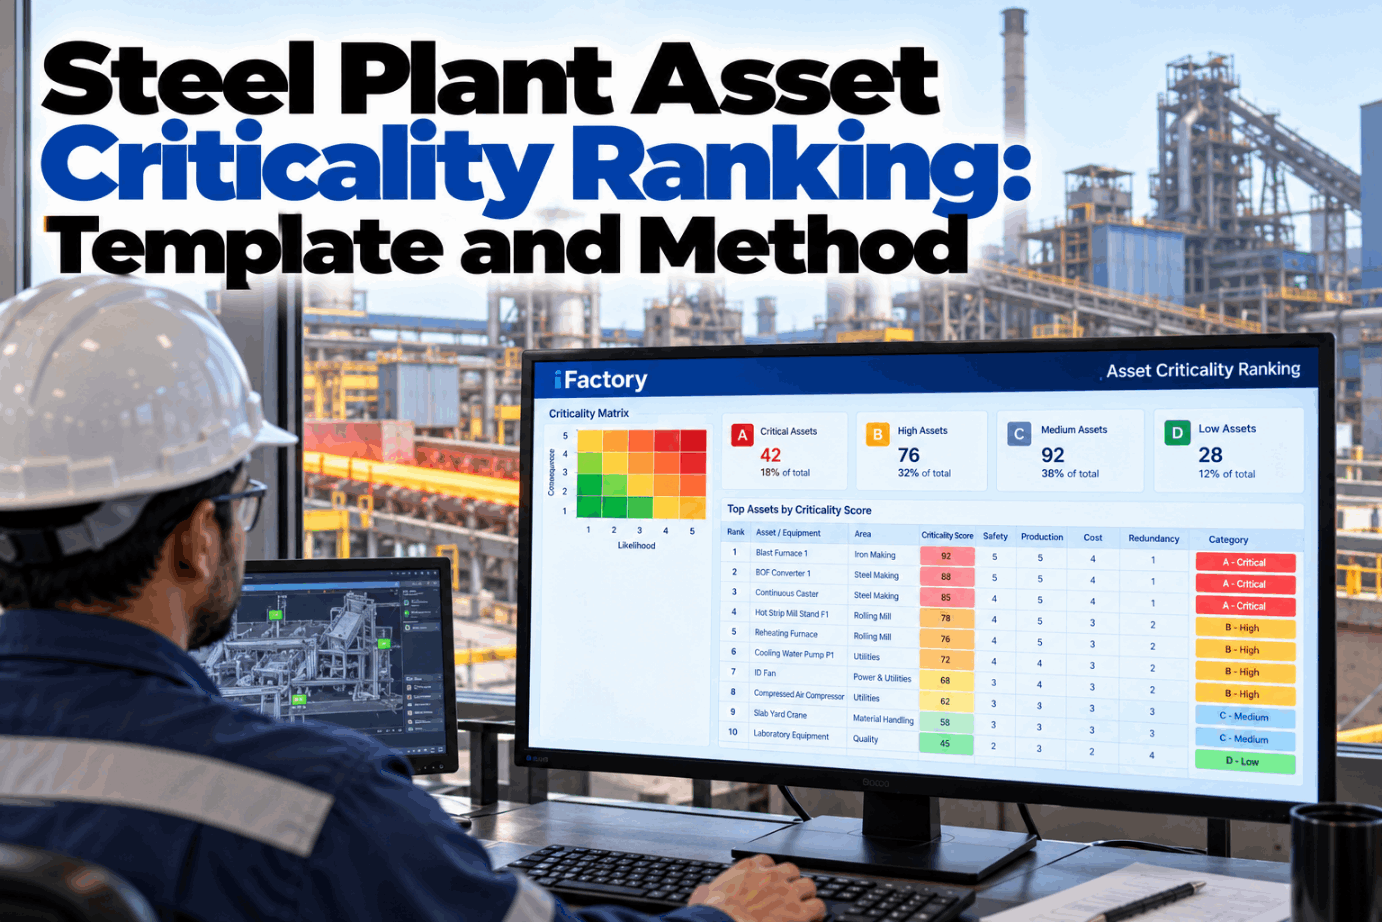
In a steel plant, a pump and a ladle crane hoist can both raise a work order on the same morning, and the planner has to decide which one gets the crew first. An asset criticality ranking makes that call before the morning comes. It scores every asset on what its failure would mean for people, production, cost and recovery, then turns the score into rules for work order priority, PM frequency and spares. This guide gives a steel-specific method, a worked example on five real asset types and a template you can copy. See scores recalculated on live plant data in a short criticality engine demo.
RELIABILITY · ASSET CRITICALITY
Know Which Steel Plant Assets Can Never Wait
The iFactory Criticality Engine scores every asset with weighted criteria and recalculates each score from failure history and production dependency. The scores then set work order priority, PM frequency and spares stocking automatically.
Criticality ranking · Melt shop to HSMLive
Criticality index 20 to 100 · recalculated nightly
1EAF transformer94A
2Ladle crane hoist84A
3Caster segment 566B
4Descaling pump 248C
5Cooling tower fan 334C
ASSET CRITICALITY RANKING STEEL PLANT
Why a Generic Score Sheet Falls Short in a Steel Plant
Most criticality templates were written for plants where the worst failure is a stopped line. A steel plant adds molten metal, heavy loads moving over people, single-path process routes and spares that take months to arrive. A score sheet that ignores these will rank a noisy conveyor above a furnace transformer. Talk them through with our reliability support team.
Generic sheet assumesSafety means slips, trips and guarding
Steel plant realityMolten metal, ladles over walkways and steam explosions if water meets liquid steel
Generic sheet assumesMost lines have a twin or a buffer
Steel plant realityThe furnace, caster and hot strip mill are often one route with no bypass
Generic sheet assumesParts arrive in days
Steel plant realityLarge transformers, gearboxes and motors can take months or longer
Generic sheet assumesFailures give plenty of warning
Steel plant realitySome failure modes, such as a brake or winding fault, can give little warning without monitoring
CRITICALITY ANALYSIS TEMPLATE
Five Criteria and the Weights Behind Them
Score each asset 1 to 5 on five criteria, multiply each score by its weight and add them up. Multiply the total by 20 to get a criticality index from 20 to 100. The weights below are an example for an integrated or mini mill. Leadership should agree them before scoring starts and keep them fixed for the cycle. Agree your own weights in a scoring workshop.
Safety30%
Production30%
Cost10%
Redundancy15%
Lead time15%
Safety and environment
1 No credible injury3 Lost-time injury possible5 Molten metal release, falling load over people, fire or explosionProduction
1 No lost output3 One unit slowed or stopped for a shift5 Bottleneck stops, such as EAF, caster or hot strip millRepair cost
1 Small parts and hours of labour3 Major component, outside crew5 Full replacement of a large unitRedundancy
1 Installed standby that cuts in3 Partial backup or slower route5 No backup and no bypassSpares lead time and detectability
1 Shelf spare, failure develops slowly3 Weeks to source, some warning5 Months to source, little warning
PRODUCTION DEPENDENCY
Serial Assets vs Redundant Ones
What matters is whether the process has another way to keep going. Assets on the main melt-to-coil route with no bypass score high on production and redundancy. Assets with an installed standby score low, but only while that standby is healthy. NORSOK Z-008, a criticality standard written for oil and gas but usable in other industries, treats identifying this redundancy as a core step. Map your process route with our support engineers.
EAFSingle path
→
Ladle furnaceOften single
→
CasterSingle path
→
Reheat furnaceVaries by plant
→
Hot strip millSingle path
Descaling pumpsDuty plus installed standby
Cooling tower cellsSeveral cells share the load
Hydraulic pump setsOften duty and standby
Overhead cranesBackup crane in some bays only
SPARES LEAD TIME AND DETECTABILITY
The Parts You Cannot Buy in a Hurry
When a large unit fails with no spare, the repair time is the supplier's lead time. For context, Wood Mackenzie put lead times for large power transformers at about 128 weeks in Q2 2025. Furnace transformers are specialist units, so take your own figures from current supplier quotes. The ladder below shows a typical order from shortest to longest, not real durations. Review your long-lead list in a spares risk session.
Pump cartridge or seal kitUsually stocked
Crane brake and wheel setsWeeks
Caster segment rebuildShop cycle
Large mill drive motorMonths
Main mill gearboxMonths
EAF transformerOften longest
Detectability lowers the score
An asset with vibration, oil or thermal monitoring that gives weeks of warning can score lower on this criterion than an identical unit run blind, because the warning buys time to source parts.
Scores That Follow Your Failure History
The Criticality Engine applies your weights to every asset, then recalculates from work order history and production dependency. Each class change flows into WO priority, PM frequency and spares stocking once a person approves it.
Reliability engineer and iFactory
EngineerWhy is caster segment 5 flagged for class A?
iFactoryTwo spare segments went out for rebuild, so only one is left in the pool. Redundancy moved from 2 to 4 and the index from 66 to 72.
EngineerWhat changes if I approve it?
iFactoryIts work orders go to P1, the bearing check interval halves and the segment rebuild order is flagged urgent.
ASSET CRITICALITY RANKING STEEL PLANT EXAMPLES
Five Steel Assets Scored Step by Step
Here is the method applied to five common assets with the example weights: safety 30%, production 30%, cost 10%, redundancy 15%, lead time 15%. Classes are A at 70 or above, B from 50 to 69 and C below 50. The scores are illustrations, not plant data. Check your scoring with our reliability team.
Caster segment sits in BThe caster is a bottleneck, but a pool of rebuilt spare segments keeps redundancy and lead time low.
Descaling pump sits in CThe installed standby keeps it low, so the PM that matters is proving the standby works.
Ladle hoist is A twiceIt scores 84, and a safety score of 5 would make it A on its own.
OVERRIDE RULES
When One Score Beats the Total
Weighted totals can hide an unacceptable consequence behind low scores elsewhere. So every asset passes three gates before its total decides the class. For cranes that carry molten metal, OSHA 1910.179 already requires at least two holding brakes on each hoisting unit, which tells you how regulators view that failure. Set your gates in a method review call.
Gate 1Could failure release molten metal or let a load fall over people?
Yes: Class A, whatever the total
Gate 2Single-path asset with a spare lead time longer than your planning horizon?
Yes: Class B at least, plus spare review
Gate 3Covered by a legal inspection regime, such as lifting or pressure equipment?
Yes: legal intervals kept, whatever the class
OtherwiseNo gate triggered
The weighted index sets the class
RISK BASED MAINTENANCE
How the Score Drives Work Orders, PM and Spares
The class sets three things: how fast a work order is answered, how often and how deeply the asset is maintained and which spares sit on site. Failure history then fine-tunes PM frequency inside each class. NORSOK Z-008 also links consequence class to work order priority and spare parts decisions. Map these rules into your CMMS with our support team.
Work order priority
AP1, crew assigned this shift
BP2, within a day
CP3, planned into the schedule
PM frequency and depth
ACondition monitoring plus shortest OEM interval
BTime-based PM at OEM interval
CBasic checks, run to failure where safe
Spares stocking
AInsurance spare or a supply agreement
BWear parts on site, majors on known lead time
CBought when needed
ASSET CRITICALITY RANKING STEEL PLANT SOFTWARE
Scores That Recalculate When the Plant Changes
A criticality list made once is out of date within months. Spares pools shrink, standby units fail quietly and repeat breakdowns raise the odds. The Criticality Engine watches work orders, the asset register and spares levels, then recalculates and asks a person to approve any class change. Here is how one illustrative asset moved over seven weeks. See it on your own history in a live rescoring demo.
Week 1
Caster segment 5 at 66, class BThree rebuilt spare segments in the pool
Week 3
Two spares sent for rebuildPool down to one segment, rebuild due in four weeks
Week 4
Redundancy 2 to 4, index 66 to 720.90 + 1.50 + 0.30 + 0.60 + 0.30 = 3.60 × 20 = 72, class A proposed and approved
Week 7
Rebuilt segments back in the poolRedundancy back to 2, index back to 66, class B
ASSET CRITICALITY RANKING STEEL PLANT TEMPLATE
One Scoring Sheet per Asset
Keep the score and the reason together, so anyone can see why an asset sits in its class. The sheet below is filled in for the ladle crane main hoist from the worked example. Ask our support team for a blank copy.
AssetLadle crane 2, main hoist
AreaMelt shop, caster bay
Scored byMaintenance, production, safety
Review dueQuarterly, or after any failure
Safety · 30%Molten metal load over walkways
Production · 30%Caster stops if no ladle can be moved
Cost · 10%Major hoist parts, outside crew
Redundancy · 15%Second ladle crane, limited reach
Lead time · 15%Gearbox and drum parts take months
Weighted sum4.20
Index84
OverrideGate 1, safety
Class and rulesA · P1 · monthly brake checks · spare brake set
ASSET CRITICALITY RANKING STEEL PLANT COST AND ROI
Is a Critical Spare Worth Holding?
The most expensive decisions a ranking drives are about insurance spares. A simple break-even test helps. The inputs below are assumed to show the arithmetic only, for a spare main mill gearbox. Replace each one with your own figures. Run the test on your long-lead list in a spares review.
Spare gearbox value$600,000, assumed
Yearly carrying rate20%, assumed
Cost to hold the spare600,000 × 0.20 = $120,000 a year
Lost margin per hour of mill stop$15,000, assumed
Break-even downtime avoided120,000 ÷ 15,000 = 8 hours a year
Stop without spare vs with spare26 weeks = 4,368 h vs 72 h, assumed
Break-even failure chance per year8 ÷ (4,368 − 72) = 8 ÷ 4,296 = 0.19%
Reading the result
If the chance of that gearbox failing in a year is above about 0.19%, holding the spare costs less than the expected downtime. Real plants often find a temporary repair or share a spare with a sister mill, so test those options too.
ASSET CRITICALITY RANKING STEEL PLANT FOR PLANT MANAGERS
Five Questions to Ask of Any Ranking
A plant manager does not need to check every score. These questions show quickly whether a ranking can be trusted. Our reliability team can help you answer them.
01Is class A small enough to mean something?If half the plant is A, nothing is.
02Did safety and production score together?One department alone skews the result.
03Are long-lead spares on the list?Transformers, gearboxes and large motors first.
04Do standby units get proven?Low scores assume the standby works.
05When was it last recalculated?Spares pools and failure history change monthly.
TURNKEY AI DEPLOYMENT
The Criticality Engine, Ready on Day One
iFactory ships as a turnkey package. A pre-configured NVIDIA AI server ships racked and ready with the Criticality Engine pre-loaded, plus connectors for your CMMS, asset register and stores data. You rack it, plug in power and Ethernet, and the AI is live. Your plant data stays on site. To scope it for your plant, book a turnkey scoping call.
What's Included
- Pre-configured NVIDIA AI server, racked and ready
- Criticality Engine with steel plant criteria and weights
- Override gates for safety and single-path assets
- Connectors for CMMS, asset register and stores
- Class rules for WO priority, PM frequency and spares
- Recalculation from failure history and spares levels
- 24×7 remote monitoring of models and hardware
Live in 6–12 weeks
Wk 1–4
Connect and Agree
Server installed, asset register linked, weights and gates agreed.
Wk 5–8
Score the Route
Melt shop, caster and mill assets scored in workshops and checked.
Wk 9–12
Drive the Work
Classes set WO priority, PM and spares, and recalculation switches on.
HOW iFACTORY FITS
Criticality Built for Heavy Industry
iFactory scores steel assets on the criteria that matter in a melt shop and a mill, then keeps those scores honest. Our support team can show how it fits your CMMS.
1
Weighted scoring per asset. Safety, production, cost, redundancy and lead time scored on your anchors and weights.
2
Recalculated from history. Failure history and production dependency move scores, with a person approving each class change.
3
Drives the work automatically. Class sets WO priority, PM frequency and spares stocking in the CMMS.
4
Evidence for every score. Each asset keeps its scores, reasons and change history in one record.
1000+
Industrial clients running iFactory
99.9%
Platform uptime for continuous steel operations
6-12 wks
From racked server to live criticality scores
FREQUENTLY ASKED QUESTIONS
What Plant Managers Ask About Steel Asset Criticality
What is an asset criticality ranking in a steel plant?
It is a scored list of every asset, ranked by what its failure would mean for safety, production, cost, redundancy and spares lead time. The ranking puts assets into classes, and each class sets work order priority, PM frequency and spares stocking.
Which steel plant assets usually rank highest?
Assets that can release molten metal or let loads fall over people, such as ladle crane hoists, and single-path assets with long-lead spares, such as furnace transformers and main mill drives. Your own scores decide, but these are the usual top of the list.
How does redundancy change a score?
An installed standby that cuts in automatically lowers both production impact and redundancy scores. The low score is only valid while the standby works, so class C assets with standbys still need regular changeover tests.
Should likelihood be part of criticality?
In this method the class comes from consequence, and failure history then sets PM frequency inside each class. Some plants multiply by likelihood instead. Either works if it is written down and applied the same way to every asset.
How often should we recalculate?
After any significant failure, a process change or a change in spares, and at least once a year for the full list. Software can recalculate continuously from work orders and stores data and flag class changes for approval.
Where should we start?
Start with the main route from melt shop to hot strip mill. Agree weights and gates, score those assets in short workshops with maintenance, production and safety, then connect the classes to your CMMS. Our
support team can help plan the first workshop.
Put Your Crews Where Failure Costs Most
Score every steel plant asset on safety, production, cost, redundancy and lead time, keep the scores current from failure history and let each class drive work orders, PM and spares. Delivered turnkey and live in 6 to 12 weeks.
Criticality summary · example steel plant
CriteriaSafety, production, cost, redundancy, lead time
Override gatesMolten metal, single path, legal
Class drivesWO priority, PM, spares
RecalculationFrom failure and spares data
Every class change approved and logged