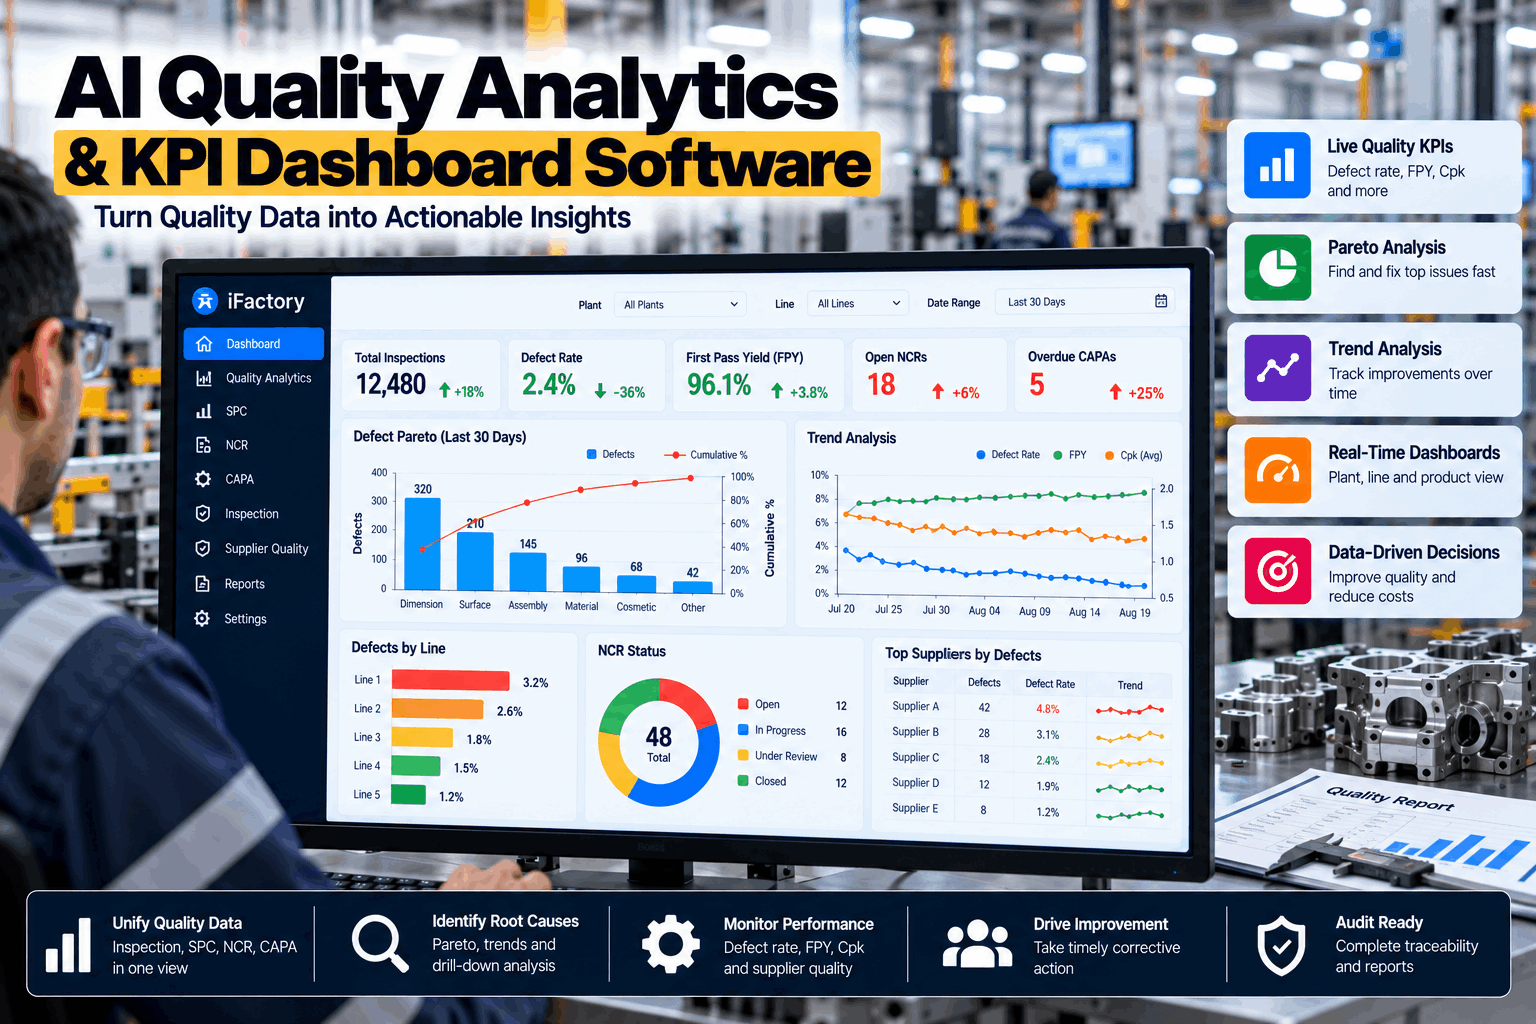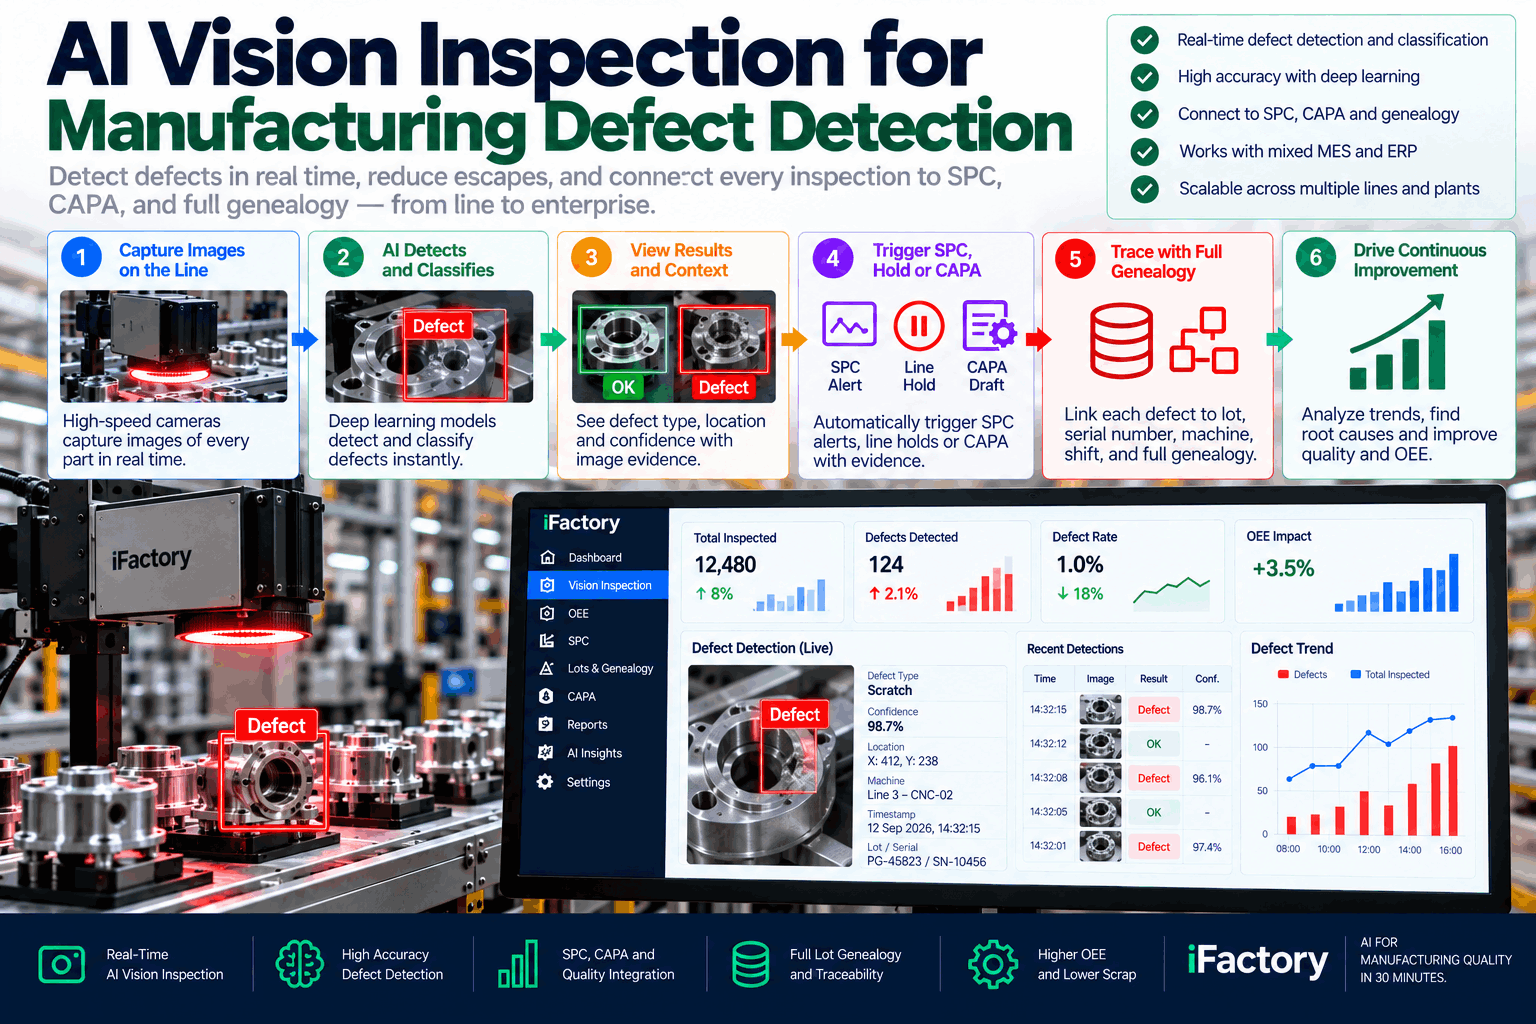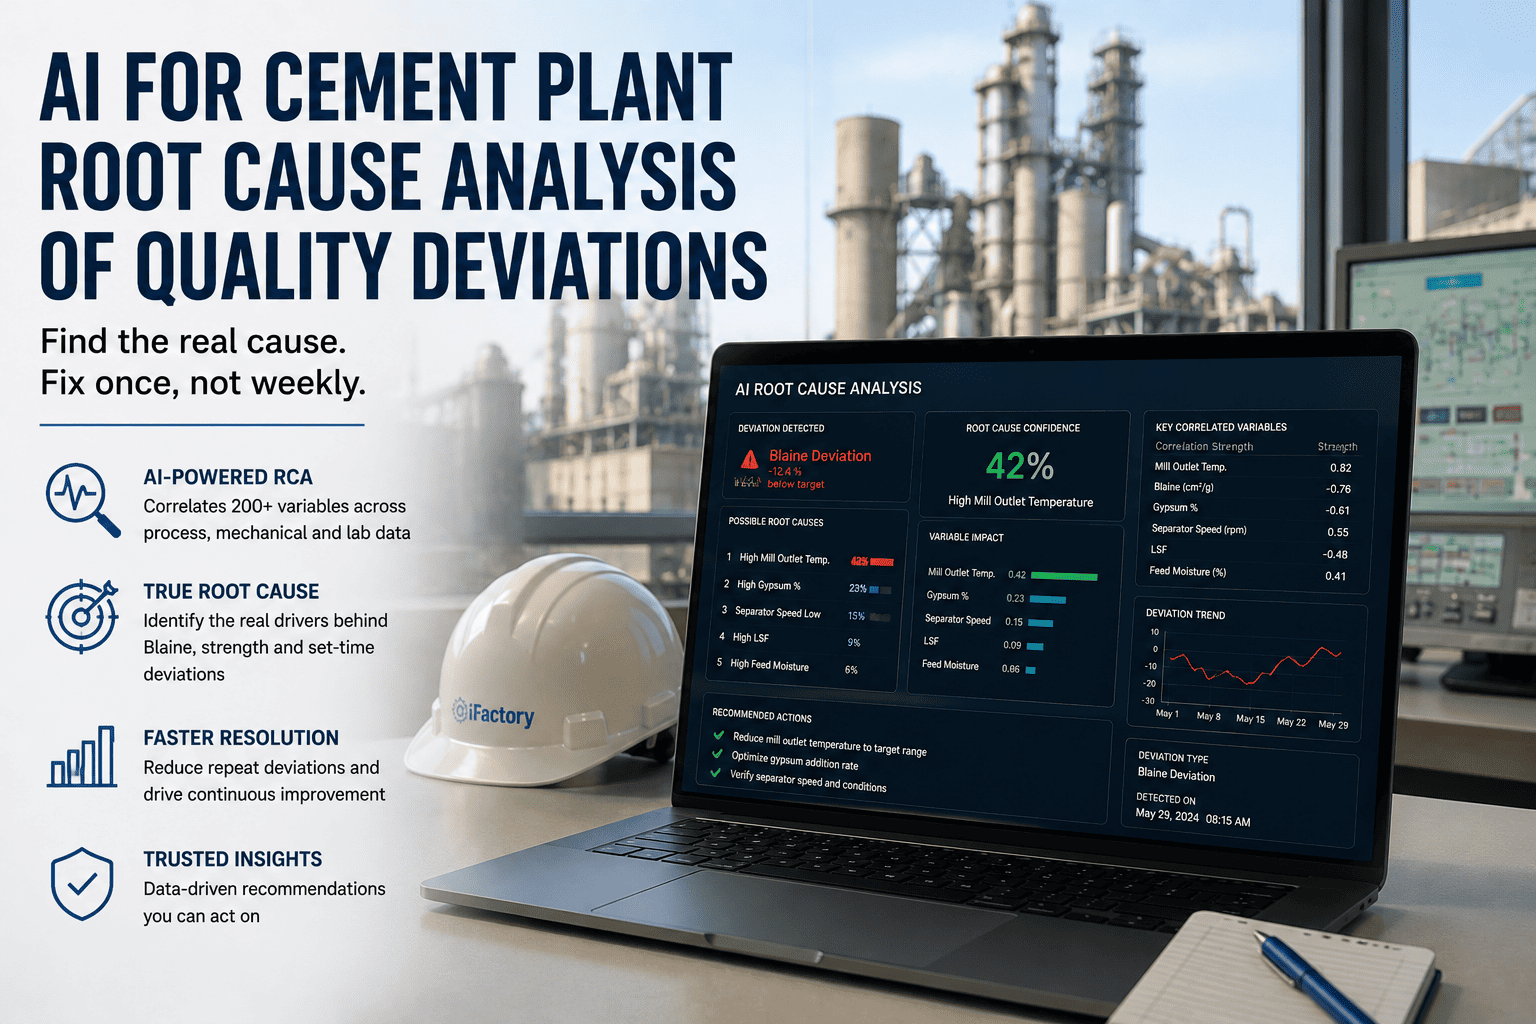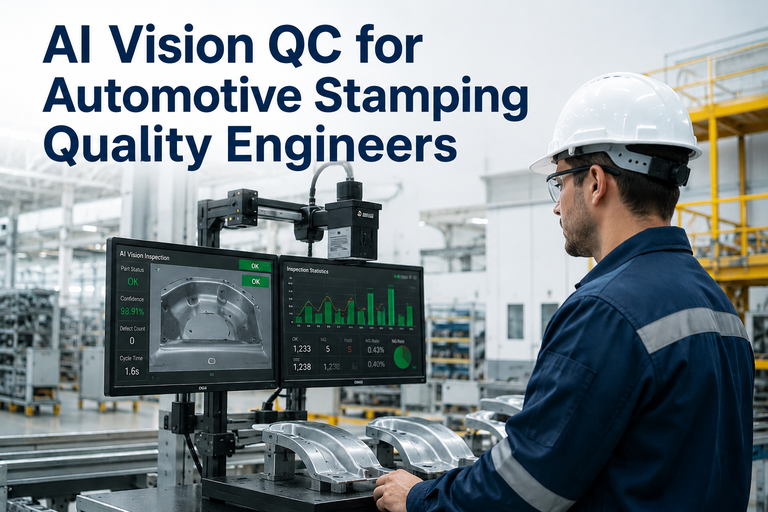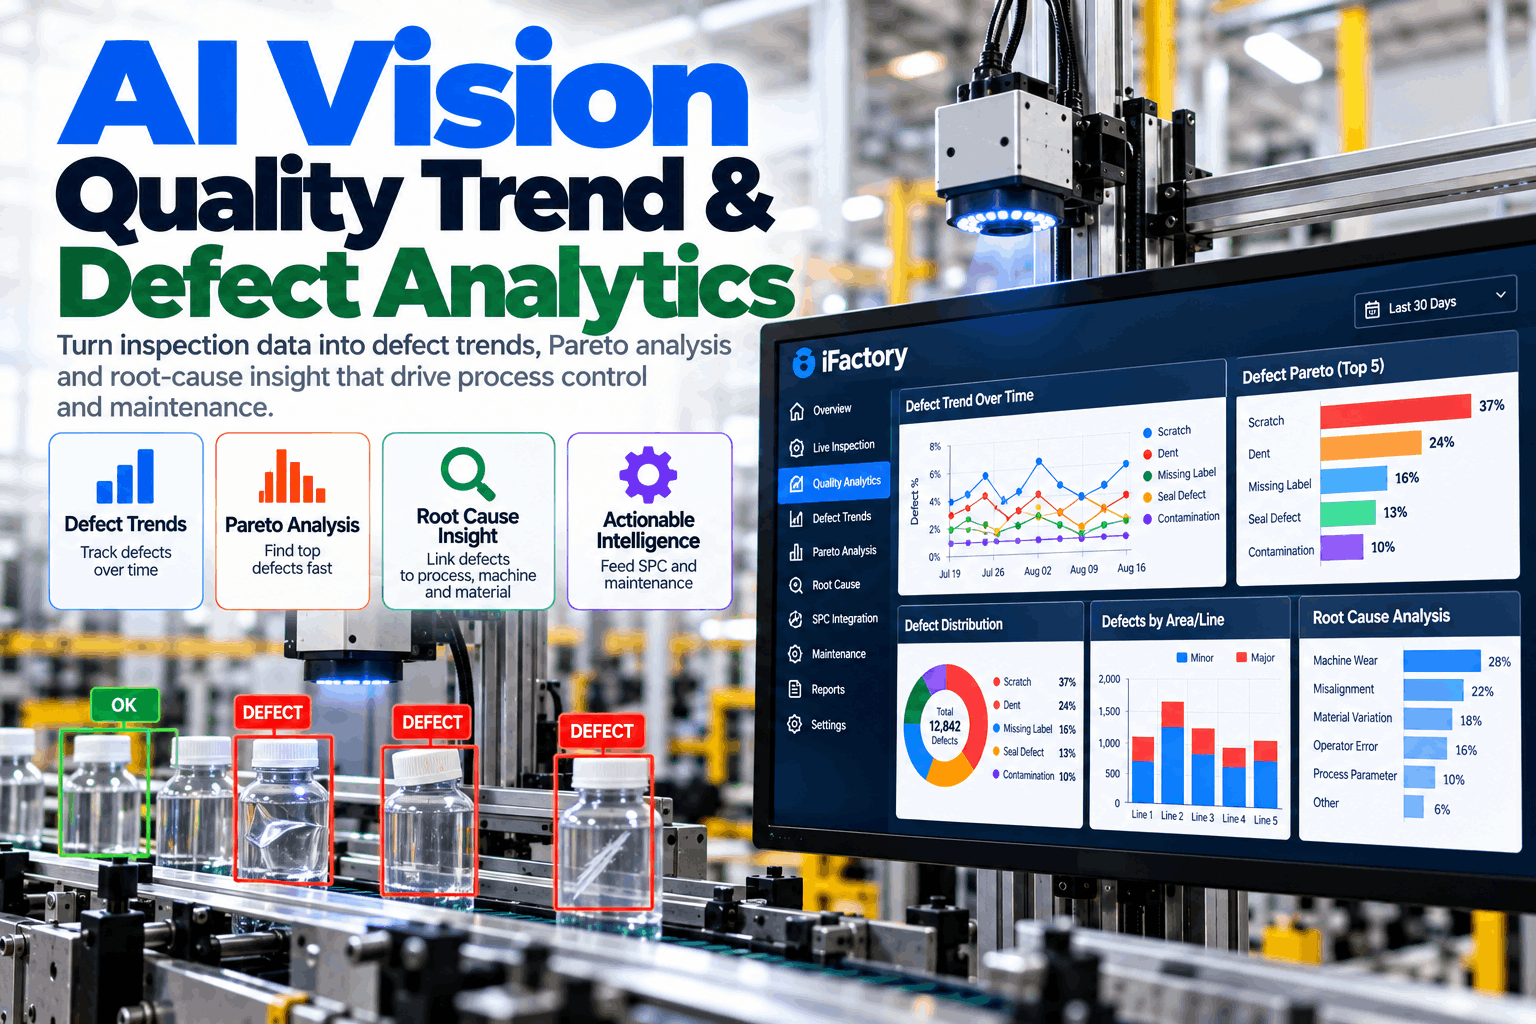
A vision system can check every part and still leave the plant no wiser. Rejects pile up in a database, and the weekly meeting still argues over which defect matters most. The value is in what that data shows over time: which defects are growing, where on the part they appear, which machine or shift they follow, and what they cost. Vision process analytics turns inspection results into Pareto charts, trends and root-cause leads that reach process control and maintenance. To see it on your own inspection data, book an analytics walkthrough.
AI Vision Quality Trend and Defect Analytics
Every image your vision system inspects becomes a data point: defect type, location, time, line, shift and machine. Analytics turns those points into the trends and causes your process and maintenance teams can act on.
- How to rank defects by count and by cost
- Which control chart fits vision reject data
- How defect patterns lead to process and maintenance fixes
The top three defect types cover three quarters of all rejects. The line under misalignment marks where the cumulative share passes 80%, a common place to focus first. But count is only one way to rank, as the cost view further down shows.
From Pass and Fail to Insight
Inspection stops bad parts. Analytics stops the next ones.
A vision system on its own answers one question per part: good or bad. The questions that cut scrap are different. Which defect is growing? Where does it start? What changed just before? Those answers sit in the inspection data already, if each finding is stored with enough context to group, trend and compare. Our quality analytics team can help you see what your current data can already answer.
What fails most
Pareto of defect types by line, product and period.
What is changing
Reject and defect rates on control charts, with rule checks.
Where on the part
Defect positions mapped onto the part to show clusters.
What caused it
Defects lined up with machines, shifts, lots and events.
A defect logged as "scratch" tells you little. A scratch logged with its position on the part, the camera, the time and the machine that last touched the part tells you where to look. Decide what to store before the data starts piling up.
Getting the Data Right First
Good analytics starts with clean, consistent findings.
Before any chart is drawn, the inspection data has to be trustworthy. Defect names must mean the same thing on every line, every finding needs a reliable time and part ID, and the system has to record when it was not inspecting at all. Small gaps here turn into big arguments later, when a trend is questioned and nobody can prove which data it was built on.
One defect list
The same names and definitions on every line and camera, agreed with quality.
Part and time IDs
Each finding tied to a part, a time and a station, so it can be traced.
Good parts too
Store the count of passed parts, or rates cannot be worked out.
Downtime marked
Record when the camera was off or bypassed, so gaps are not read as zero defects.
Each week, have someone check a small sample of AI-labelled defects and passed parts. It keeps the labels honest, catches drift in the model early, and gives the team confidence in the trends built on top.
Pareto by Count, by Cost and by Line
The defect that happens most is not always the one that costs most.
A Pareto by count is the usual starting point. But a frequent scratch that can be polished out may matter less than a rarer dent that scraps the part, or a misalignment that reaches the customer. Ranking by cost, and splitting by line, shift or product, often changes what the team works on first. To set up cost weights for your defects, book a Pareto set-up call.
A Pareto for a week with a long changeover is not the same as one for a steady week. Compare the same product, line and time window, and keep a rolling baseline so a real change stands out clearly from normal week-to-week noise on the line.
The Same Week, Ranked by Cost
Here are the same 1,240 rejects with a simple cost per defect: rework, scrap or customer return. The order changes, and so does where the team should start.
Trends: The Right Chart for Vision Data
Vision data is counts and proportions, so it needs attribute charts.
Vision systems mostly produce pass or fail results and defect counts, not measurements. That makes attribute control charts the natural fit. The choice depends on whether you count bad parts or count defects, and whether the number of parts per period changes, which it nearly always does on a real line. If you want help choosing charts, our engineers can help.
When a vision model is retrained or a threshold is changed, the reject rate can move even though the process did not. Record every model and threshold change as an event on the chart, so nobody chases a process shift that is really an inspection change.
Real process change
- Starts at a machine, lot or shift event
- Shows in one defect type or location
- Confirmed by looking at the parts
Inspection change
- Starts when a model or threshold changed
- Often shows across many defect types
- Parts look the same as before
Where on the Part, and Where in the Process
The location of a defect is often the fastest clue to its cause.
A scratch that always appears on the same edge points to a guide, a gripper or a conveyor transfer. Contamination clustered in one corner points to a spray pattern or a drip. Mapping every defect position onto the part, and comparing maps before and after an event, turns a vague trend into a short list of places to check. To map defects on your own parts, book a defect mapping session.
Scratches cluster along the right edge, the side that runs against the guide rail at station 4.
Feeding Process Control and Maintenance
Insight is only useful if it reaches the people who can act on it.
A defect trend should end in a change on the line: a machine adjusted, a part replaced, a recipe corrected or a supplier contacted. Linking analytics to process control and the maintenance system closes that loop, and the same analytics then shows whether the fix worked.
Inspect
Every part checked, findings stored with context.
Trend
Rates charted and rules checked by defect type.
Locate
Positions mapped, clusters found.
Link
Matched to machines, shifts, lots and events.
Act
Work order or process alert sent.
Verify
Defect rate checked after the fix.
To process control
- Alerts when a defect rate breaks a rule
- Links to recipes and settings in use
- Before and after views of every change
To maintenance
- Work orders with location and images
- Defect trends next to asset history
- Repeat problems ranked by cost
Each lead the analytics raises should end with a recorded outcome: fixed, not the cause, or still open. Over time, that record shows which defect patterns point to which causes, and makes the next investigation faster.
How iFactory Vision Process Analytics Works
Inspection results in, trends and causes out.
iFactory's Vision Process Analytics collects every finding from your vision systems with its type, position, time and line context. It builds Pareto charts by count and cost, runs attribute control charts with rule checks, maps defects onto the part, links patterns to machines, shifts, lots and events, and sends leads to process control and maintenance. Questions on fit go to our support desk.
Every finding
From iFactory vision or other inspection systems on the line.
Pareto and charts
By count, cost, line, shift and product.
Root-cause leads
Patterns linked to events, with evidence shown.
Alerts and work orders
Sent to process control and maintenance.
What line teams see
- Today's top defects and how they compare
- Alerts when a defect rate rises
- Defect maps for their own parts
What quality and engineering see
- Paretos by count, cost, line and product
- Control charts with events marked
- Root-cause leads and their outcomes
The gains depend on your lines, defect types and how quickly leads are acted on. We measure them on your own data during the pilot, rather than promising a general figure.
Turnkey AI: Delivered, Connected and Live in 6–12 Weeks
You do not build this. It arrives ready.
iFactory ships as a pre-configured NVIDIA AI server, racked and ready, with the software pre-loaded. Rack it, plug in power and Ethernet, and the AI is live on your network.
Our team handles cabling, network setup, PLC and SCADA integration, operator training and 24×7 remote monitoring. The server sits inside your own network, so images and quality data stay on site. For a scope matched to your lines, request a turnkey quote.
Ship, network and data
Server installed. Inspection results, MES context and maintenance system connected for the pilot line.
Analytics pilot
Paretos, charts and defect maps built. Leads checked with your quality and maintenance teams.
Go-live and training
Alerts and work orders switched on. Teams trained. 24×7 remote monitoring begins.
Frequently Asked Questions
What is vision defect analytics?
It is the analysis of AI vision inspection results over time: which defects occur, how often, where on the part, and what they are linked to. It turns pass and fail results into trends and root-cause leads.
Can it use data from our existing vision systems?
Usually, yes, if the system can export each finding with its type and time. Position on the part and line context make the analysis much stronger.
Which control chart should we use for vision rejects?
Most often a p chart for the share of parts rejected, or a u chart for defects per unit, because the number of parts per period changes on a real line.
How do we avoid chasing false trends?
Record every model retraining and threshold change as an event. If the reject rate moves at the same time, check the inspection before the process.
Why rank defects by cost as well as count?
Because a frequent defect that is cheap to rework may matter less than a rare one that scraps the part or reaches the customer. Cost ranking points the team to the biggest savings.
Does it send work to maintenance?
Yes. When a defect pattern points to a machine, a work order can be raised with the trend, location map and images attached.
How do we start?
With one line that already has vision inspection and a defect problem worth solving. A 6-week pilot connects the data, builds the Paretos and trends, and checks the leads with your team. To plan it, contact our team.
Make Every Inspection Count Twice
In thirty minutes we look at the inspection data you already collect, the defects that cost you most, and how findings reach your process and maintenance teams. You keep the notes whether or not you go further with iFactory.
- 1An export of a few weeks of inspection results
- 2Your defect types and how you name them
- 3A rough cost for each defect type
- 4Recent maintenance and process change logs
- 5The quality questions you cannot answer today