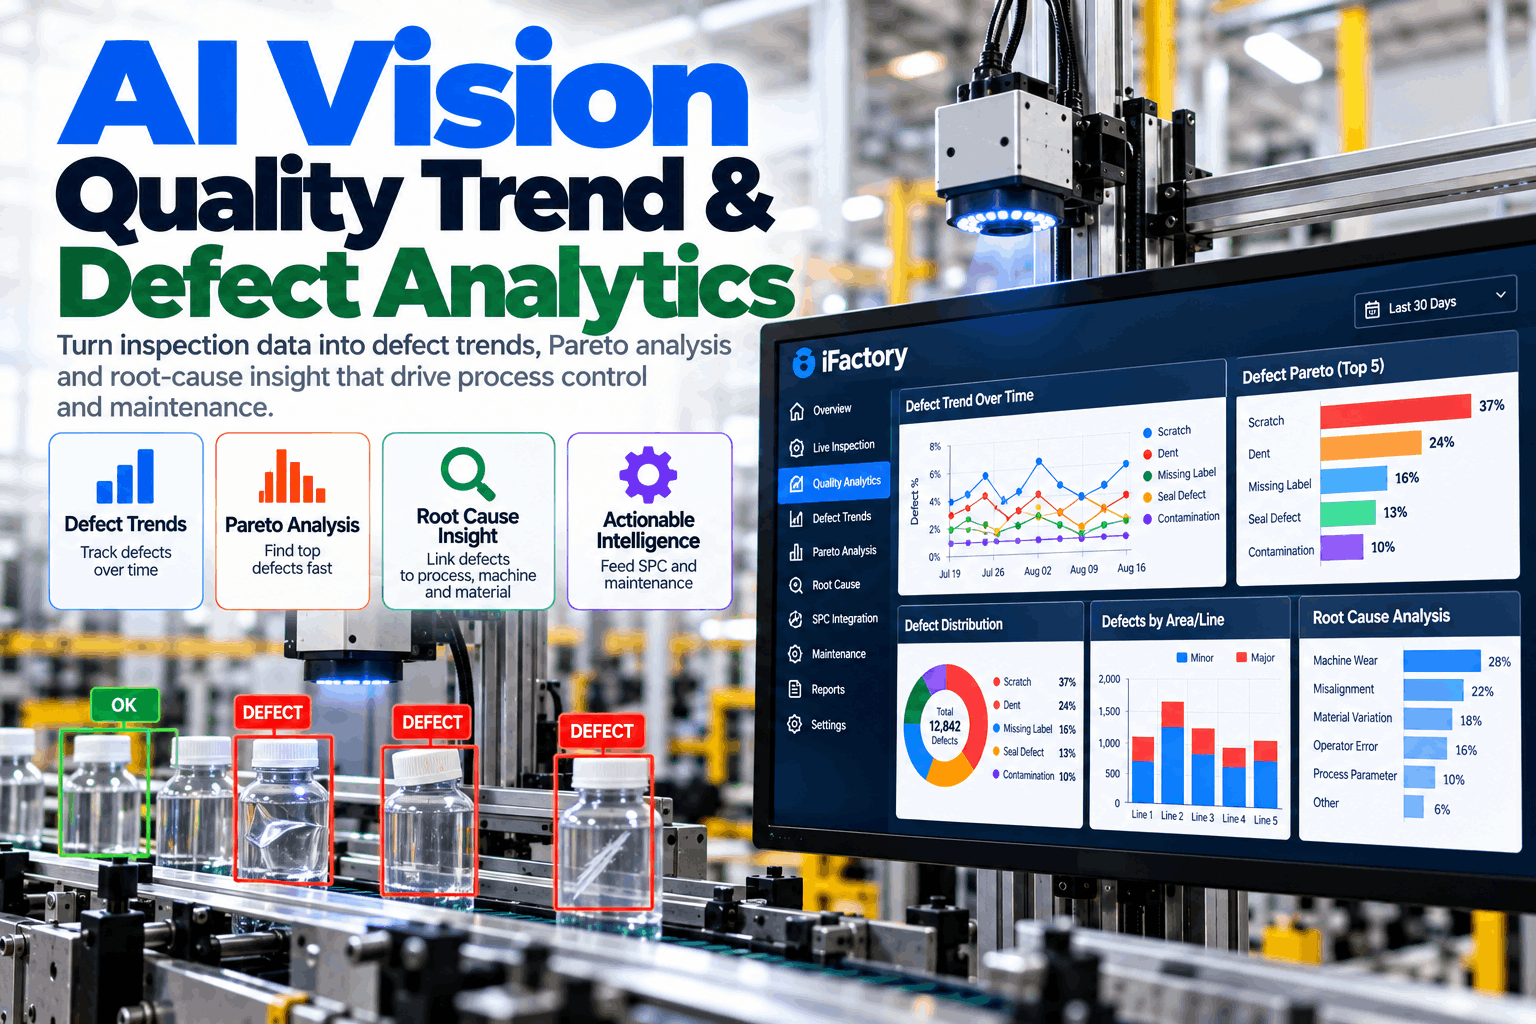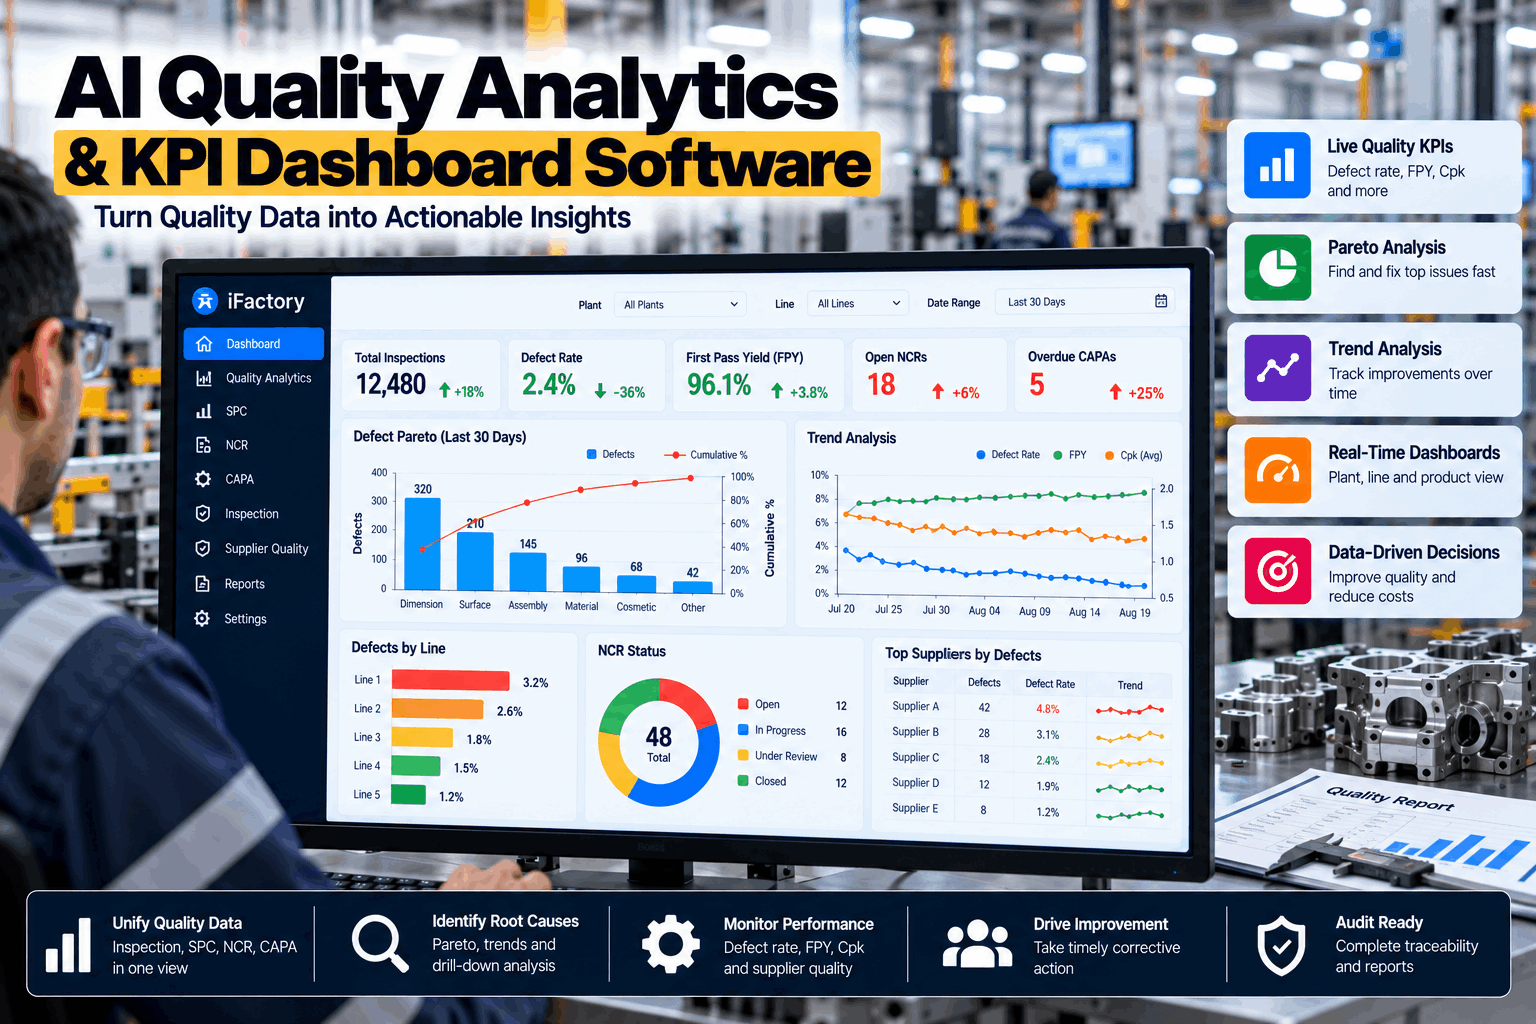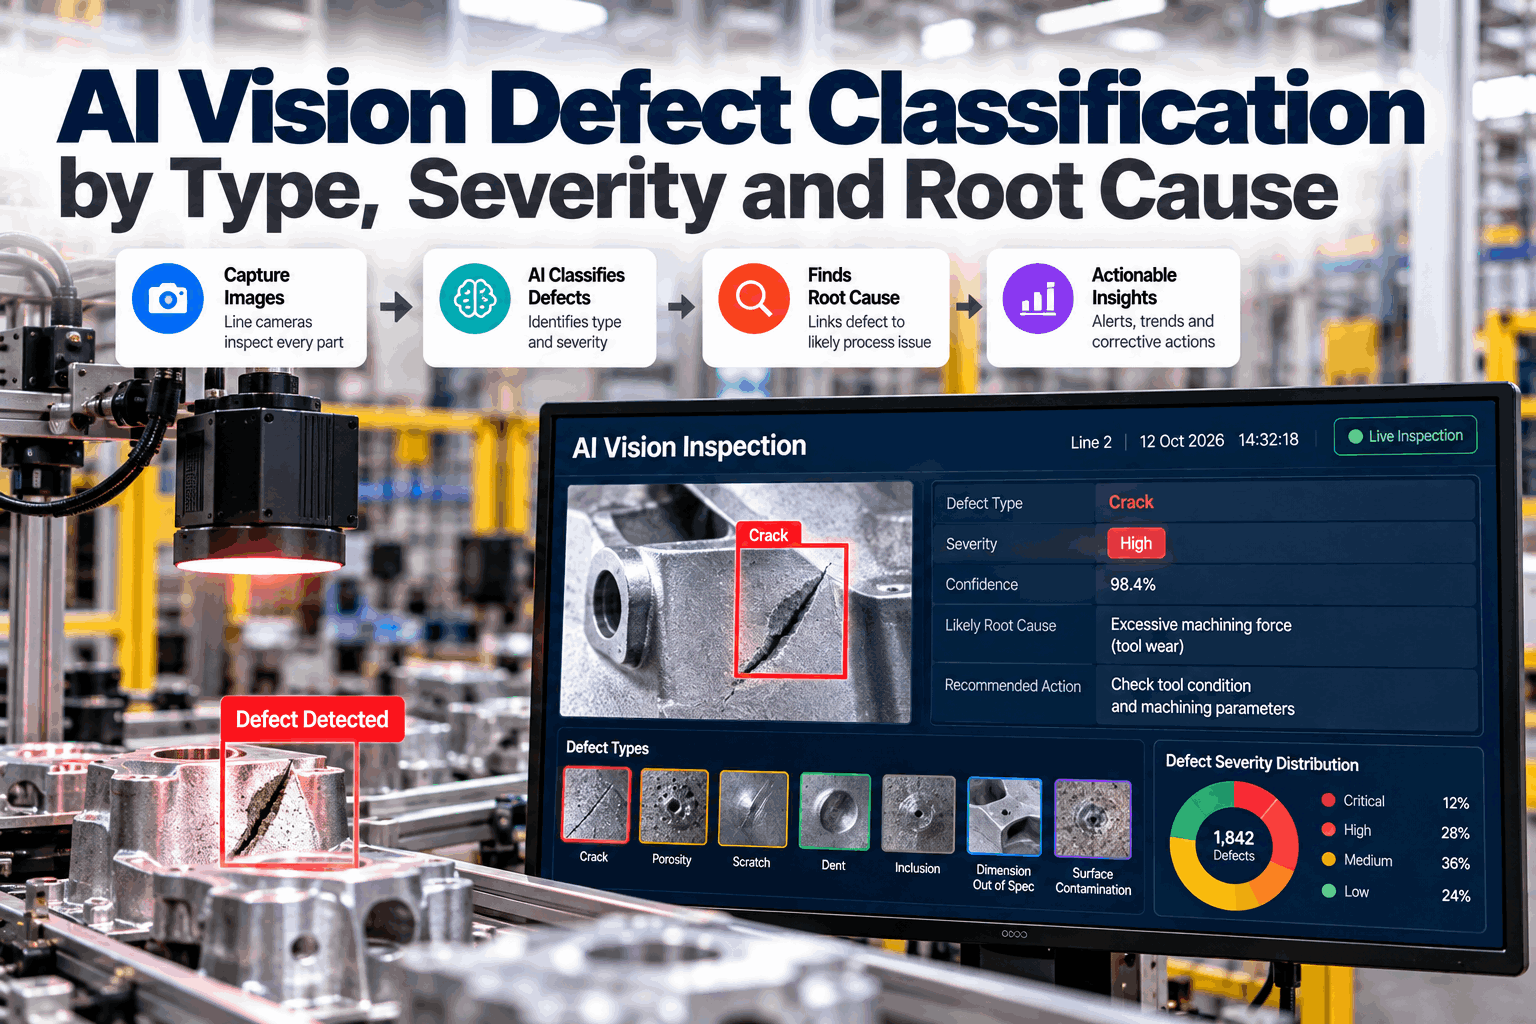
A vision system that only says pass or fail tells you something is wrong, but not what, how bad or why. Rejects pile up, an engineer sorts them by hand at shift end, and by the time anyone traces the cause, thousands more are made the same way. AI vision defect classification names each defect type, grades its severity against your rules and links it to the likely root cause in the process. This guide covers the three layers, the data they need and how to measure them. Start with a defect data review.
AI Vision Defect Classification by Type, Severity and Root Cause
Every defect image answers three questions: what is it, how serious is it and what caused it. AI vision does all three in real time, so quality teams act on causes instead of sorting rejects.
- The three layers: type, severity and root cause
- Data, labels and metrics each layer needs
- Use cases across metal, plastics, textiles and electronics
Why Pass or Fail Is Not Enough
A reject bin full of unnamed defects is a lost lesson.
Basic inspection catches bad parts but throws away most of what the image could tell you. Without a defect type, you cannot trend scratches separately from dents. Without a severity, a cosmetic mark and a functional crack get the same treatment. Without a link to the process, the same defect keeps coming back. Classification turns inspection from a filter into a source of process knowledge. Our quality engineers can show what your current system misses.
No trend by type
All defects counted as one number hides the real problem.
Over-rejection
Minor cosmetic marks scrapped alongside serious faults.
Slow sorting
Engineers classify rejects by hand hours later.
Causes found late
The process keeps making the same defect while people investigate.
Layer 1: Defect Type
Name every defect the same way, every time.
The first layer assigns each defect to a class from your defect library, such as scratch, dent, crack, short shot, flash, stain or misprint. Modern vision models do this by learning from labelled examples of each class, often combined with detection or segmentation so the system also knows where the defect is and how big it is. The quality of this layer depends far more on a clear defect library and consistent labels than on the model itself. Review your defect library with our vision team.
What is it?
One label per defect from your agreed library.
Where is it?
Bounding box or outline on the part, mapped to a zone.
How big is it?
Length, area or depth in real units from a calibrated camera.
For each defect type, write a one-line definition, show two or three good examples and one or two lookalikes that belong to a different class. When labellers disagree, the model learns the disagreement. A clear library is the cheapest accuracy gain available.
Layer 2: Defect Severity
Severity is a rule you own, applied by the system.
Severity should not be guessed by the model. It should come from your own acceptance rules, applied to what the vision system measured: defect type, size, location and count. Sampling standards such as ISO 2859-1 group nonconformities into classes by seriousness, and many plants use critical, major and minor grades. The vision system applies the same rule to every part, every shift. Agree severity rules with our quality team.
The same scratch can be minor on a hidden face and major on a visible or sealing face. Divide the part into zones once, and let the severity rule use the zone the defect falls in. This is usually the step that cuts over-rejection the most.
Layer 3: Root Cause
Link the defect to what the process was doing when it was made.
Root cause classification joins the defect record with process and context data: machine, tool or cavity, material lot, shift and the process values at the moment the part was made. The AI looks for patterns, such as short shots rising on one cavity whenever melt temperature falls, and suggests the most likely cause with its evidence. It does not replace a quality engineer's investigation, but it points them to the right place in minutes instead of days. Map your process data in a data mapping session.
Root cause needs to know which machine, cavity and moment made each part. If parts carry an ID or can be matched to a time stamp on the line, the link is simple. If several cavities or lanes merge before the camera, add a marker or sensor to keep them apart, otherwise the cause will be spread across all of them.
Defect
Type, severity, zone and time.
Context
Machine, tool, cavity, lot and shift.
Process
Temperatures, pressures, speeds at that time.
Pattern
What changes when this defect rises.
Suggestion
Likely cause, evidence and confidence.
Turn Rejects into Process Knowledge
Every defect named, graded and linked to the process, so your team fixes causes while the shift is still running.
Data Each Layer Needs
Images for type, rules for severity, process data for cause.
Each layer has its own data needs. Most plants already have the rules and process data. The labelled images are usually the main piece of work in a pilot. Ask our data team what your existing images can support.
What you need
- Labelled images for every defect type, plus good parts
- A written defect library and part zone map
- Severity rules from your quality standards
- Process data and part traceability by time or ID
Common gaps
- Rare defects with only a handful of images
- Labels that differ between inspectors
- Severity rules held in people's heads
- No link between a part and its process values
Critical defects are often the rarest, so they have the fewest images. Collect every example you can, keep rejected parts for re-imaging, and let the system flag unknown or low-confidence defects for human review rather than forcing them into the nearest class.
Measuring Classification Quality
One accuracy number hides the classes that matter most.
If 95 percent of parts are good, a system that calls everything good is 95 percent accurate and useless. Measure each defect class separately. Recall shows how many real defects of a type were caught. Precision shows how many parts labelled with that type really had it. For critical defects, recall matters most, because a missed defect can reach the customer. Set up your test set in a validation workshop.
Illustrative test results. Recall equals correctly classified divided by test images for that class. Your own test set, held back from training, gives the real figures.
Use Cases Across Manufacturing
The same three layers, different defects.
Defect classification works wherever defects are visible and the process leaves data behind. These are common starting points. Discuss your parts with our application engineers.
Injection moulding
Short shots, flash, sink marks and burns linked to cavity, melt temperature and pressure.
Stamping and casting
Cracks, splits, porosity and dents linked to die wear, lubrication and pour data.
Weaving and finishing
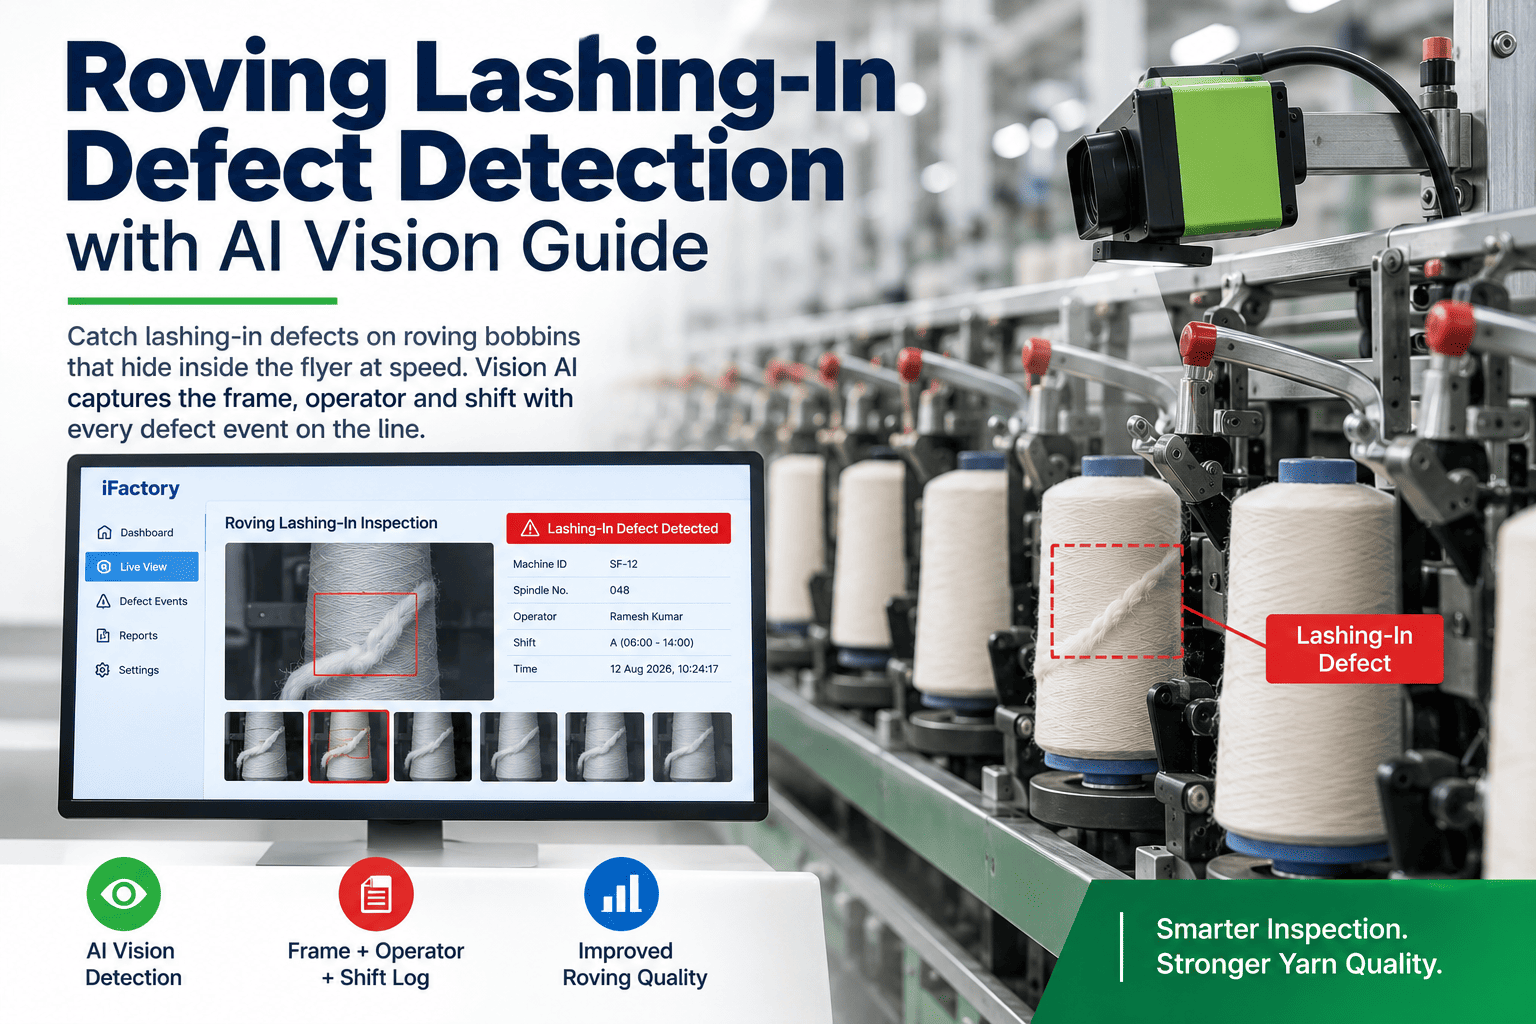
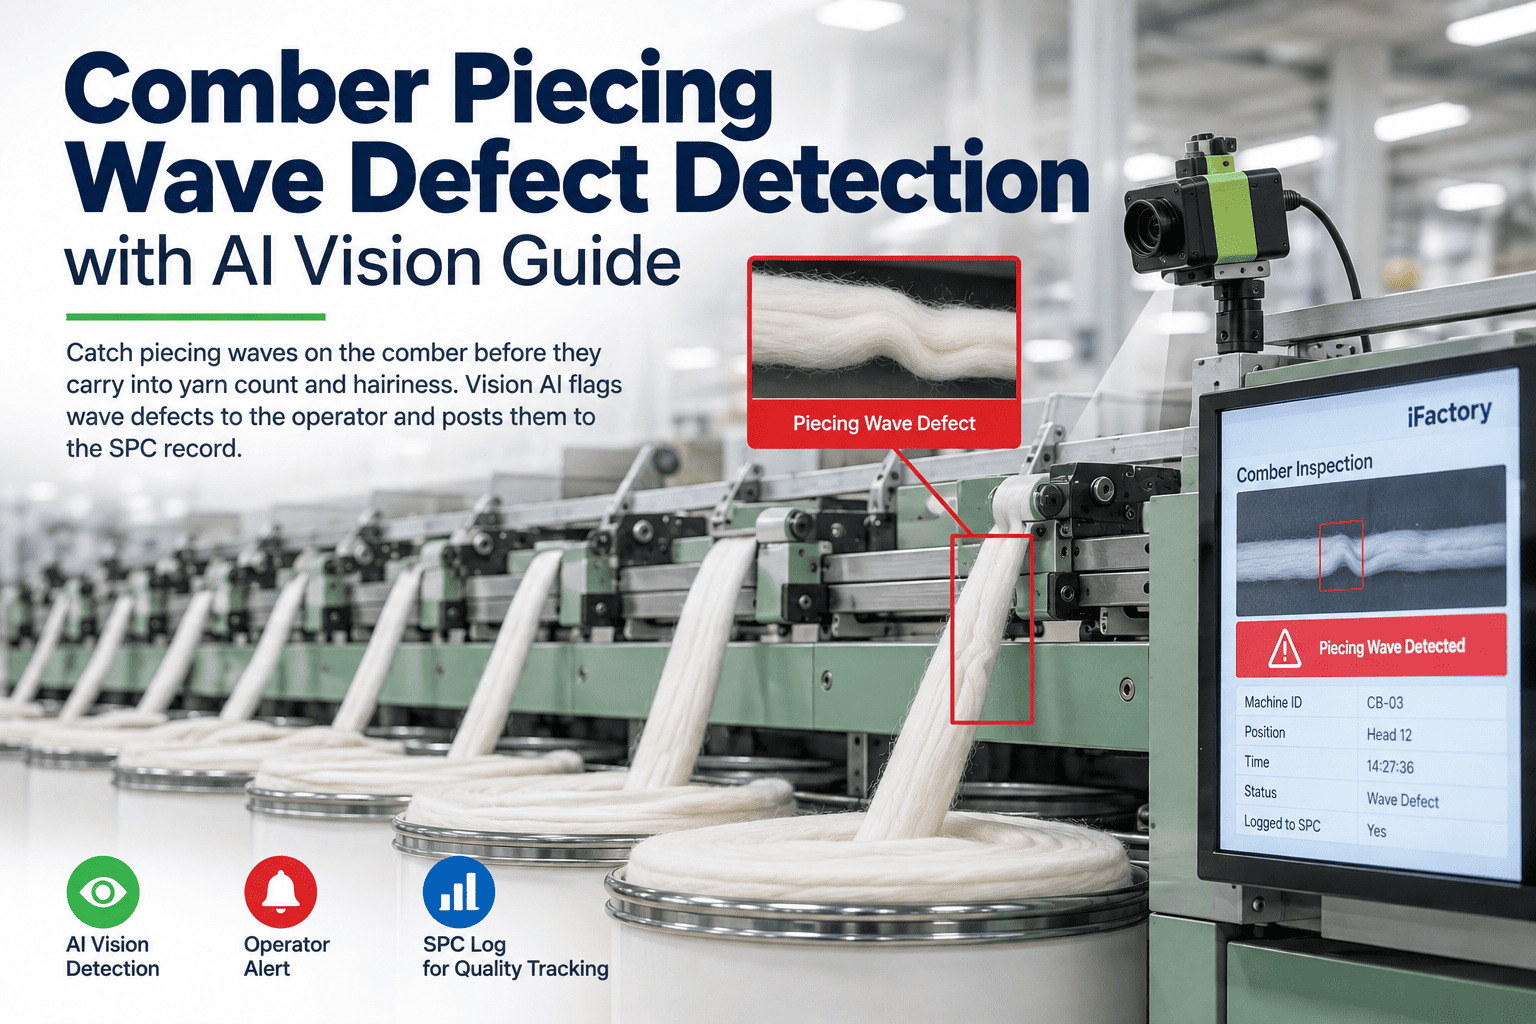
Holes, slubs, stains and shade variation linked to loom, yarn lot and dye batch.
PCB assembly
Solder bridges, missing parts and tombstones linked to paste, placement and reflow.
Root Cause in Practice
The engineer asks, the system shows the evidence.
Root cause suggestions are most useful when the quality engineer can question them. The exchange below shows how a likely cause is checked against process data before anyone changes the process. Questions about setup go to our implementation team.
Defect Classification Mistakes to Avoid
Good models fail on poor definitions.
Most problems in defect classification projects come from labels, rules and data links rather than the AI. These are the most common. A short readiness check can catch them before the pilot.
What works
- A written defect library with lookalikes
- Severity rules by zone, owned by quality
- Per-class precision and recall
- Parts traceable to process data
What fails
- Labelling without agreed definitions
- Letting the model guess severity
- Reporting one overall accuracy
- Root cause with no process data
How iFactory Runs Defect Classification
AI vision with process context, on your own network.
iFactory runs vision models on an on-prem AI server inside your plant. It classifies each defect by type, applies your severity rules by zone, joins the result with machine and process data, and suggests the likely root cause with evidence. Fit questions go to our solutions team.
Type classification
Every defect named from your library.
Severity by rule
Zones, sizes and counts applied the same way.
Process linking
Defects joined with machine, tool and lot data.
Defect trends
By type, severity, line and shift.
Cause suggestions
Likely cause with evidence and confidence.
Human review
Low-confidence defects sent to inspectors.
Results depend on your parts, images, labels and process data. We measure per-class recall, over-rejection and time to cause on your own data during the pilot, rather than promising a general figure.
Turnkey AI: Delivered, Connected and Live in 6–12 Weeks
You do not build this. It arrives ready.
iFactory ships as a pre-configured NVIDIA AI server with the software pre-loaded, racked and ready. Rack it, plug in power and Ethernet, and the AI is live on your network. Our team handles cabling, network setup, PLC, SCADA, DCS and CMMS integration, camera and process links, operator training and 24×7 remote monitoring. Data stays on your network. For a scope matched to your plant, request a turnkey quote.
Ship, network and data
Server installed. Cameras, process data and traceability connected.
Model training and pilot
Defect library and severity rules set. Models trained and validated on held-back images.
Go-live and training
Classification live on the line. Quality team trained. 24×7 monitoring begins.
Frequently Asked Questions
What is AI vision defect classification?
It is the use of AI on inspection images to name each defect type, grade its severity and link it to a likely cause in the process, rather than just passing or failing the part.
How is severity decided?
By your own rules, applied to what the system measures: defect type, size, location on the part and count. The model measures. The rules decide.
How does root cause classification work?
Defect records are joined with machine, tool, lot, shift and process values at the time the part was made. The AI finds patterns and suggests the most likely cause with evidence.
How many images do we need?
It depends on the part and defect types. Common defects usually have enough. Rare, critical defects need every example you can collect, plus human review for low-confidence cases.
How should we measure accuracy?
Use precision and recall for each defect class on a test set held back from training. For critical defects, focus on recall.
Does root cause suggestion replace a quality investigation?
No. It narrows the search by showing which machine, tool, lot or process value changed when the defect rose. The quality engineer confirms the cause and decides the corrective action.
Can it use our existing cameras?
Often, if image quality, lighting and resolution are good enough for the smallest defect you need to see. We check this during scoping.
What happens with unknown defects?
Low-confidence or unfamiliar defects are flagged for an inspector. Once labelled, they can be added to the library and the model retrained.
How do we start?
Start with one line and a few defect types that cost the most. A 6-week pilot builds the library, sets severity rules and links process data. To plan it, contact our team.
Know What, How Bad and Why
In thirty minutes we look at your defect images, quality rules and process data, and sketch a classification plan for one line. You keep the plan either way.
- 1Sample images of your main defects
- 2Your defect catalogue or boundary samples
- 3Acceptance rules by part zone
- 4Process data you log per part or batch
- 5One defect that keeps coming back