A piecing wave on a comber is the defect the machine itself creates — a thick spot in the sliver where one combed web joins the next. The comber runs up to 400 nip cycles a minute, and every one of them is a piecing that has to be clean. When it isn’t, the wave carries forward into yarn CVm, into Uster IPI thick-place counts, and eventually into Uster classimat cuts and cloudy fabric appearance the mill will eventually pay for. Most mills catch the outcome at the winder days later; almost none can point at the specific comber head, the shift, or the setting drift that produced it.
iFactory / Comber piecing wave detection
Catch Piecing Waves on the Comber Before They Reach the Yarn
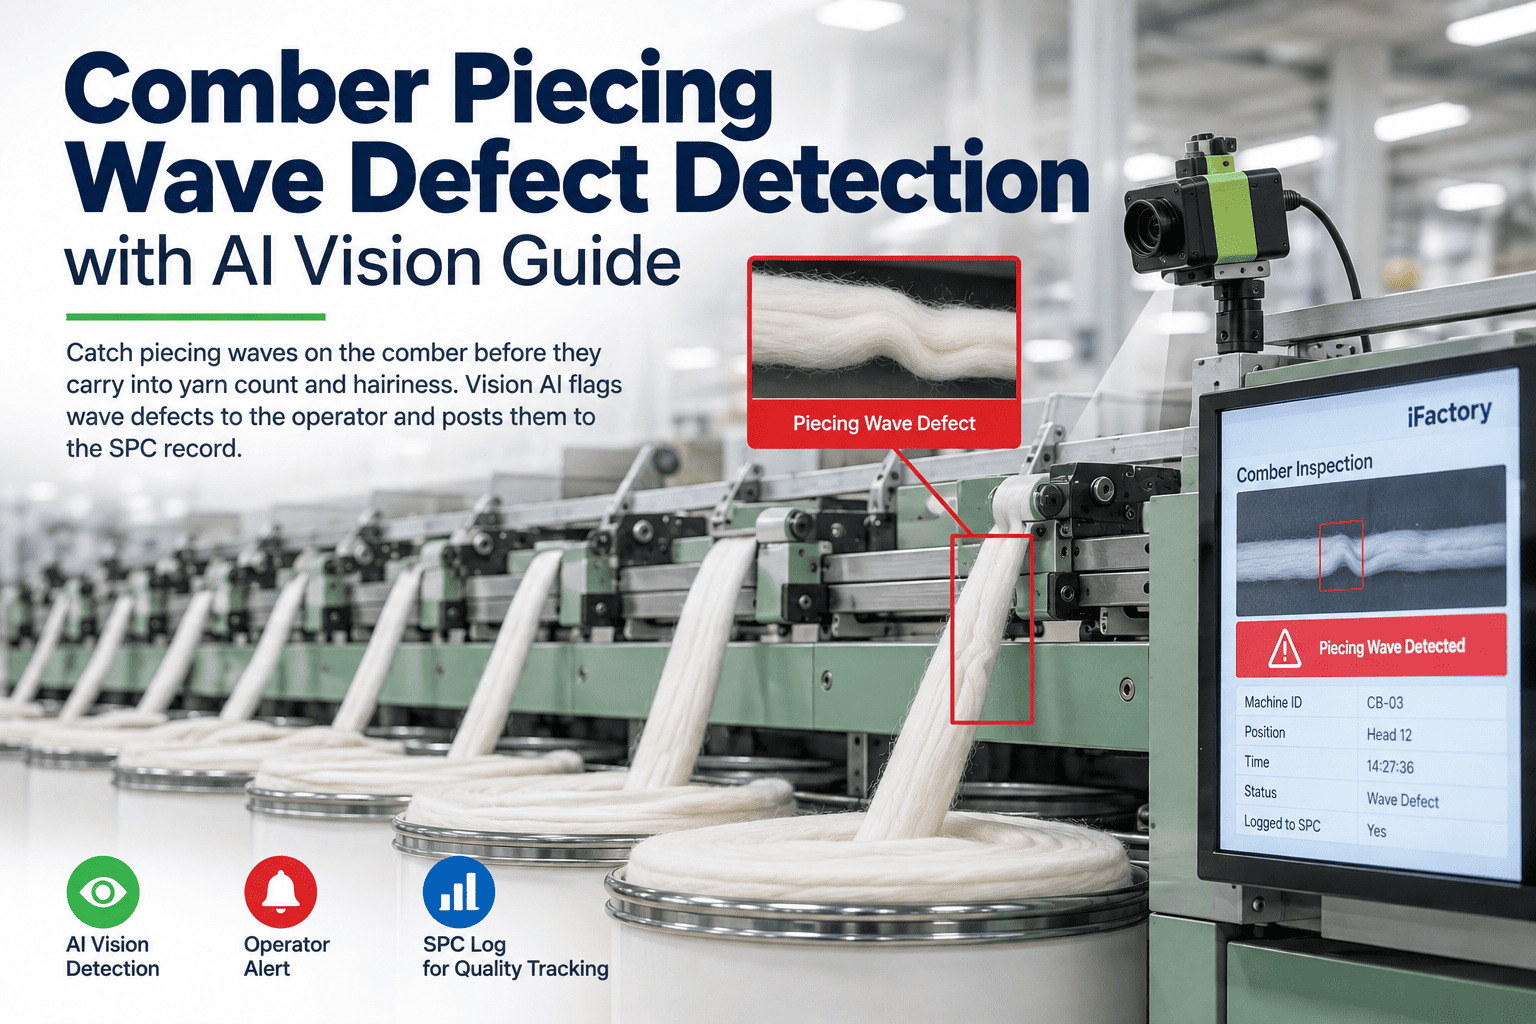
A vision agent above the web takeoff on each comber head watches every nip cycle, flags a piecing wave as it forms, alerts the operator on the head, and posts the event as a data point in the comber SPC record.
Clean sliver profile
Wave defect at piecing
↓
Yarn CVm 13.15% → 14.11%
+ Uster IPI thick places
CVm + IPI
what a wave costs
The Problem on the Line
A modern comber runs at up to 400 nips a minute, and every nip cycle joins the freshly combed web to the tail of the previous one — that’s a piecing. When the piecing is clean, the join is invisible in the sliver. When it isn’t — because the detaching roller reversed late, the top comb pushed too much lap, or web tension was off — the join shows up as a thick wave in the sliver. Each wave carries into CVm, into Uster IPI thick-place counts at the yarn stage, and eventually into cloudy fabric. It doesn’t take much combing drift for a shift’s worth of waves to slip past the operator.
What Escapes Into the System of Record Today
Piecing waves are the defect combers were built to hide — the mechanism's whole point is to make the joins invisible. When they aren't invisible, the record of that fact typically doesn't survive the shift.
Paper
Comber operator sees a wave, throws the affected sliver interval into the noil chute, marks a tally on the shift sheet — "wave 4x today" — no head, no time, no root cause.
WhatsApp
Piecing-heavy shift generates a chat message to the combing supervisor. By Monday the chat has scrolled out and the SPC record for the week shows no elevated defect events.
Winder-only data
Uster Quantum at winding logs a rise in thick-place cuts on the combed count. The winder record shows the outcome; nothing points at which comber head produced the elevated wave rate.
Nowhere at all
A subtle wave that the operator did not see enters the sliver can. There is no digital record of the event at all, and the SPC laboratory sample tested next morning may or may not include the affected metres.
What the Camera or Agent Actually Sees
A vision agent above the web takeoff — where the freshly combed web joins the previous — sees the piecing forming each nip cycle. The point is not to replace the AFIS or Uster Tester lab check; it is to make every piecing a recorded observation and flag the defective ones live.
Web Piecing
Vision on the web between the detaching roller and the sliver formation — the moment the piecing is being made, before it enters the calender rolls.
Read: at web takeoff
Wave Signature
Thick spot at the piecing interval detected as an intensity/optical-density variation against clean-web baseline for the same fibre and mix.
Read: intensity variance
Frequency Trend
Wave events counted per hundred nip cycles, per comber head — the frequency line that predicts whether the shift will produce a Quantum cut spike.
Trend: per 100 cycles
Operator Alert
Live indicator on the comber head when the wave rate crosses the operator-attention threshold — settings review before the batch runs longer.
Alert: on-head signal
What Gets Written Back
Real-time detection is the immediate value. The recording value is that every wave becomes an SPC data point — not a shift-sheet tally — and the mill can finally tell whether combing settings drifted or a specific head is misbehaving.
SPC Data Point
Spinning MES / SPC
Wave event per comber head, per nip interval, joins the combing SPC chart alongside AFIS lab samples — one record, not two.
Head Performance
Comber MES
Waves-per-100-cycles trend per head so a drifting head (bad detaching timing, top-comb wear) surfaces against the fleet average.
Batch Quality Note
MES Batch Genealogy
Sliver can produced during elevated wave rate carries a quality note into batch genealogy, so downstream reads it.
Operator Alert Log
Spinning MES
Every on-head alert timestamped with operator response time — the record that shows whether the alert system is trusted and acted on.
Look at your comber SPC chart for last month. If the only combing-defect data points on it came from once-a-shift AFIS samples, the chart is missing 99% of what happened between samples. Book a line assessment — we'll show what continuous wave detection puts on the same chart.
12-Week Pilot Shape on One Station
One comber, one yarn count, four weeks. The pilot is not sized to prove vision can see a wave — combers have had web-monitoring cameras for years. It is sized to prove the wave events land in the SPC record and change what settings the combing supervisor adjusts.
Weeks 1–2
Vision Baseline
Camera above the web takeoff on one comber head. Two weeks of read-only capture. Baseline: wave events per 100 nip cycles at your actual settings and mix.
Weeks 3–4
Signature Tuning
Wave-signature intensity threshold tuned to your fibre length and top-comb geometry. False-alert rate targeted below the human operator's trigger threshold.
Weeks 5–8
SPC Live
Wave events writing to the combing SPC chart. On-head operator alert live. Wave-rate trend per head visible in the shift-review dashboard.
Weeks 9–12
Setting Feedback
First month of continuous wave data compared against AFIS lab samples on the same intervals. Comber settings adjusted based on the wave trend, not the sample slice.
Who Owns the KPI
Piecing-wave detection sits between the machine and the SPC lab. Both sides need to name the KPI or the data lives in a dashboard nobody looks at.
Combing Sup.
Waves per 100 nips per head
Owns the head-level trend — a rising number on one head means detaching timing, top-comb wear, or web tension needing attention.
Quality Head
Comber IPI / CVm vs the wave rate
Owns the SPC record and the correlation between wave rate and downstream lab samples — validates that continuous data agrees with periodic AFIS.
Shift Supervisor
Operator response time to on-head alerts
Owns the human-in-the-loop — an alert nobody acts on is a signal the mill doesn't trust; a fast response time means the wave data is credible.
Winder Liaison
Winder IPI cuts vs comber wave rate
Owns the downstream loop-close — does the same shift that logged elevated waves show elevated Quantum cuts, and can the mill act before the cuts arrive?
FAQ
Can't the comber's own web monitor already detect this?
Modern combers have web monitors — some machines from Rieter and Trützschler include camera-based web check as an option. Two things are usually missing. First, the machine's own monitor typically triggers a stop but does not create an SPC data point that a QA lead can trend across shifts. Second, older combers on the floor — which most mills still run — often have no web monitoring at all. The vision agent is an SPC data layer that works across both new machines and legacy heads, and it lands the events in the mill's own MES, not the machine vendor's.
How does this interact with AFIS or Uster Tester lab data?
AFIS and Uster Tester lab samples are the reference truth for nep count, short-fibre content, and CVm — nothing replaces them. What continuous wave detection does is fill in the ninety-minute gap between lab samples with actual event data, so when a lab sample shows elevated CVm, the mill can see whether the wave rate rose during the sampled interval or is elevated across the whole shift. The two data streams are complementary; the SPC chart shows both.
Won't this generate false alerts that operators start ignoring?
That risk is real, and it's the reason the first two weeks are read-only. The wave-signature threshold is tuned against operator-observed waves in the same interval, so the alert rate is calibrated to what a good operator would flag — not to every micro-variation in web density. A working target is a false-alert rate below the operator's own manual-stop rate; if it can't clear that bar in the pilot, no live alert ships to the production floor.
Stop losing wave events between AFIS samples.
Put a Month of Continuous Wave Data on Your Comber SPC Chart
Bring one comber head and one month of your AFIS lab samples on the same yarn count. We'll show the wave-per-100-nips trend line filled in between the samples, and where a setting adjustment would have caught the drift earlier.