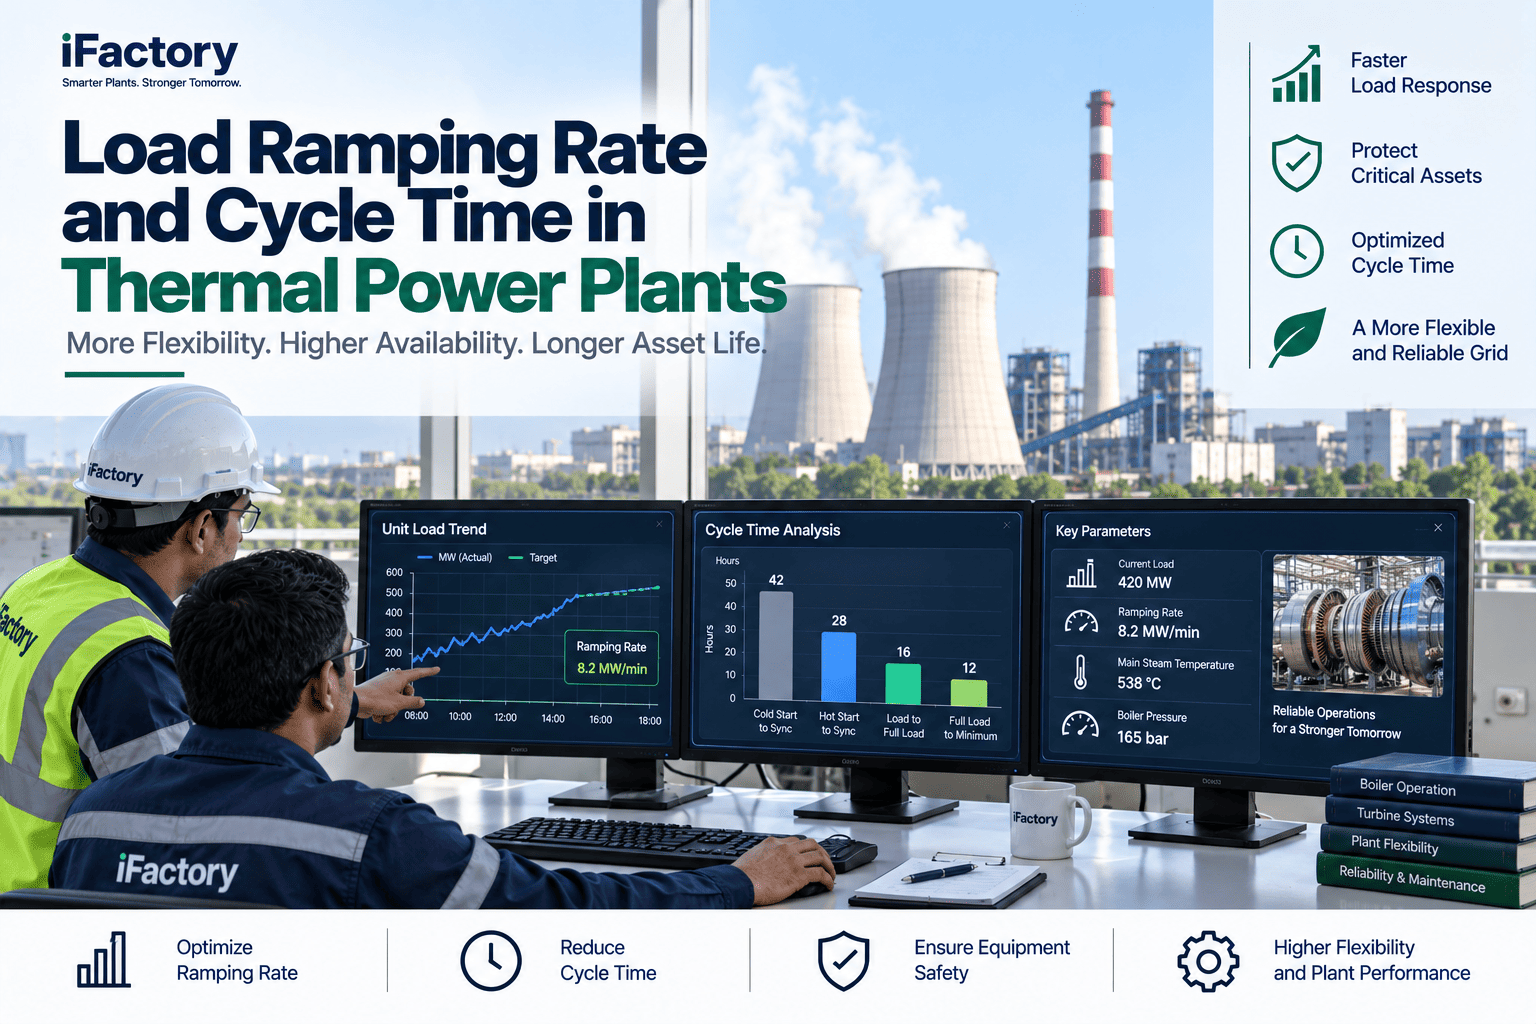
A cold start on a 500 MW coal unit typically runs $417 per MW — north of $200,000 — against roughly $225/MW for a hot start, and takes 6 to 12 hours to reach full load depending on how conservative the plant's startup curve is. Every one of those hours is dispatchable generation the unit isn't selling, on top of the fuel already burned getting there. Most plants don't run that curve conservatively because the physics demands it — they run it conservatively because nobody is watching drum and rotor metal temperature closely enough, in real time, to safely push closer to the actual thermal-stress limit instead of the textbook one. iFactory's Startup Cycle Optimizer is built to close that gap — live thermal-stress tracking that lets operators compress the curve without crossing a single limit.
iFactory Startup Cycle Optimizer
Cut Cold Start Time Without Cutting Corners on Metal Temperature
Live drum and rotor metal temperature tracked against OEM stress limits, so operators can safely compress the startup curve instead of defaulting to the conservative one.
6-12 hrs
typical coal cold start duration
$417/MW
typical cold start cost
$150-200K
lost dispatch, one delayed cold start*
20-30%
cycle time cut, live monitoring
The Startup Cockpit — What Every Start Should Say
Live cycle time reduction means watching every start against its thermal-stress limit in real time, not just its clock. This is what that view looks like across a mixed-fuel station mid-startup.
Unit 1 · Cold Start
Coal 500 MW
On curve
Elapsed4h10mof 6h40m target
Drum metal ΔT38°F/hrwithin limit
Sync target6h40mfrom purge
Fuel burned$142Kso far
Unit 2 · Warm Start
Coal 500 MW
Thermal stress flag
Drum metal ΔT61°F/hrabove typical band
Elapsed2h05mof 3h30m target
Sync target3h30mfrom purge
Fuel burned$58Kso far
Unit 3 · Hot Start
Gas CCGT 450 MW
Ahead of curve
Elapsed0h48mof 1h20m target
Rotor stress margin82%of limit used
Sync target1h20mfrom purge
Fuel burned$21Kso far
Unit 4 · Cold Start
Coal 660 MW, 20+ yrs
Hold — stress limit
Drum metal ΔTAt limitramp hold active
Elapsed5h30mof 9h target
Revenue at risk$180Kif hold extends
Sync target9hfrom purge
The Startup Curve — Where the Hours Actually Go
Startup duration isn't one number — it's a stack of phases, most of it spent raising boiler pressure and matching metal temperature before the turbine ever rolls. The gap between a conservative curve and an optimized one lives almost entirely in that stack.
Design minimum (OEM)
~3 hrs
Ideal conditions
Optimized coal cold start
6-7 hrs
Achievable, live monitoring
Typical coal cold start
8-10 hrs
Fleet average
Conservative / aging coal
10-12 hrs
Revenue left on the table
Manual, no live tracking
12+ hrs
High risk, high cost
*Illustrative: cutting a 500 MW coal unit's cold start from 10 hours to 7 hours — a realistic gain from live thermal-stress monitoring — recovers roughly 3 hours of dispatchable generation per start, worth $150K-200K depending on power prices, without exceeding a single drum metal stress limit.
Where the Hours Actually Go
Every startup curve breaks down the same way, whether it takes 6 hours or 12. What changes is how much margin gets left inside each phase — and boiler light-off and pressure raising is almost always the largest, least-watched piece.
Pre-start checks & purge
10-15%
Furnace purge, lubrication, and sealing systems — largely fixed regardless of curve.
Boiler light-off & pressure raising
30-35%
The largest single phase, and the one most often run to a conservative fixed schedule.
Turbine roll & temp match
20-25%
Where drum and rotor metal temperature limits actually govern the ramp rate.
Synchronization hold
5-10%
Final checks and grid-code conformance before breaker close.
Load ramp to full
20-25%
Final climb to rated output, paced by the same thermal-stress margin.
Want to see where your own units' startup hours actually go? Book a demo — bring your last 20 starts and we'll break the curve down phase by phase.
Fast vs Safe — Same Startup, Two Failure Modes
Compressing a startup curve is only a good idea if it's done against real thermal-stress data. Done blind, it isn't faster — it's a different, more expensive kind of slow.
Rush It
"What happens if we compress the curve without live stress data?"
Drum and rotor thermal-stress limits get exceeded blind
Risk of cracking, distortion, and shortened component life
One bad cold start can cost more than years of saved time
Operators default to conservative curves to avoid exactly this
Monitor It
"What happens if we compress the curve with live stress data?"
Metal temperature and stress margin tracked continuously against OEM limits
Ramp rate pushed to the real limit curve, not a fixed conservative schedule
Every minute saved is generation dispatched, not equipment risk taken on
Same safety margin, less wasted time
How Startup Optimization Gets Built
The curve gets safer to compress by watching the thing that actually limits it — metal temperature and stress — continuously, instead of scheduling around a worst-case table.
01
Ingest Live Thermal Data
Drum metal, rotor, and casing temperatures pulled live from the DCS during every start.
02
Compute Stress Margin
Real-time comparison against OEM thermal-stress curves and ramp-rate limits, not static tables.
03
Recommend the Ramp Rate
Guided ramp targets that use the full available stress margin at each stage of the start.
04
Flag Deviations Live
Any approach toward a stress or ramp-rate limit is flagged to the operator before it's crossed.
05
Log & Improve
Every start logged against the model, tightening the curve safely on the next cycle.
What Live Startup Monitoring Delivers
These are the outcomes stations typically see after moving from a fixed conservative startup schedule to live thermal-stress tracking.
20-30%
Cycle time cut
with live thermal-stress monitoring
$150-200K
Recovered per cold start
illustrative, 500 MW unit
Zero
Limit exceedances
target with live monitoring
6-12 wks
To live monitoring
from kickoff to first live start
Curious how much your own startup curve has left on the table? Talk to our team — we'll benchmark your last several starts against the stress limit.
Frequently Asked Questions
How is this different from our existing DCS thermal alarms?
DCS alarms tell you when a limit has already been reached. The Startup Cycle Optimizer tells you how much margin is left before that happens, continuously, so the ramp rate can be pushed right up to the limit instead of stopping short of it "just in case." An alarm is a stop sign after the fact; a stress-margin readout is the speedometer that lets you use the whole road safely.
Does this replace the OEM startup curve or work within it?
It works within it. OEM stress limits stay exactly as specified — the optimizer doesn't change what's allowed, it changes how precisely the plant operates against what's already allowed. Most fixed startup schedules build in extra margin beyond the OEM limit because there's no live way to know how much margin is actually being used at any moment. Removing that blind-spot margin, not the OEM limit itself, is where the time comes from.
How much cycle time reduction is realistic without a hardware upgrade?
Most stations moving from a fixed conservative curve to live thermal-stress tracking recover 20-30% of cold-start duration using existing instrumentation — no new sensors required in most cases, since drum and rotor metal thermocouples are typically already present in the DCS. The gain comes from using the data that's already being collected, not from adding new hardware.
Does this work for both coal and CCGT units?
Yes. Coal units are typically governed by drum and header metal-temperature stress; CCGT units are typically governed by HRSG drum stress and gas-turbine rotor thermal matching. Both use the same underlying approach — live stress-margin tracking against the OEM curve — with unit-specific limit sets for each technology.
How long does it take to get live startup monitoring running?
Typically 6-12 weeks from kickoff to a live cockpit on one or two units, depending on historian access and how many starts are needed to validate the stress model against your specific equipment. Bring your last 15-20 starts and we'll show you where the existing margin sits before you commit to anything.
Stop starting up on the conservative curve.
Cut Your Startup Cycle Time Without Cutting the Safety Margin
Bring your last 15-20 starts and historian data for drum, rotor, and casing metal temperature. We'll show exactly how much stress margin was left unused, and what compressing the curve to the real limit is worth per start.