Every production process is drifting somewhere, right now, in a direction nobody has noticed yet. Statistical process control exists to make that drift visible before it turns into scrap — and the difference between an SPC program that saves millions and one that everyone quietly ignores comes down to a small set of decisions about which rules fire, on which charts, at which subgroup size, feeding into which response. The plants that get this right have shop-floor operators who actually look at the charts and quality engineers who actually trust the alerts; the plants that get it wrong end up with dashboards nobody opens and defect rates that never improve. If you are running SPC on spreadsheets, or running it on a legacy system your team has stopped believing in, the fastest way to see what real-time, AI-augmented SPC looks like on your process data is to book a demo.
AI-POWERED STATISTICAL PROCESS CONTROL SOFTWARE
Live Control Charts. Real Rules. Signal Instead of Noise.
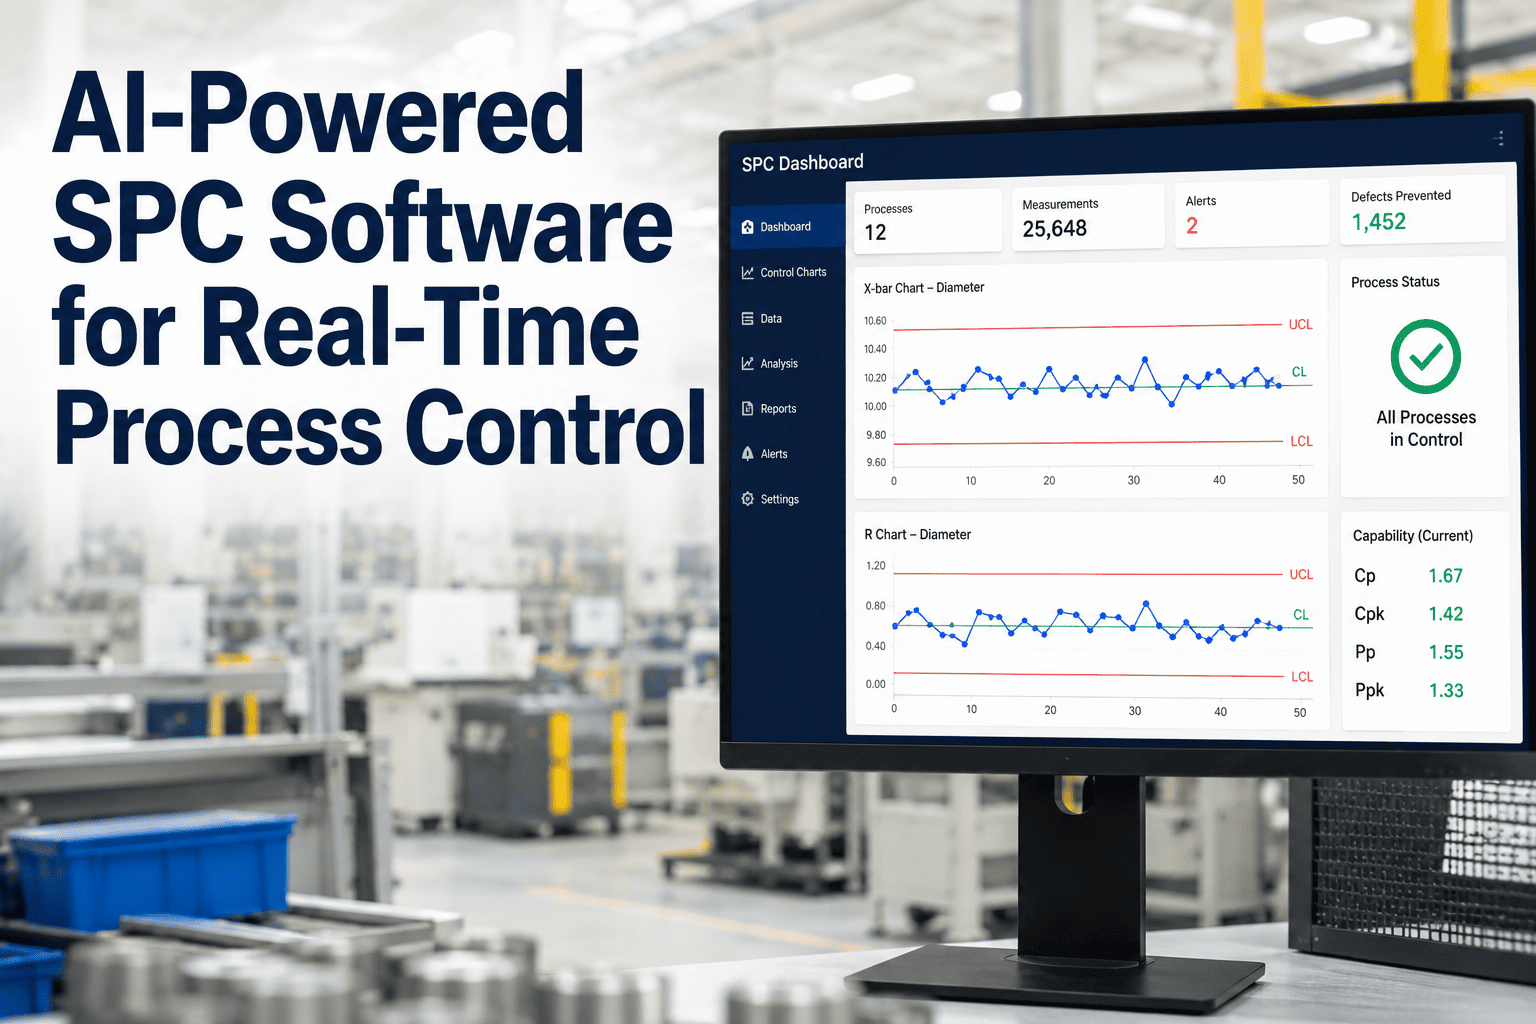
iFactory brings Shewhart, EWMA, and CUSUM control charts together with Western Electric and Nelson rule sets — running in real time on shop-floor process data, and alerting only when the pattern actually deserves an operator's attention.
σ
Every out-of-control signal is a departure from the process's own statistical rhythm — not a spec violation
8
Nelson rules cover the pattern set — Western Electric was the original four; both detect assignable causes
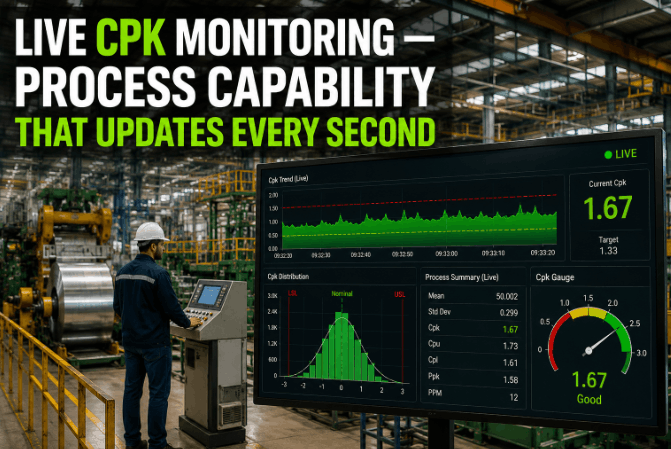
Cpk
Process capability indices quantify how comfortably the process fits inside spec, given its centering
1.33+
The Cpk threshold widely accepted as "capable" for most manufacturing tolerances
The Core Distinction
Common Cause vs Special Cause — the Only Distinction That Matters
Everything SPC does — every chart, every rule, every alert — exists to answer one question: is what I am seeing the normal random rhythm of the process, or is something real changing? Common cause variation is the background noise a stable process makes. Special cause variation is a signal that something specific has intervened — a tool wearing down, a new material lot, an operator shift change, a temperature drift. Reacting to noise wastes effort and destabilizes stable processes; ignoring signal lets defects escape. Every design choice below is built to get that distinction right.
COMMON CAUSE
The Process Being Itself
Random variation inherent to a stable process — the small differences between two units produced on the same machine, by the same operator, in the same hour, from the same material batch. Reacting to common cause is called "tampering" and mathematically it makes the process worse, not better.
Example: A CNC bore that measures 25.031, 25.028, 25.033, 25.030 mm — all inside the natural variation band, spec 25.00 ±0.05.
Right response: Leave the process alone. Improve it only by changing the system, not by adjusting each part.
SPECIAL CAUSE
Something Specific Intervened
Non-random variation caused by an identifiable event — new material lot, insert wear, sensor drift, operator change, ambient temperature swing. The pattern signature depends on the cause, and the SPC rules are designed to catch each signature before it produces defective product.
Example: Same bore measurements suddenly climbing 25.031, 25.033, 25.036, 25.039, 25.042 mm — a monotonic trend that Nelson Rule 3 catches at six consecutive increases.
Right response: Investigate immediately. Something changed, and it will keep drifting until you find and fix it.
The Chart Toolkit
Which Control Chart Applies to Which Process
There is no single "SPC chart." There is a family of charts, each tuned to a specific data type and a specific kind of signal. Picking the wrong chart is the most common early mistake in SPC deployments — using an X-bar chart on individual measurements, or a p-chart on continuous data, produces alerts that look statistically legitimate but are catching the wrong thing entirely. The chart family below is the working set on any real shop floor.
X-bar & R
Subgroup Average & Range
The workhorse for continuous measurement data collected in subgroups — dimensions, weights, torque, force, temperature. Plots the subgroup mean on one chart and subgroup range on a second chart, so shifts in center and shifts in spread are both visible.
Use when: n=2–10 measurements per subgroup, continuous variable
I-MR
Individuals & Moving Range
For continuous data where subgrouping is impractical — batch-level chemistry results, one-per-hour instrument readings, or low-volume production. Plots each individual value and the moving range between consecutive values.
Use when: n=1 measurement per time point, continuous variable
p / np
Proportion Defective
For attribute data — counts of good vs bad units within an inspection sample. p-chart handles variable sample sizes, np-chart is fixed sample size. Standard for pass-fail visual inspection, functional tests, and final QC gates.
Use when: pass/fail data, unit-level defect classification
c / u
Defect Counts per Unit
For count data where a single unit can carry multiple defects — solder joints per board, paint blemishes per panel, weld defects per assembly. c-chart is fixed inspection area; u-chart handles variable area.
Use when: multiple defects possible per inspected unit
EWMA
Exponentially Weighted Moving Average
Detects small, sustained shifts that Shewhart charts miss for weeks. Weights recent observations more heavily than distant ones, so gradual drift shows up as a chart trend rather than a subtle within-limit pattern.
Use when: process is prone to small shifts you need to catch fast
CUSUM
Cumulative Sum
Cumulative deviation from target — extremely sensitive to small persistent shifts. Standard for pharmaceutical batch chemistry, semiconductor overlay, and any process where a 0.5σ shift matters and needs to be caught in fewer than 10 subgroups.
Use when: sub-sigma shift detection is business-critical
The Rule Set
Nelson's Eight Rules — What Each One Actually Catches
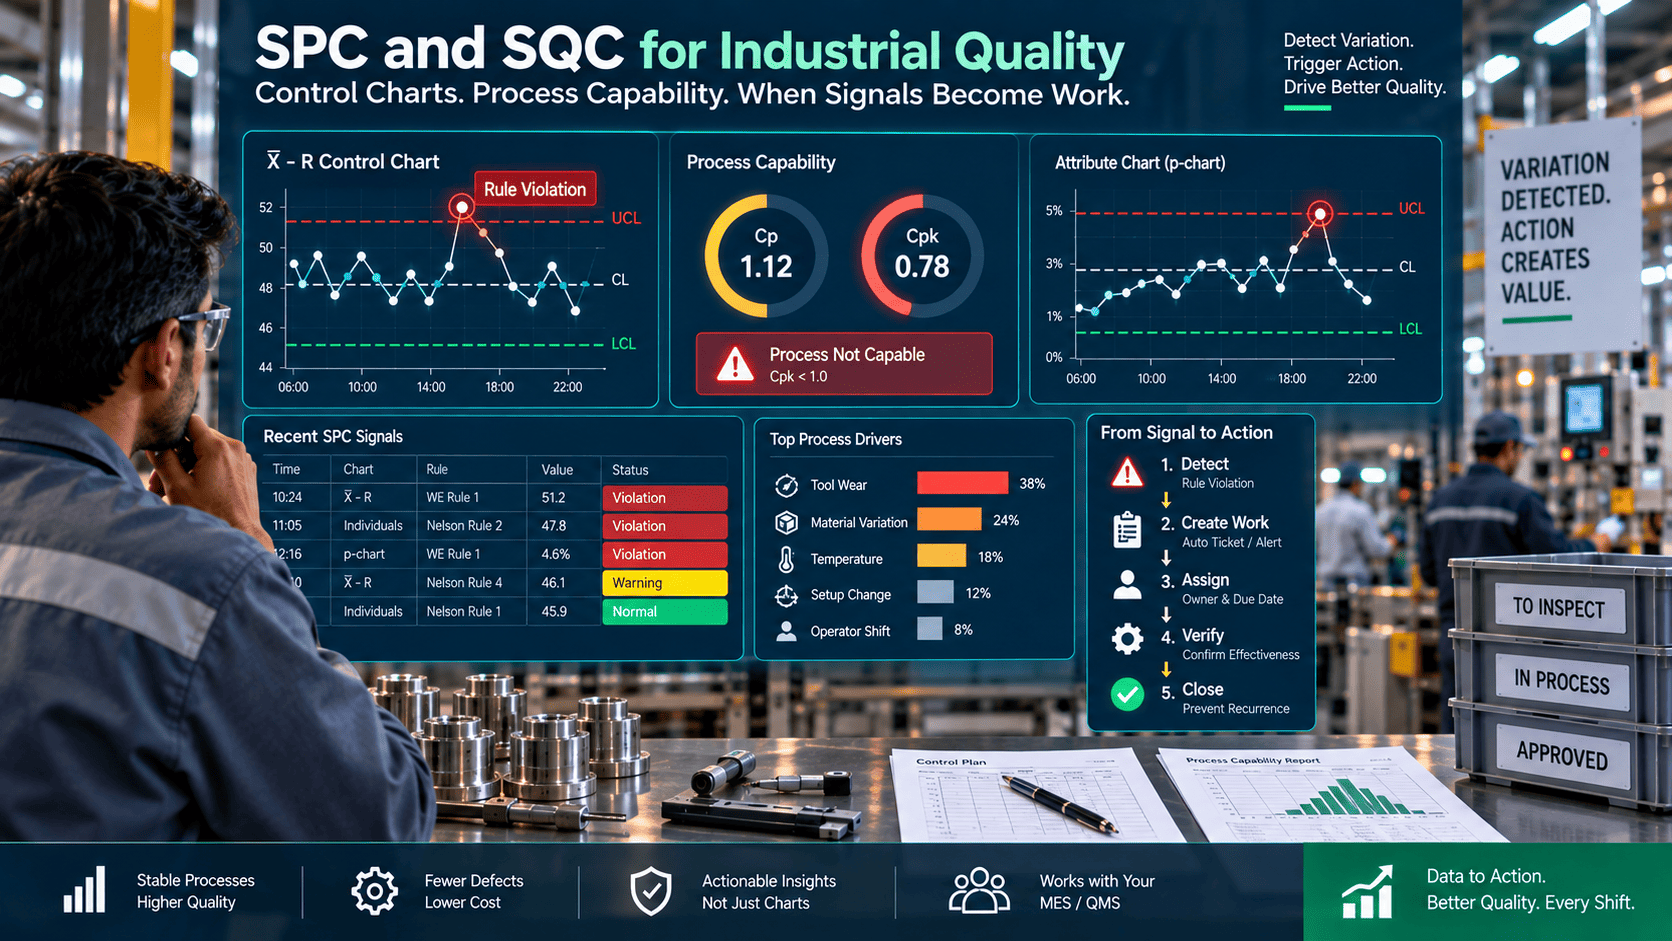
The eight Nelson rules are the working SPC vocabulary of pattern detection. Rule 1 alone catches gross out-of-control events; Rules 2–8 catch the subtle patterns — trends, shifts, oscillations, stratification — that a process throws off before it drifts out of spec entirely. Turning on all eight from day one is how SPC programs die (alert fatigue), so the deployment discipline is to enable the rules that match your process's actual failure modes and add the rest as trust in the system grows.
R-01
One Point Beyond 3σ
The classical Shewhart violation. A single point outside three standard deviations from the center. Catches gross shifts, sensor faults, and clear out-of-control events. Every SPC deployment turns this on first.
Catches: Gross process shift, measurement fault, machine crash
R-02
Nine Consecutive Points on Same Side of Center
A sustained mean shift too small to trip Rule 1 but too consistent to be random. Catches slow drifts from wear, temperature buildup, or new material lot bias — the shifts that Shewhart alone would miss for weeks.
Catches: Mean shift, tool wear, thermal drift, material lot change
R-03
Six Consecutive Points All Increasing or Decreasing
A monotonic trend. Catches steady degradation — a heating element losing efficiency, a fixture wearing, a bath chemistry drifting. This is the pattern that predicts a spec violation before it happens.
Catches: Progressive tool wear, sensor drift, chemistry depletion
R-04
Fourteen Consecutive Points Alternating Up and Down
Over-adjustment — an operator or automatic controller reacting to common-cause variation and pushing the process back and forth. Ironically, this is the pattern created by well-meaning tampering with a stable process.
Catches: Operator tampering, controller instability, over-correction
R-05
Two of Three Consecutive Points Beyond 2σ (Same Side)
Early shift detection. The pattern shows up before the mean fully moves, giving three to five subgroups of warning before a Rule 2 signal would fire. Semiconductor fabs rely on this rule heavily for chamber degradation.
Catches: Early-stage mean shifts, chamber degradation
R-06
Four of Five Consecutive Points Beyond 1σ (Same Side)
Confirms a systematic shift that has settled just outside the normal band but is not extreme enough to trip 2σ or 3σ rules. Complements Rule 5 and provides a second-tier confirmation on shifts that Rule 5 flagged.
Catches: Settled small shifts, systematic bias
R-07
Fifteen Consecutive Points Within 1σ of Center
The counterintuitive rule — the process looks too good to be true. Catches measurement-system problems where the gauge has stopped resolving actual variation, or stratification where subgroups are being combined incorrectly.
Catches: Gauge failure, stratification, incorrect subgrouping
R-08
Eight Consecutive Points Beyond 1σ (Either Side)
Stratification — the process is producing a mix of two distributions rather than one, typically from two machines being combined on one chart or two operators running one process. Points cluster in the outer zones on both sides.
Catches: Mixed streams, two-machine stratification, operator differences
RUN YOUR OWN DATA THROUGH THE ENGINE
See What Nelson Rules Would Have Caught on Your Last Quarter
Most quality teams are surprised when they see their own historical data replayed through a properly configured SPC engine — the signals were there, waiting to be seen.
Capability Analysis
Cp, Cpk, Pp, Ppk — the Numbers That Answer "Is It Capable?"
A process being in statistical control (no special-cause signals) is not the same as a process being capable of meeting spec. Capability indices are how you quantify the second question — how comfortably does the process fit inside the tolerance band, and how far off-center is it? Every serious SPC deployment reports these indices continuously alongside the control charts.
Cp
Potential Capability
How well the process spread fits inside the tolerance width, assuming it were perfectly centered. Ignores centering. High Cp with low Cpk means the spread is fine but the process is off-target.
Cpk
Actual Capability
Accounts for both spread and centering — how close the process is to the nearer spec limit. Cpk ≥ 1.33 is the widely-accepted "capable" threshold; Cpk ≥ 1.67 is the target for critical characteristics.
Pp
Overall Performance
Same computation as Cp but using long-term (overall) standard deviation rather than within-subgroup. Reflects the process spread including drift and shift over the observation window.
Ppk
Overall Performance Index
Cpk equivalent using overall standard deviation. Ppk lower than Cpk is diagnostic — it says the process is capable within a subgroup but drifts across subgroups, pointing to a between-subgroup source of variation.
The gap between Cpk and Ppk is often more diagnostic than either number alone. A large gap means the process has shifts and drifts hiding in the between-subgroup variation — exactly the pattern the Nelson rules are designed to catch in real time.
The Alert Fatigue Trap
Why Most SPC Programs Fail — and How Real-Time AI Fixes It
The single most common cause of SPC program failure is not bad statistics — it is turning on every rule from day one, watching operators drown in three to five alerts per shift, and losing the team's trust in the system inside eight to ten weeks. When the real signal finally arrives, nobody investigates. The failure mode is documented across pharma, automotive, food, and semiconductor. The fix is deliberate rule discipline plus intelligent noise reduction.
HOW SPC PROGRAMS DIE
1
All 8 Nelson rules turned on at rollout
2
Every chart fires 3–5 alerts per shift
3
Operators stop reading alerts after week 4
4
QA stops investigating after week 8
5
Real special-cause signal escapes to customer
HOW iFACTORY KEEPS THEM ALIVE
1
Start with Rule 1 on critical KPIs only
2
Add Rules 2–3 over weeks 3–4 as trust builds
3
AI classifies signal likelihood, suppresses low-value
4
Alerts routed by severity to right role
5
Every fired alert becomes a learning event
What the AI Layer Actually Adds
Where Machine Learning Improves the Classical SPC Stack
Classical SPC is a mature, statistically-rigorous framework — the AI layer does not replace it, it amplifies it. Three specific additions matter, and each one solves a real, documented problem that has held back SPC programs for decades.
AI-01
Signal-vs-Noise Classification on Rule Fires
When Nelson Rule 2 or Rule 3 fires, a classification model looks at the surrounding context — production schedule, material lot, operator, ambient conditions — and estimates the probability this is a genuine special-cause versus a coincidental pattern. High-confidence signals escalate immediately; low-confidence patterns are trend-tracked without operator interruption. This is the anti-alert-fatigue engine.
AI-02
Predictive Signals from Multivariate Patterns
Classical SPC watches one characteristic at a time. Real processes have dozens of correlated characteristics, and the earliest signals of a drift often appear as subtle joint movements across several variables. A multivariate anomaly model catches those patterns hours or shifts before any single univariate chart would trip a Nelson rule.
AI-03
Root-Cause Ranking When a Signal Fires
When a rule fires and requires investigation, the system ranks likely root causes based on the historical pattern library — which past special-cause events produced this same signature. Instead of the quality engineer starting from zero, they start with a ranked hypothesis list and the corresponding evidence, dramatically shortening time-to-resolution.
Cross-Industry Deployments
Where Real-Time SPC Pays Off Fastest — and Which Charts Get Used
SPC is a universal framework, but the specific chart family and rule discipline vary by industry based on what defect signatures actually look like. The table below is the working default for each vertical — the starting configuration that most deployments land on before industry-specific tuning.
Quality Manager Perspective
Field Perspective
P
Priya M.
Quality Manager, Precision Machining, Automotive Tier-1
Our old SPC system fired eleven alerts on my morning walkthrough — and by lunch, we had investigated none of them. When we moved to a rule discipline that started with just Rule 1 on our critical bores and added Rule 3 for tool wear detection in week four, the alert count dropped to two per shift and both were real. The team started trusting the charts again inside a month. Six months in, we caught a supplier material variation from a Rule 5 signal before it produced a single scrap part. That is the SPC program we always wanted.
Common Questions
SPC Software — Real Questions Quality Teams Ask Before Committing
Do we replace our existing quality system, or does SPC sit alongside it?
The SPC layer typically sits alongside your existing quality system rather than replacing it — MES, LIMS, and CMMS platforms remain the systems of record for job data, material lots, and work orders, while the SPC engine handles the real-time statistical monitoring and pattern detection on the process data streams. Integration happens through standard connectors that pull measurement data as it is captured and push detected signals back as work orders or CAPA drafts in the existing system, so operators and quality engineers do not have to log into a separate application to see or respond to alerts. This overlay approach is the reason SPC deployments can go live in weeks rather than months, and it is the pragmatic path for plants that have already invested in a broader quality management stack.
How long before the SPC system is actually catching things our old process missed?
Rule 1 catches (points beyond 3σ) usually start firing on the first day of live operation because they do not require any historical training — the control limits are calculated from your process data as it accumulates, and gross out-of-control events show up immediately. The pattern-based rules (Rules 2–8) become useful once enough clean baseline data exists to establish reliable control limits, which is typically two to four weeks of stable operation. Predictive multivariate signals from the AI layer take longer, usually six to eight weeks, because the model needs to see enough operating variety to distinguish routine correlation patterns from anomalous ones. Most deployments report their first "we would not have caught that without SPC" event within the first month, and the deeper predictive value builds over the following quarter.
What happens when our process is not normally distributed — does SPC still work?
Classical Shewhart control charts assume approximate normality of subgroup means, which the Central Limit Theorem provides for subgroup sizes of four or more in almost all practical cases — even when the individual measurements are skewed, the subgroup means become approximately normal quickly. For processes with heavily non-normal individual data and subgroup size of one, the platform supports data transformations, distribution-specific control charts (Weibull, exponential), and non-parametric alternatives that do not assume normality at all. The right choice depends on the specific process and is typically determined during the initial deployment, and the platform makes the assumption test visible so quality engineers know exactly what statistical basis their charts are using rather than trusting a default that may not apply.
How does the AI layer decide which rule fires are real signals versus noise?
The classification model is trained on your plant's history of investigated rule fires — which ones were confirmed special causes and which turned out to be coincidental pattern noise — and it uses that history along with contextual features like production schedule, material lot, operator, tooling age, and ambient conditions to estimate the probability a new rule fire is a real signal. High-confidence signals escalate immediately to the operator and quality engineer with the ranked root-cause hypotheses attached; lower-confidence patterns are logged and trend-tracked without interrupting anyone. The model refines continuously as investigations close, so the false-alarm rate drops over the first three to six months of operation and the signal recall stays high — which is exactly the alert-fatigue problem that kills classical SPC programs, solved at its root. If you want to see how this would work against your own investigation history, the fastest path is to walk through it during a scheduled
demo.
Can we start on one line or one product before rolling out across the plant?
Yes, and this is the recommended deployment pattern — a single high-value line or a specific critical product is chosen for the initial deployment, the SPC engine goes live with a disciplined rule set (typically Rule 1 plus the one or two pattern rules that match the line's actual failure modes), and the first month of operation builds the internal case for expansion. This staged approach lets you validate the alert quality and the response workflow on a manageable scope before scaling, and it lets the quality organization build the operational muscle memory of "signal fired → investigate → close" without doing it under time pressure across the whole plant. For scoping which line or product would give your quality team the strongest first data set, the implementation team can walk through the options through
support.
SHEWHART · EWMA · CUSUM · NELSON RULES · CAPABILITY
Real-Time SPC. Real Rules. Real Signals — Not Noise.
iFactory brings the full classical SPC toolkit together with an AI signal-vs-noise layer that keeps alerts trustworthy — so your operators watch the charts, your quality team investigates real events, and your process actually gets better instead of just being monitored.
6 ChartsFull Chart Family
8 RulesNelson + Western Electric
Cp/CpkLive Capability Indices
Real TimeShop Floor Streaming