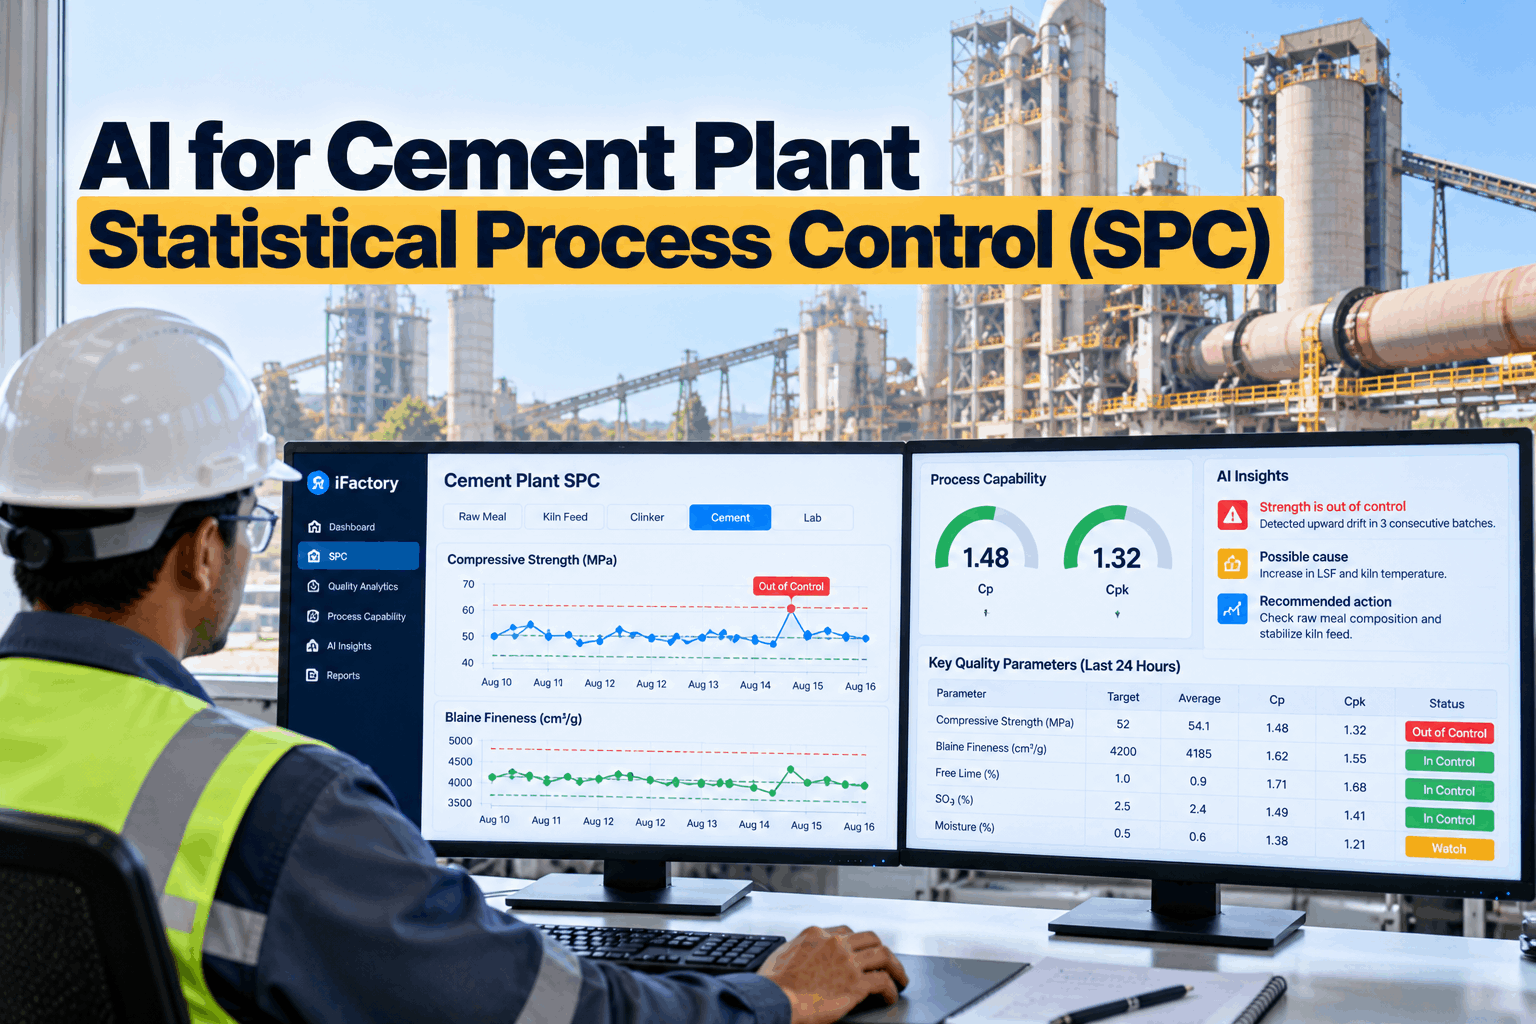
Cement quality is decided long before a cube is crushed in the laboratory. A small move in raw meal lime saturation, a kiln feed that swings from shift to shift, a burning zone running slightly cool — each leaves a statistical fingerprint hours before free lime, Blaine or 28-day strength confirm the damage. iFactory's AI Quality Analytics runs statistical process control (SPC) on every characteristic across raw meal, kiln feed, clinker, cement and the lab itself, charting each signal in real time and surfacing out-of-control drift while there is still time to act. To see it running on your own plant data, book a live walkthrough.
Catch Cement Quality Drift Hours Before the Lab Confirms It
iFactory charts LSF, silica and alumina modulus, kiln feed uniformity, clinker free lime, Blaine, SO3 and strength on one AI-run SPC layer — with control limits that respect how a cement process really behaves, capability indices you can defend, and a ranked cause list the moment a signal leaves control.
- Five stages on one control plan
- Cp, Cpk, Pp and Ppk on every characteristic
- Runs on a pre-configured NVIDIA AI server inside your plant
Why Textbook SPC Struggles in a Cement Plant
Statistical process control was designed for discrete parts measured one after another, each reading independent of the last. A cement line breaks nearly every one of those assumptions. Material sits in blending silos, preheaters, kilns and mills for long residence times, so consecutive samples resemble each other; the results that matter most arrive late; and the laboratory adds its own variation on top of the process. Charts built on Shewhart rules alone then do one of two things — alarm constantly until operators stop looking, or sit quiet while a slow drift walks the kiln out of its operating window. If that sounds familiar, our support team can review how your current charts are configured.
Results arrive after the material has moved
Laboratory free-lime results typically reach the control room two to four hours after sampling, by which time several hundred tonnes of clinker have left the burning zone. Compressive strength is slower still — the 28-day figure describes cement that shipped weeks ago.
Consecutive samples are not independent
Silos, preheater towers and mills smooth the stream, so each hourly sample carries a memory of the one before it. SPC research in the chemical and process industries is consistent on the effect: conventional limits applied to autocorrelated data generate a stream of false alarms.
Sampling is sparse against a continuous process
An hourly spot sample describes a few hundred grams out of hundreds of tonnes. Between samples the process keeps moving, and a cement plant control chart that only refreshes on lab results is blind for most of every hour.
Lab variation hides inside process variation
Sample preparation, XRF calibration and analyst technique all add scatter. Unless testing error is separated from true process variation — the principle behind the corrected standard deviation in ASTM C917 — capability numbers flatter or punish the plant unfairly.
One Control Plan Across Five Stages
iFactory cement SPC treats the plant as a single chain of characteristics instead of five separate lab sheets. Each stage has its own charts, limits and reaction plan, and each is linked to the stage upstream so a signal in the clinker can be traced back to the raw meal that caused it. The reference bands below are ranges commonly quoted across the industry; your own targets by product type and standard are loaded during configuration.
Two details in that map matter more than they look. First, the laboratory is a stage in its own right — a control chart on the reference sample tells you whether a jump in SO3 belongs to the mill or to the spectrometer. Second, the clinker row carries a predicted value alongside the measured one, which is how the two-to-four-hour gap closes. To have the map built against your own control plan, book a mapping session.
How iFactory's AI Changes the Statistics
This is where generic cement plant SPC software and a cement plant AI platform part ways. A charting package draws limits around whatever numbers it is given. iFactory first models how each characteristic behaves in your plant, then applies the chart that suits that behaviour — which is the difference between a cement plant SPC dashboard people trust and one they mute.
Charts built on residuals, not raw readings
For each characteristic the platform fits a time-series model of normal behaviour and charts the gap between what the model expected and what arrived. Residuals are close to independent, so the limits mean what they are supposed to mean and false alarms fall away without widening the limits.
EWMA and CUSUM for the slow drifts
Shewhart rules catch a sudden jump. The costly failures in cement are slow — a feeder wearing, a stockpile grading change, coal ash creeping up. Exponentially weighted and cumulative-sum charts accumulate small deviations and signal a sustained shift of a fraction of a standard deviation, well before a single point crosses a limit.
Soft sensors that close the lab gap
Models trained on your history estimate free lime from burning zone temperature, kiln drive load, NOx, oxygen and feed chemistry, refreshing every minute. Each new lab result is used to check and re-centre the estimate, so the control room sees a continuous chart instead of one point an hour.
Process capability you can defend
Cp and Cpk are reported next to Pp and Ppk, so short-term and long-term variation are never confused. One-sided limits — a strength minimum, an SO3 or free-lime maximum — get one-sided indices instead of a forced two-sided calculation, and testing error can be removed before any index is quoted to a customer.
Multivariate drift detection
LSF, SM and AM are computed from the same four oxides and move together. A multivariate chart flags a combination that is unusual even while each modulus sits inside its own limits — the pattern single-variable charts miss by design.
Ranked causes, not just flagged points
When a characteristic leaves control, the AI compares the hours before the signal with normal operation and ranks the upstream variables that changed. The operator gets a short list to check instead of a blank chart and a phone call to the lab.
Every model is validated against your own laboratory history before it appears in front of an operator, and its error band is drawn on the chart beside the estimate. For the validation method in detail, ask our process engineers.
Anatomy of a Drift: The Same Morning, Two Timelines
The example below follows one ordinary event — a stockpile changeover that nudges limestone grade — through a plant charting on lab results alone and through the same plant running iFactory. The chemistry is identical in both. What changes is when the plant finds out.
- 08:45Stockpile changeover; limestone grade shifts slightly.
- 09:00Kiln feed LSF begins to climb inside its limits. No chart rule is broken.
- 12:00Clinker spot sample taken and sent to the laboratory.
- 14:30Lab reports free lime at 2.3% — the clinker is already in the silo.
- Next shiftFuel is raised to compensate. The cause is still unknown.
- 08:45Stockpile changeover logged as an event on every downstream chart.
- 09:40EWMA on kiln feed LSF signals a sustained upward shift.
- 10:05Soft sensor forecasts free lime leaving its band; cause ranking points to the limestone feeder ratio.
- 10:20Raw mix set-point reviewed with the lab; advisory acknowledged.
- 12:00Sample taken — the lab later confirms free lime in band.
Ask the chart a question
Every chart has a conversational layer. Operators and quality engineers can ask why a point was flagged, what the forecast is for the next sample, or how capability compares across mills — in plain language, at the control desk or on a phone. The AI answers with the statistics behind the flag and stays advisory: set-points remain with your operators and your existing control system.
The first response to a drift becomes a measured raw mix correction instead of extra fuel burned to chase a number that was already hours old. You can try the same conversation against your own data on a pilot call.
See Your Own Characteristics on a Live Control Chart
Share three months of laboratory and historian data. In a six-week pilot we chart your raw meal, kiln feed, clinker and cement characteristics, validate the free-lime soft sensor against your lab, and hand back a capability baseline for every product.
Delivered as a Turnkey AI System — Hardware and Software Together
iFactory ships as a complete bundle: a pre-configured NVIDIA AI server, racked and ready, with the SPC models, soft sensors and chart library pre-loaded. Rack it, plug in power and Ethernet, and the AI is live on your network — plant data stays inside the plant. Our team handles cabling, network setup, PLC, SCADA and DCS integration, laboratory connections, operator training and 24×7 remote monitoring, so your quality and process engineers are not asked to become an IT project team. For a scoped proposal, speak with our deployment team.
Ship, network and data
Server delivered and racked. Connections made to the DCS, historian, XRF, online analyzers and LIMS. Twelve months or more of history loaded, cleaned and aligned for process time lags.
Model training and pilot
Residual models, soft sensors and limits trained per characteristic. Charts run in shadow mode against laboratory results while alarm rates are tuned with your quality team.
Go-live and training
Charts and advisories go live in the control room and the lab. Operators, shift chemists and engineers are trained, and reaction plans are signed off for every characteristic.
Connects to the Instruments and Systems You Already Run
SPC is only as good as the data reaching it. iFactory reads process signals over OPC UA, Modbus and MQTT at the DCS and PLC layer, takes chemistry from laboratory XRF and XRD instruments and cross-belt PGNAA analyzers, and exchanges results with LIMS and robotic laboratory systems. It overlays the control and laboratory platforms already in place instead of replacing them — raw mix optimizers and kiln expert systems keep doing their job, with a statistical layer above them that says whether the whole chain is in control. Check your own stack with an integration review.
Spreadsheet Charts, Generic SPC Software and AI SPC Compared
Most plants already do some form of SPC. The question is how much of the work the system carries and how much is left to a shift chemist with a spreadsheet at the end of a long shift.
Why Cement Producers Are Moving on SPC Now
The global cement market was valued at roughly USD 384 billion in 2025 and is forecast to grow at about 3.3% a year, with Asia Pacific holding around two-thirds of it. Growth at that pace means margin comes from consistency, not volume. Over the same period the statistical process control software market — about USD 1.45 billion in 2026 — is forecast to more than double by the mid-2030s at a 9–10% annual rate, as manufacturers replace manual charting with connected, AI-assisted platforms. Three pressures are pushing cement in the same direction.
More components, more variation
Blended cements are the fastest-growing product segment. Slag, fly ash, calcined clay and limestone each bring their own variability, and every addition is one more characteristic to hold in control.
The fuel mix keeps changing
Waste-derived and biomass fuels vary in heat value, moisture and ash from load to load. Ash ends up in the clinker and shifts its chemistry, so the kiln's quality window narrows as substitution rises.
The standards are statistical
EN 197-2:2020 builds conformity on factory production control and autocontrol testing judged against statistical criteria, and ASTM C917/C917M-25 reports single-source variability corrected for testing error. Customers increasingly ask to see the numbers.
Uniformity has been improving for decades — ASTM data show the share of plants holding 7-day strength standard deviation under 2.1 MPa rose from 63% to 81% between the late 1970s and 1991 — and plants still charting by hand are now competing against that curve. To compare notes on where your plant sits, reach our cement specialists.
What Each Team Gets
Quality manager
A capability baseline for every product and mill, conformity evidence ready for certification audits, uniformity reports for customers, and a ready starting point for each Six Sigma project.
Process engineer
Ranked causes behind every signal, upstream-to-downstream traceability, and a record of which corrections moved the process and which did not.
Control room operator
One screen showing which characteristics are in control, a forecast for the next lab result, and a short suggested check when something starts to move.
Plant head
A weekly view of variation by stage, the cost drivers attached to it — fuel, clinker factor, rework — and evidence that quality is being managed, not just inspected.
Frequently Asked Questions
What is SPC in a cement plant, and what does AI add to it?
Statistical process control uses control charts and capability indices to separate normal process variation from a real change that needs action. In a cement plant it is applied to chemical and physical characteristics from raw meal through to finished cement. AI adds three things classical charting lacks: models that handle the autocorrelated, slow-moving nature of cement data, soft sensors that estimate results between laboratory samples, and automatic ranking of the upstream causes behind each signal.
Which characteristics does iFactory cement SPC chart?
Typically LSF, silica modulus and alumina modulus in raw meal; LSF variability, uniformity index and feed rate in kiln feed; free lime, litre weight and C3S in clinker; Blaine, residue, SO3, setting time and 1- to 28-day strength in cement; and reference-sample, duplicate and bias checks in the laboratory. Any characteristic with a target, a tolerance and a data source can be added — including addition ratios for blended products and fuel quality for the kiln.
How does the platform avoid the false alarms we get from our current control charts?
Most false alarms in process plants come from applying limits that assume independent samples to data that is serially correlated. iFactory fits a time-series model to each characteristic and charts the residuals, which behave much closer to independent data. Limits are then tuned in shadow mode against your history until the alarm rate is one your operators will respect — tight enough for real cement plant AI drift detection, quiet enough to be believed.
Can the AI really predict free lime and 28-day strength?
Free lime is a well-suited soft-sensor target because the kiln signals that drive it are measured continuously, and every laboratory result is used to check the estimate. Strength forecasts combine chemistry, fineness and early-age results. Published machine-learning research on more than 10,000 industrial concrete mixes reported 28-day strength predictions within roughly ±4.4 MPa, which shows the approach is workable — but your models are validated on your own history, their error band is displayed on the chart, and they never replace conformity testing.
How are Cp, Cpk, Pp and Ppk handled when a specification has only one limit?
Many cement requirements are one-sided — a minimum strength, a maximum SO3 or free lime. For those, iFactory reports the one-sided index against the single limit instead of forcing an artificial two-sided calculation. Cp and Cpk use short-term variation while Pp and Ppk use overall variation, and both are shown, because in an autocorrelated process the gap between them is itself a diagnostic of how much the mean is wandering.
Does iFactory replace our raw mix optimizer, kiln expert system or LIMS?
No. Those systems control and record; iFactory monitors and explains. It reads their data, charts the full chain of characteristics above them, and passes advisories back to people — set-points stay with your operators and existing control layer. Plants running a raw mix optimizer usually find SPC most useful for showing whether the optimizer, the blending silo and the laboratory are each performing to their own capability.
How long does deployment take, and what do we need to provide?
A typical project is live in 6–12 weeks. You provide rack space, power, an Ethernet connection, read access to the DCS or historian and laboratory data, and a quality lead to agree targets and reaction plans. iFactory supplies the pre-configured NVIDIA AI server, software, integration, training and 24×7 remote monitoring. To scope your plant, book a scoping call.
Put Every Cement Quality Characteristic Under Statistical Control
One turnkey system — NVIDIA AI server, SPC software, integration and training — delivered and live inside 12 weeks. Start with a pilot on one kiln line, or scope the whole plant from quarry to dispatch.
- Pre-configured NVIDIA AI server, racked and ready
- DCS, laboratory, analyzer and LIMS integration
- SPC models and soft sensors trained on your history
- Operator, shift chemist and engineer training
- 24×7 remote monitoring after go-live