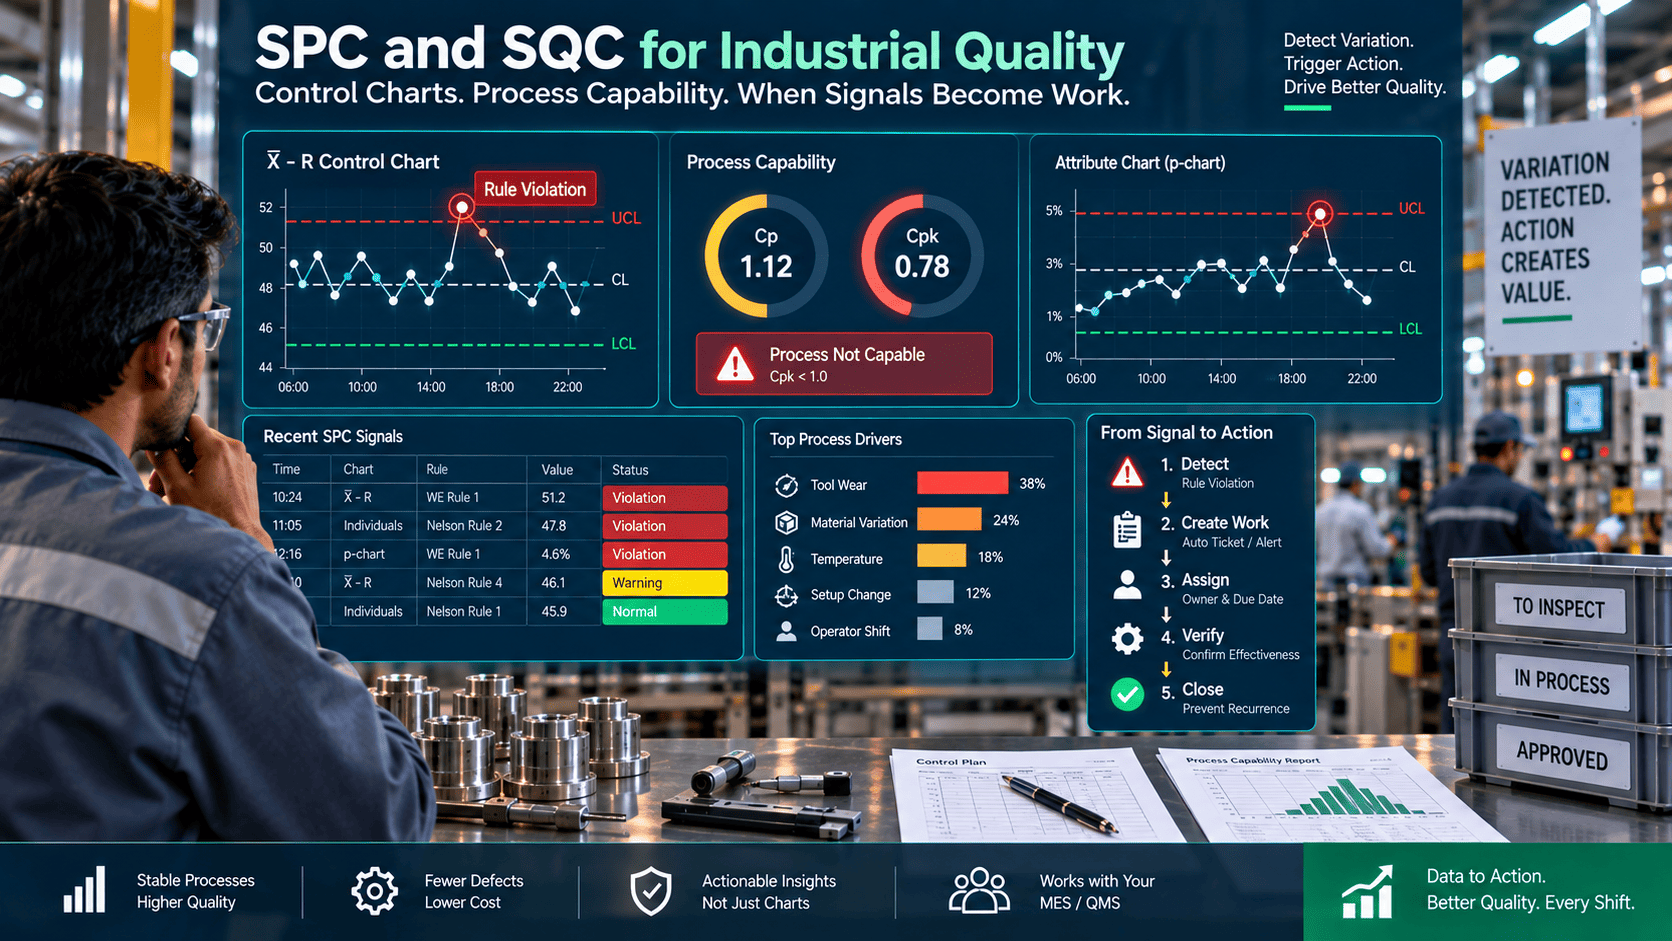
It’s 3:30 AM on a high-speed packaging line. Anne glances at the SPC chart, sees points drifting toward a limit and an alarm blinking — but operators stand by while scrap starts to pile up. The problem isn’t the statistics. It’s that nothing turns the signal into a timely, consistent shop-floor action. Modern factories capture more process data than ever, yet the link between a control-chart signal and a focused corrective task is still a human handoff. This is how to read control charts, interpret process capability, and close the signal-to-action gap without replacing the systems you already run.
iFactory / SPC & SQC control charts
When a Control-Chart Signal Becomes Assigned Work
An overlay action layer that reads your existing SPC streams, applies Western Electric and Nelson rules, and turns each real violation into a prioritized, owned, closed-loop work item — with the chart snapshot and genealogy attached.
Rule violation
NELSON-3 · 02:14
↓
Context attached
FILL-02 · Cpk 1.12
↓
Work card assigned
WC-4417 → line tech
↓
Verified on chart
Retest · back in control
Nelson + WE
run rules, not just limits
Overlay
no rip-and-replace
Closed loop
signal to verified fix
The Problem on the Floor
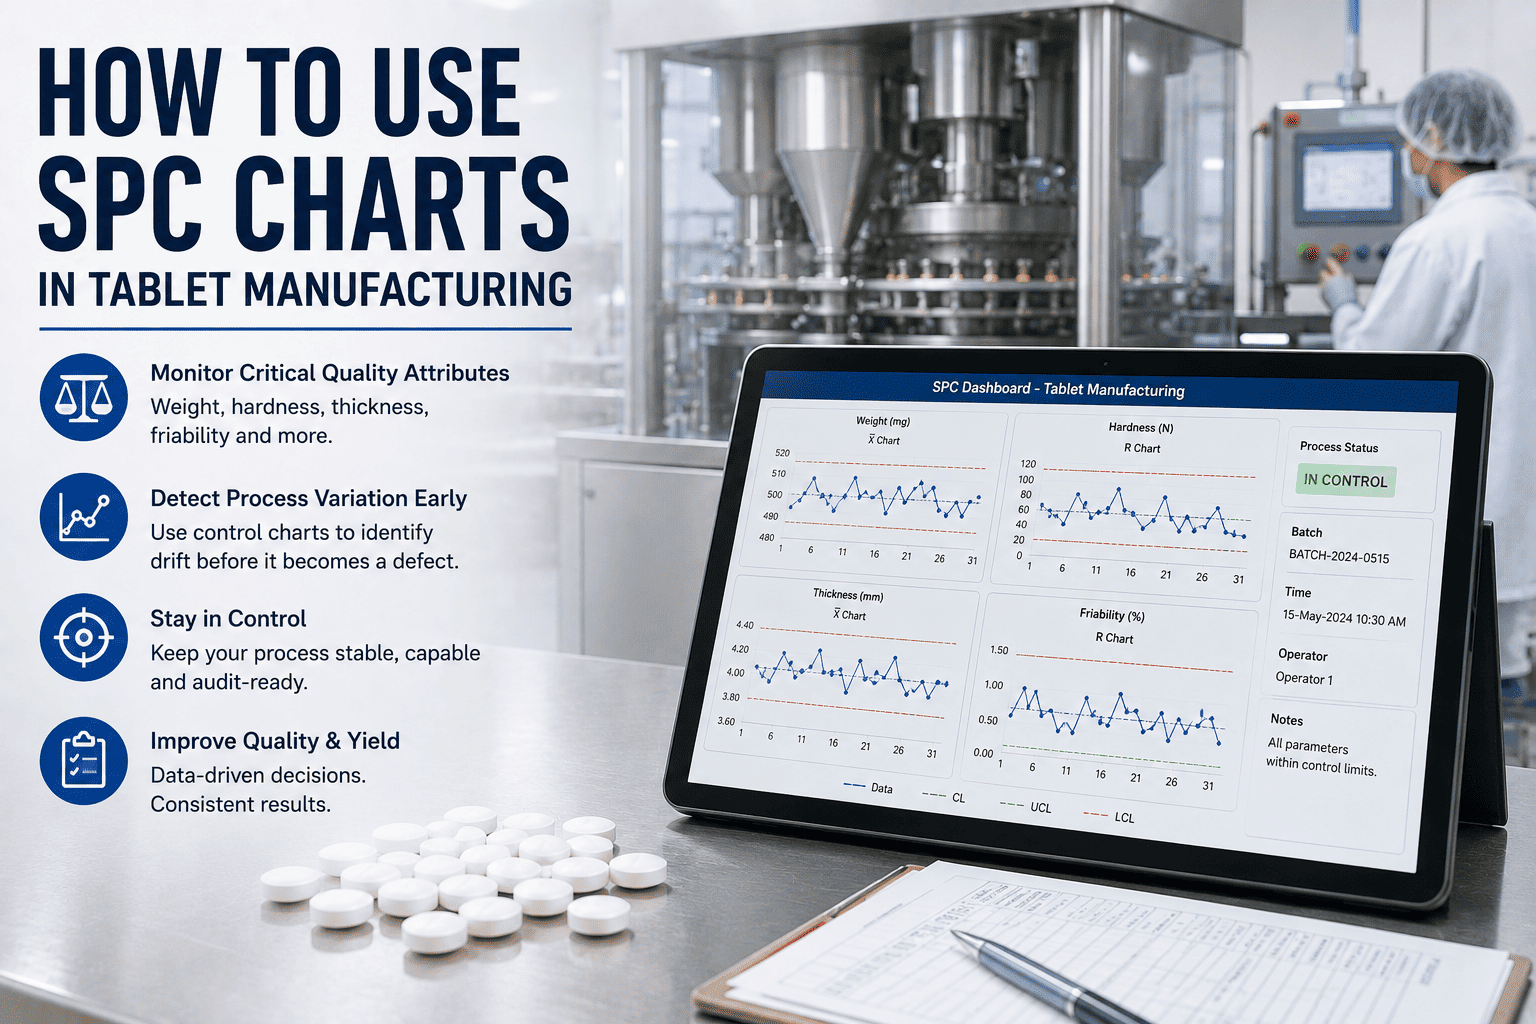
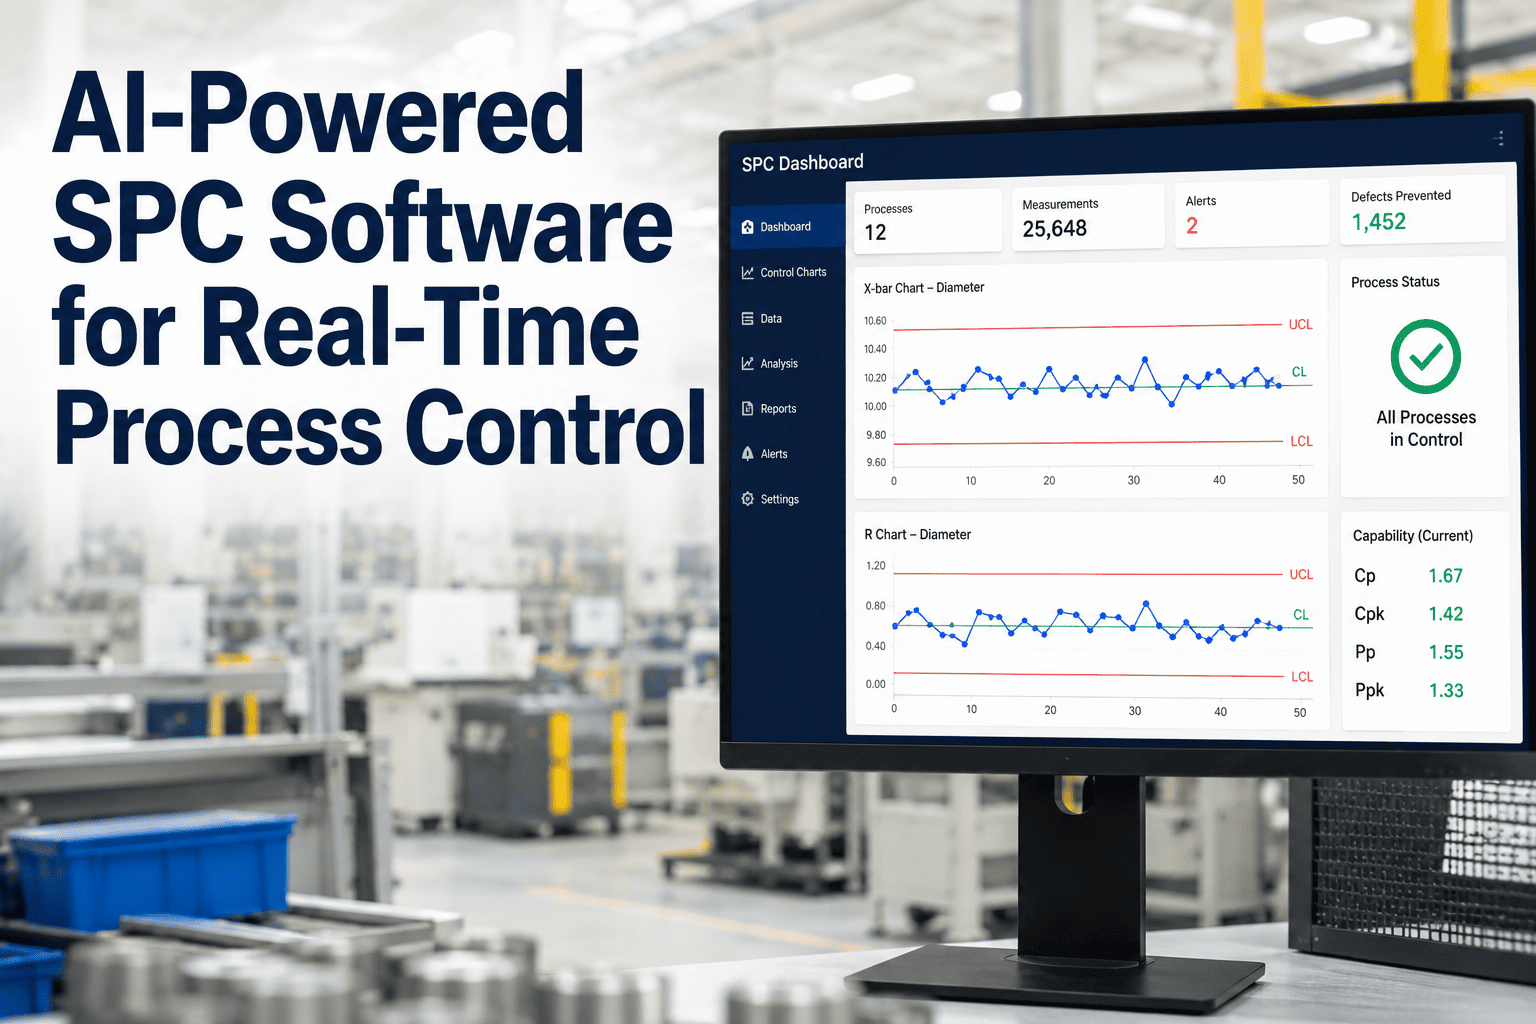
Control charts are the most direct tool the industry has for separating common-cause variation from special-cause events. X̄–R for subgrouped samples, Individuals for single measurements, p-charts for defect rates, u-charts for defects per unit. They are early-warning systems for drift, defects, and the downtime that eats OEE. But charts alone do not reduce defects — consistent responses do. In most plants the signal is accurate and the response is not: alerts land in a historian export or a PDF, nobody owns them, and by the time an engineer reviews the excursion the batch has shipped. The statistics were never the weak link.
Where the Signal-to-Action Gap Opens
Plants with accurate charts still respond slowly or inconsistently, and it is almost always for one of four reasons. Each is fixable once you can see it.
Buried signals
Violations sit in historian exports and PDF reports and never become an assigned task with an owner and a due time.
No clear guidance
Operators must decide whether to act without an agreed playbook, so two shifts respond to the same rule violation in two different ways.
Missing context
Engineers see the historical excursion but cannot quickly connect the spike to a specific batch, recipe change, or operator step.
Broken feedback
Actions are never tracked back to the originating signal, so closed-loop learning — did the fix actually work? — is lost entirely.
What Good SPC Practice Actually Looks Like
Good practice is not more charts. It is measurement discipline, the right chart for the data, agreed run rules, and capability read in context — a Cpk above 1.33 is a common practical target, but product risk and batch variation change what is acceptable.
Escalation Rules
Define what each violation means and who owns it. One point beyond 3σ triggers a line-stop review; two consecutive trend violations trigger engineering investigation.
Discipline: written playbook
Tiered Priority
Not every statistical blip deserves the same response. Combine capability, product criticality, and process context to rank what gets attention first.
Discipline: risk-weighted
Tracked Work
Signals become traceable work items with an owner, a due time, and closure evidence — photos, measurement retests, corrective actions.
Discipline: owned and dated
Genealogy Linkage
Each chart point links to batch ID, machine, operator, recipe, and upstream trace points, so root cause analysis starts with rich context.
Discipline: full context
Overlay Approach vs Rip-and-Replace
Most plants cannot pause production to swap an MES or QMS, and they should not have to in order to make SPC actionable. An overlay sits on top of existing MES, QMS, historian, Excel, and paper workflows and supplies only the missing piece — the action layer. It complements the operator screens and paper logs teams already trust, adding escalation and accountability without forcing a full system swap. That is an honest transition path: it takes planning and signal mapping, but it does not put continuous production at risk during a cutover.
How iFactory AI Fits
iFactory AI is the overlay intelligence and action layer. It does not replace your MES, QMS, or historian — it reads them, applies the rules, and routes the result to a person. Four capabilities do the heavy lifting:
Rule Detection
Overlay Layer
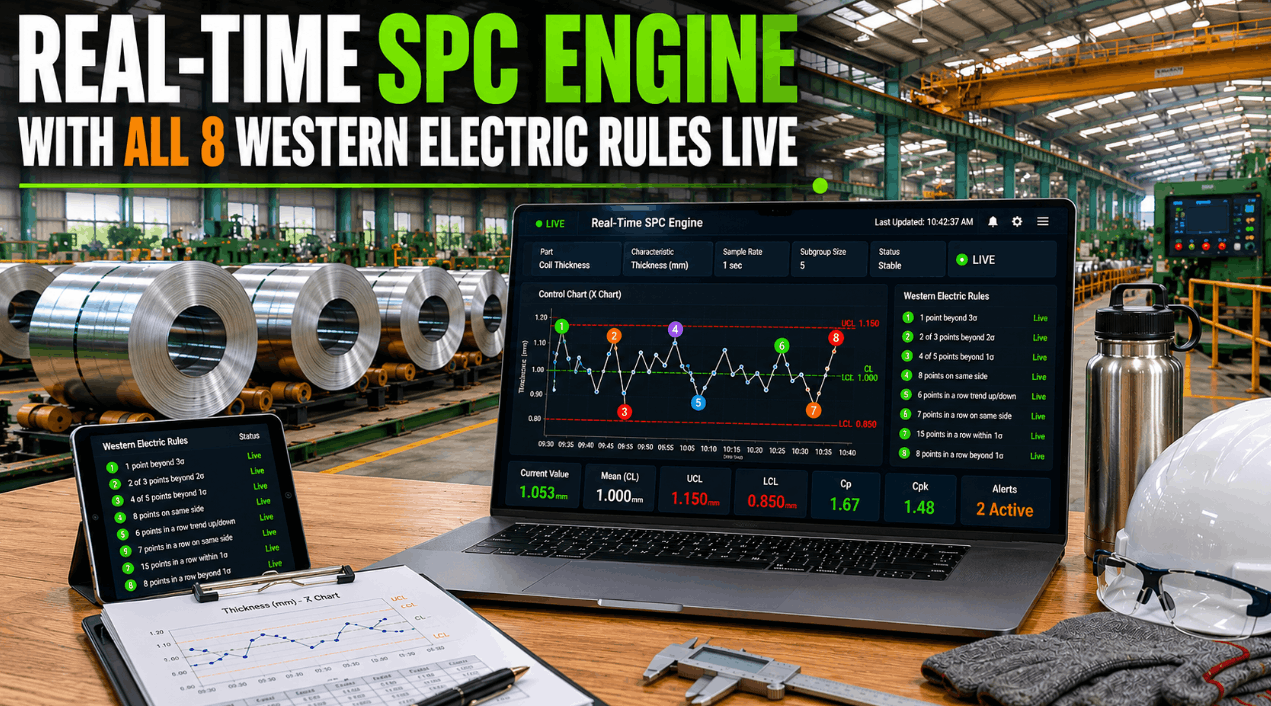
Detects Western Electric and Nelson rule violations in streaming data and triages them, separating background noise from signals that deserve attention now.
Contextual Queues
Action Layer
A detected violation becomes a prioritized work item routed to the right role — operator, quality, or maintenance — with the control-chart snapshot attached.
Genealogy Context
Trace Model
Every alert carries batch, lot, machine, recipe, and operator, so the responder starts troubleshooting with the right history instead of hunting for it.
Closed-Loop Record
Overlay Layer
Actions, corrective steps, and verification measurements are recorded against the originating signal so engineers can measure whether the fix held.
Run this check on your own line this week. Take the last rule violation your charts flagged and ask three questions: who was assigned, how long until they acted, and what evidence proves the process came back into control. If any of the three has no answer, the gap is in the response, not the statistics. Book a demo and bring one real excursion — we’ll walk it to a closed work card.
An Illustrative Signal — Nelson Rule at 02:14
At 02:14, an Individuals chart on a filling line shows three consecutive rising points, a Nelson rule violation. iFactory AI detects the run, checks genealogy for the batch number, nozzle set, and operator, and creates a priority action assigned to the line tech with suggested checks — nozzle alignment and filler pressure. The tech logs a nozzle clean and retests. The subsequent chart shows the trend reversing, and the verification measurement is recorded against the original signal. This is an illustrative example of how a signal can become an action and then a documented closure. It is not a universal promise of outcome; results depend on your sensor coverage and process.
Six Steps to Make SPC Actionable
A working program follows a predictable sequence. The first three steps are where most implementations succeed or quietly fail.
Step 1
Pick Critical Characteristics
Start with the few processes that most affect quality or OEE, and instrument them for reliable, trustworthy data before widening scope.
Step 2
Standardize Measurement
Fix gage calibration, sampling frequency, subgroup size, and data sources so charts reflect the process rather than measurement noise.
Step 3
Write the Playbook
Define run rules and escalation in writing — who does what within 15 minutes, one hour, and eight hours of a violation.
Step 4
Pilot One Line
Validate the signal-to-task workflow on a single line or product family and refine thresholds before scaling anywhere else.
Step 5
Train Together
Train operators and engineers in the same room on interpretation and the work queue. Alerts must respect frontline judgement, not override it.
Step 6
Feed Improvement
Use the closed-loop records to update SOPs, preventive maintenance, control limits, and supplier controls on a regular cadence.
Where SPC Meets Predictive Quality and OEE
Once an overlay reliably detects and manages SPC signals, the same signal-and-action history becomes the foundation for predictive work. Each overlay adds a dimension to the same record.
Predictive Quality
Drift patterns become defect risk
Correlate short-term drift patterns with the defects that historically followed them, so preemptive checks fire before scrap accrues.
Genealogy
Which lots ran during the excursion
Chart signals are only fully useful when they map to batch and machine metadata — containment becomes targeted rather than blanket.
OEE
Quality loss shown as real production loss
Tying quality signals to OEE shows where defects, rework, and process instability are actually driving availability and performance loss.
QA / Compliance
Overrides and closures on the record
Acknowledgements, overrides, and verification steps are logged with user, time, and reason, producing a traceable accountability trail.
What This Cannot Do
Honest limits matter. An overlay cannot fix a chart built on bad measurement — if gage calibration and sampling are inconsistent, better routing of a false signal just moves the noise faster. It does not remove the need for qualified engineering judgement; the system recommends and documents, people decide. Over-alerting remains a real risk, and tiering by capability and product criticality is ongoing tuning work, not a one-time setting. Fragmented data limits the benefit too: if chart points cannot be mapped to batch and machine metadata, genealogy context will be thin until that mapping is built. These are solvable, but they are work, not switches.
FAQ
How does iFactory AI overlay our existing SPC/SQC workflows without disrupting what operators already do?
iFactory AI integrates with existing data sources — MES, historian, spreadsheets, manual logs — and surfaces alerts and prioritized work items in a lightweight action layer. Operators can keep their current screens or paper steps while the overlay injects escalation and tracking where teams want it.
Book a demo to see it running beside a live line.
Will this require replacing our current MES, QMS, or historian systems?
No. The overlay approach is intentionally non-disruptive. iFactory AI connects to your existing systems and adds prioritization, assignment, and closed-loop action tracking without forcing a rip-and-replace.
How is a control chart signal turned into an actionable task?
When configured run rules detect a violation, the overlay creates a work item with the chart snapshot, suggested troubleshooting steps, associated batch and machine genealogy, and an owner. That task appears in a contextual queue for the responsible role to acknowledge and act on.
What happens if operators override or miss SPC signals? Can we see closed-loop accountability?
Yes. Overrides and acknowledgements are recorded with the user, time, and reason. Missed or unaddressed signals can be escalated automatically based on the escalation policy, creating traceable accountability and audit trails.
How does iFactory handle batch and process genealogy for traceability across quality issues?
iFactory associates each data point with batch IDs, machine IDs, operator IDs, recipe versions, and timestamps. That genealogy appears in the alert so responders and engineers can quickly see what changed around the time of the signal.
See it on your own line.
Bring One Real Excursion — We’ll Walk It to a Work Card
Thirty minutes, your chart, your rules. We take a real rule violation from your process and show it becoming a prioritized, owned, verified work item beside the MES and QMS you already run.
X̄–R, I, p, u
right chart per data
Cp / Cpk
capability in context