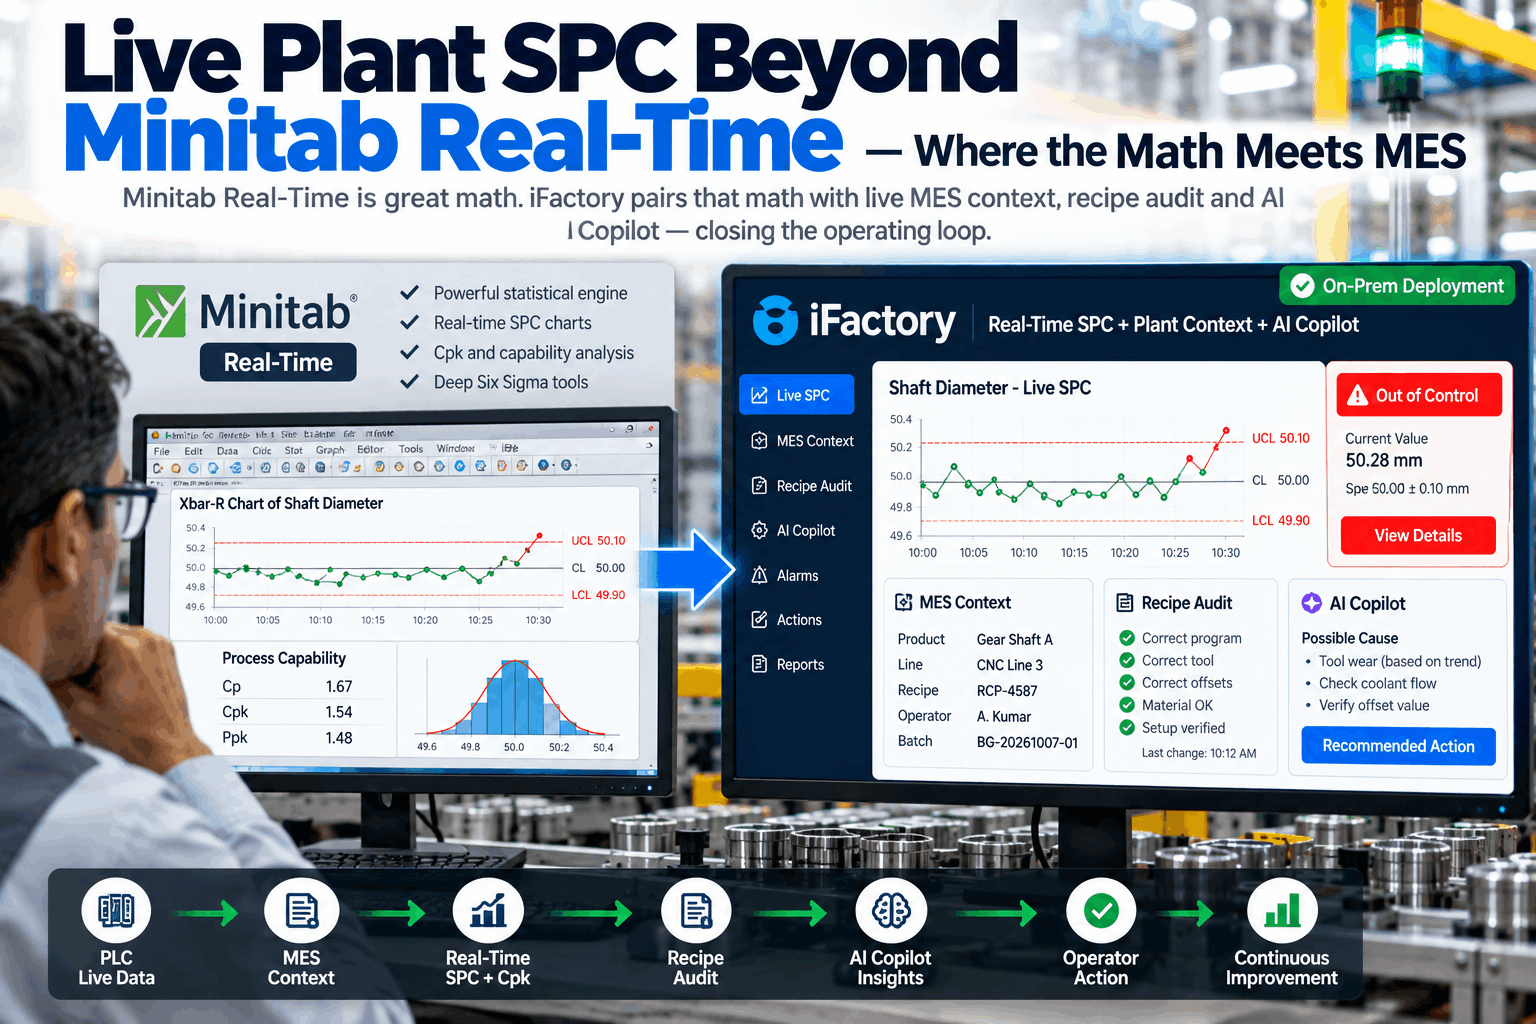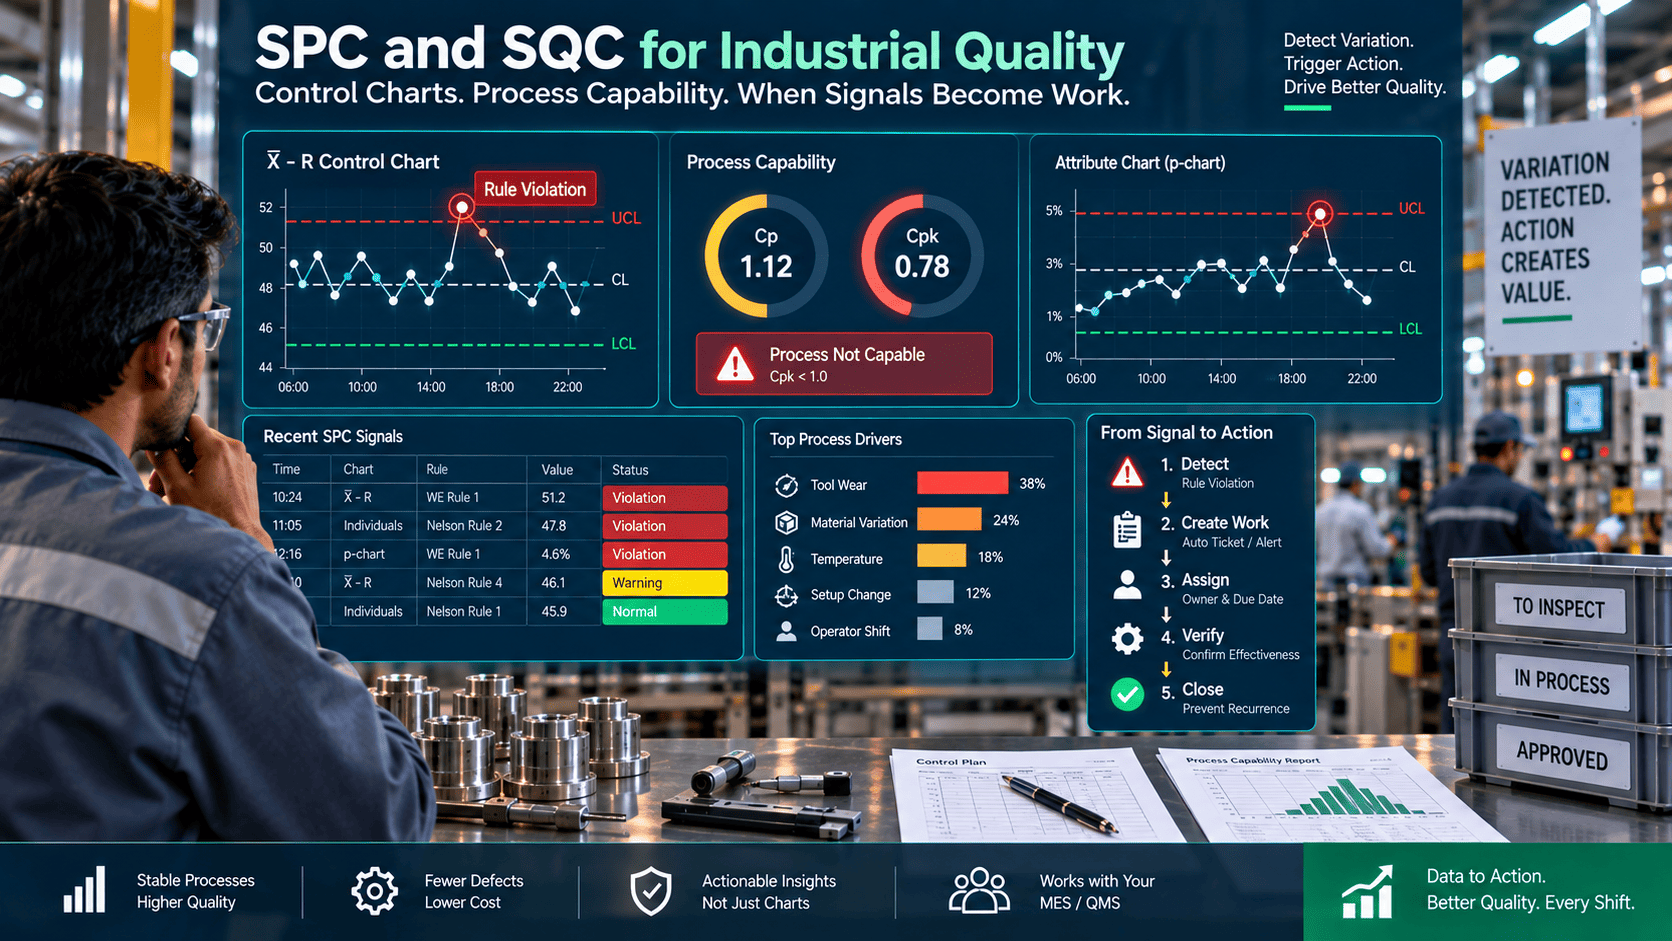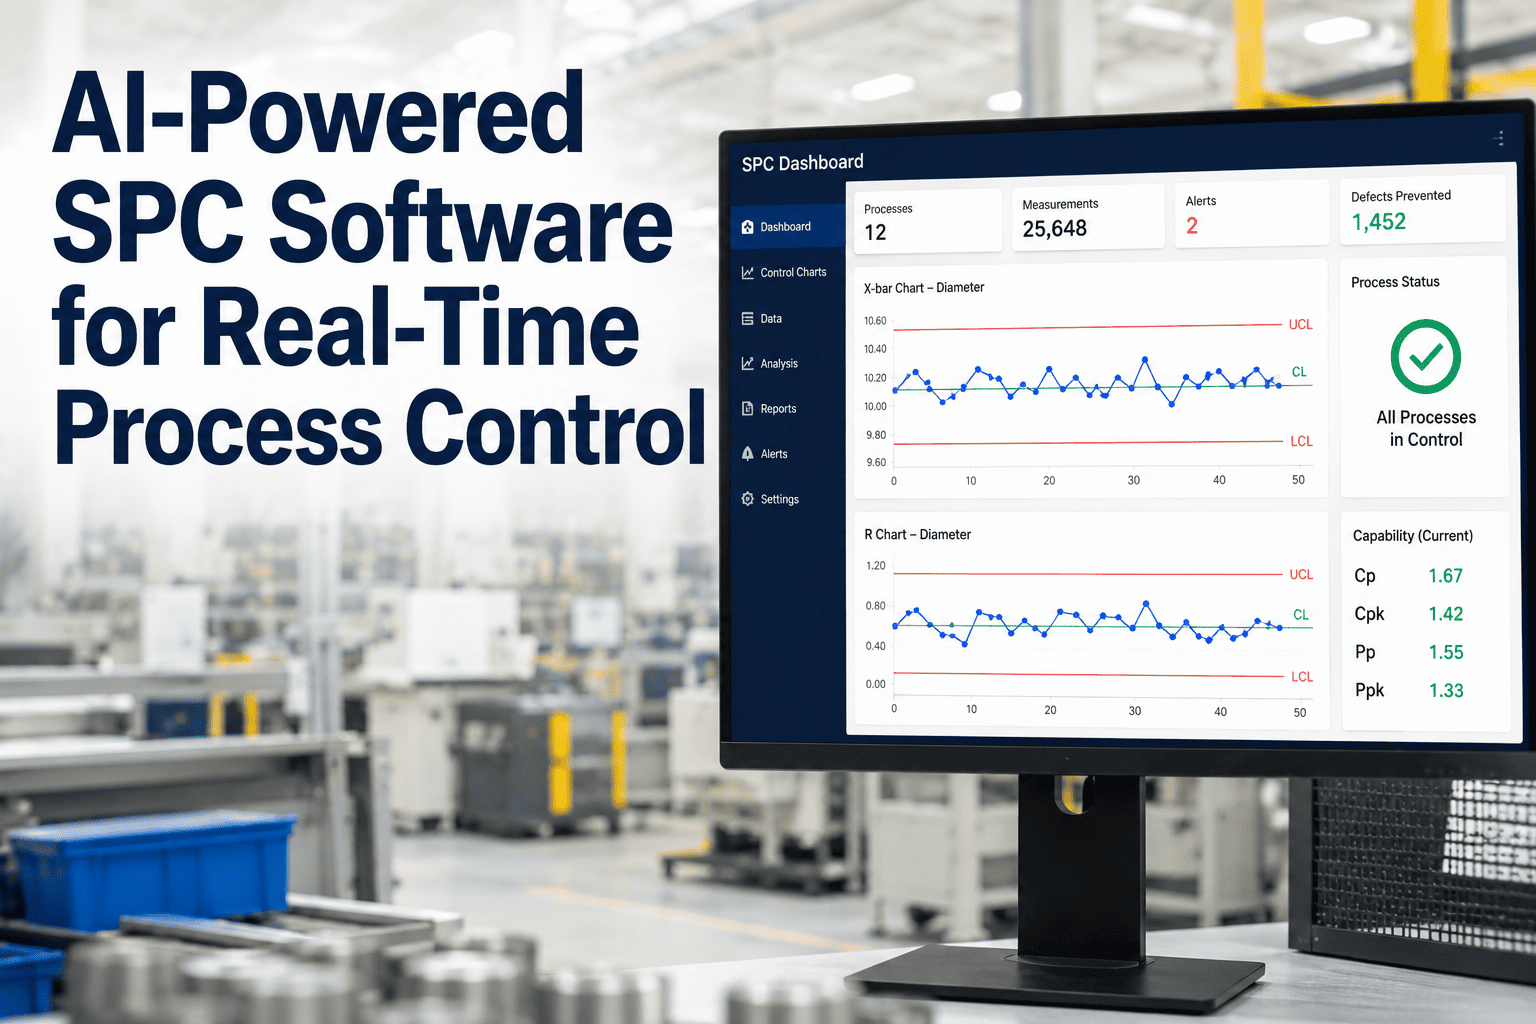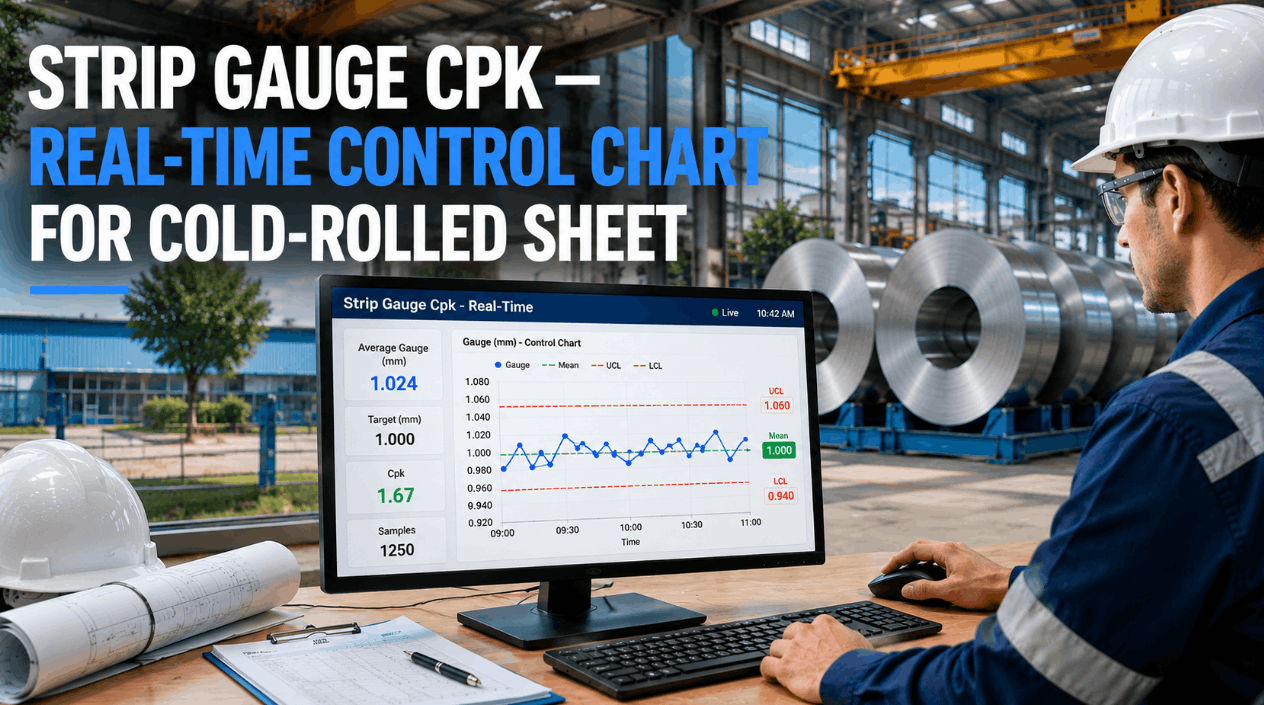
Most quality engineers know the feeling: it's Tuesday afternoon, a customer is asking about dimensional drift on last week's production run, and the answer is buried inside a Minitab project file nobody exported, sitting on a laptop that's currently on the shop floor. The data existed. The signal was there. But by the time anyone ran the weekly SPC pull, staged the charts, and circulated the report, the process had already shipped 6,000 suspect parts. iFactory's real-time SPC engine eliminates that lag entirely — running all 8 Western Electric rules continuously, every second, across every monitored parameter, so your team catches what rules-based alarms miss and acts before variation becomes nonconformance.
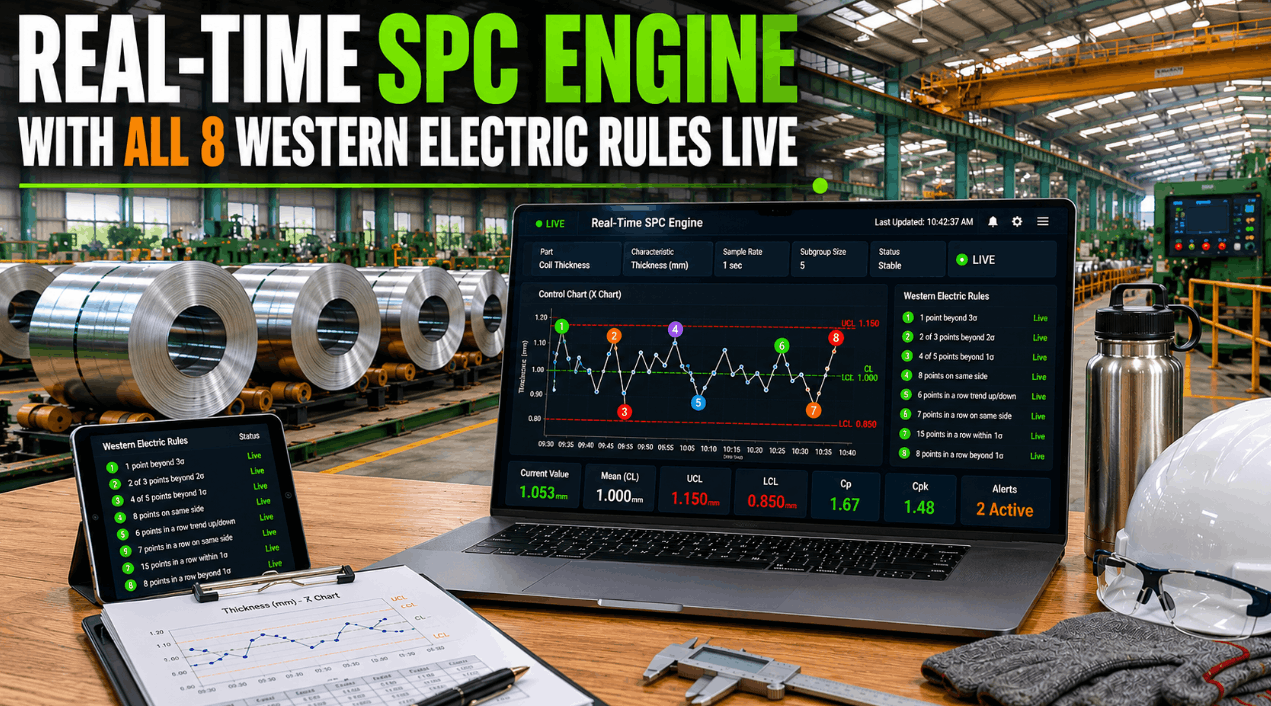
Real-Time SPC Engine With All 8 Western Electric Rules Running Live
Why Weekly SPC Reviews Are a Quality Risk
Statistical process control was never designed to be a weekly ritual. Shewhart's original intent — and the Western Electric rules that codified it — was continuous monitoring that catches assignable causes the moment they enter the process. When SPC becomes a scheduled report, you are no longer controlling a process; you are auditing its history. The gap between when a special cause enters and when your team learns about it is where escapes live.
All 8 Western Electric Rules — Running Every Second
The Western Electric rules, first published in the 1956 Statistical Quality Control Handbook, define eight criteria for detecting non-random, assignable-cause variation in control charts. iFactory's SPC engine evaluates all eight simultaneously, per parameter, per line, without requiring any analyst to queue a review. Here is what each rule catches and why it matters on a live production floor.
| Rule | Detection Criterion | What It Signals | Common Manufacturing Cause |
|---|---|---|---|
| Rule 1 | 1 point beyond ±3σ | Sudden shift or extreme outlier | Broken tool, wrong material lot, operator error |
| Rule 2 | 2 of 3 points beyond ±2σ (same side) | Process mean shifting toward control limit | Progressive tool wear, thermal drift, fixture loosening |
| Rule 3 | 4 of 5 points beyond ±1σ (same side) | Sustained process shift, less extreme | Gradual material property change, coolant degradation |
| Rule 4 | 8 consecutive points same side of centerline | Process mean displacement from target | Setup error, new operator, process step skipped |
| Rule 5 | 6 consecutive points trending up or down | Systematic drift pattern | Tool wear, bearing wear, progressive contamination |
| Rule 6 | 15 consecutive points within ±1σ | Stratification — mixed process streams | Data from multiple spindles/heads plotted as one stream |
| Rule 7 | 14 consecutive points alternating up/down | Systematic alternation between two process levels | Two alternating fixtures, A/B operator pattern, cycling feed |
| Rule 8 | 8 consecutive points beyond ±1σ, no points in zone C | Mixture — data coming from two distinct distributions | Two material suppliers, measurement system bias, multi-cavity mold |
Want to see all 8 Western Electric rules running live against your actual process data? Book a Demo and our quality engineering team will walk through a live configuration.
Live Capability Indices — Cp, Cpk, Pp, Ppk Per Parameter
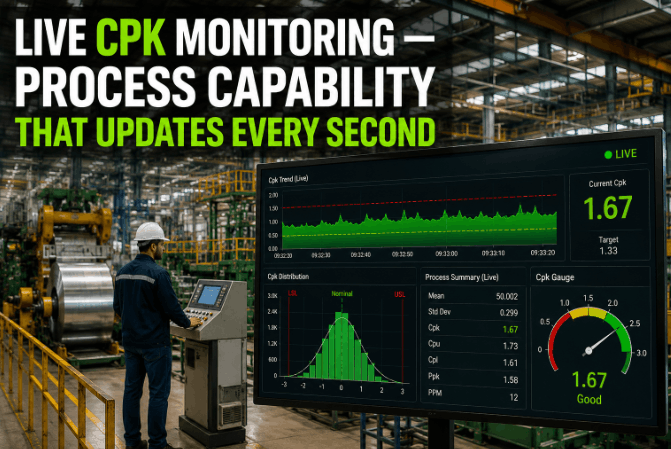
Process capability is not a monthly report — it is a live indicator of whether your process is producing to spec right now. iFactory calculates all four standard capability indices continuously, updating with each new measurement point, giving quality engineers the real-time visibility that static reporting cannot provide.
How the iFactory SPC Engine Works
The engine is not a dashboard layer bolted onto a historian — it is a purpose-built statistical computation layer that sits between your data sources and your quality team. Every measurement that enters the system is processed through the full rule-evaluation stack in under two seconds, with no batch jobs, no scheduled tasks, and no analyst required to trigger a calculation.
Real-Time SPC vs. Periodic SPC Review — Side by Side
The difference between continuous SPC monitoring and weekly manual reviews is not just speed — it is a fundamentally different quality posture. One is predictive and containment-oriented; the other is historical and reporting-oriented. The table below shows what that gap looks like in practice for a quality engineer managing a mid-volume automotive production line.
| Capability | Weekly Minitab Pull | iFactory Real-Time SPC Engine |
|---|---|---|
| Rule evaluation frequency | Once per review cycle (weekly or monthly) | Every measurement, every second |
| Western Electric rules applied | Typically 1–4 (Rule 1 default only in many tools) | All 8 rules, simultaneously, per parameter |
| Cp/Cpk/Pp/Ppk update rate | Weekly or per study run | Live, recalculated per measurement |
| Alert-to-notification time | Hours to days (next review cycle) | <2 seconds |
| Trend/drift detection | Visible only after the fact, often post-escape | Detected in real time via Rules 3–5 |
| Stratification / mixture detection | Rarely monitored, manual interpretation required | Automated via Rules 6 and 8 |
| Analyst time per cycle | 2–6 hours per week per quality engineer | Zero manual chart generation required |
| CAPA initiation | Manual, after review session | Auto-triggered on rule violation |
| Audit trail | Manual documentation required | Automatic, timestamped, IATF/ISO-ready |
Expert Perspective: What Quality Engineers Are Getting Wrong About SPC
The most common SPC failure mode we see in U.S. discrete manufacturers is not that they have no SPC program — it's that the program is designed around the convenience of the quality team rather than the speed of the process. When you run a 90-second cycle time and review SPC weekly, you are effectively monitoring 33,600 cycles with a one-week delay. At that latency, SPC is not process control — it's a forensic tool.
Conclusion: SPC Was Always Meant to Be Real-Time
Walter Shewhart designed control charts for the factory floor, not the conference room. The Western Electric rules were written to be applied continuously, not interpreted once a week in a spreadsheet review. When statistical process control is reduced to a reporting exercise, it loses the one thing that makes it valuable: the ability to catch assignable causes before they produce nonconforming parts.
iFactory's real-time SPC engine restores that original intent — all 8 Western Electric rules running every second, Cp/Cpk/Pp/Ppk live per parameter, automatic alerts, automatic CAPA initiation, and a complete audit trail that requires no manual maintenance. If your quality team is spending hours each week building charts that describe the past, Book a Demo to see what a live SPC engine looks like on your actual production data.