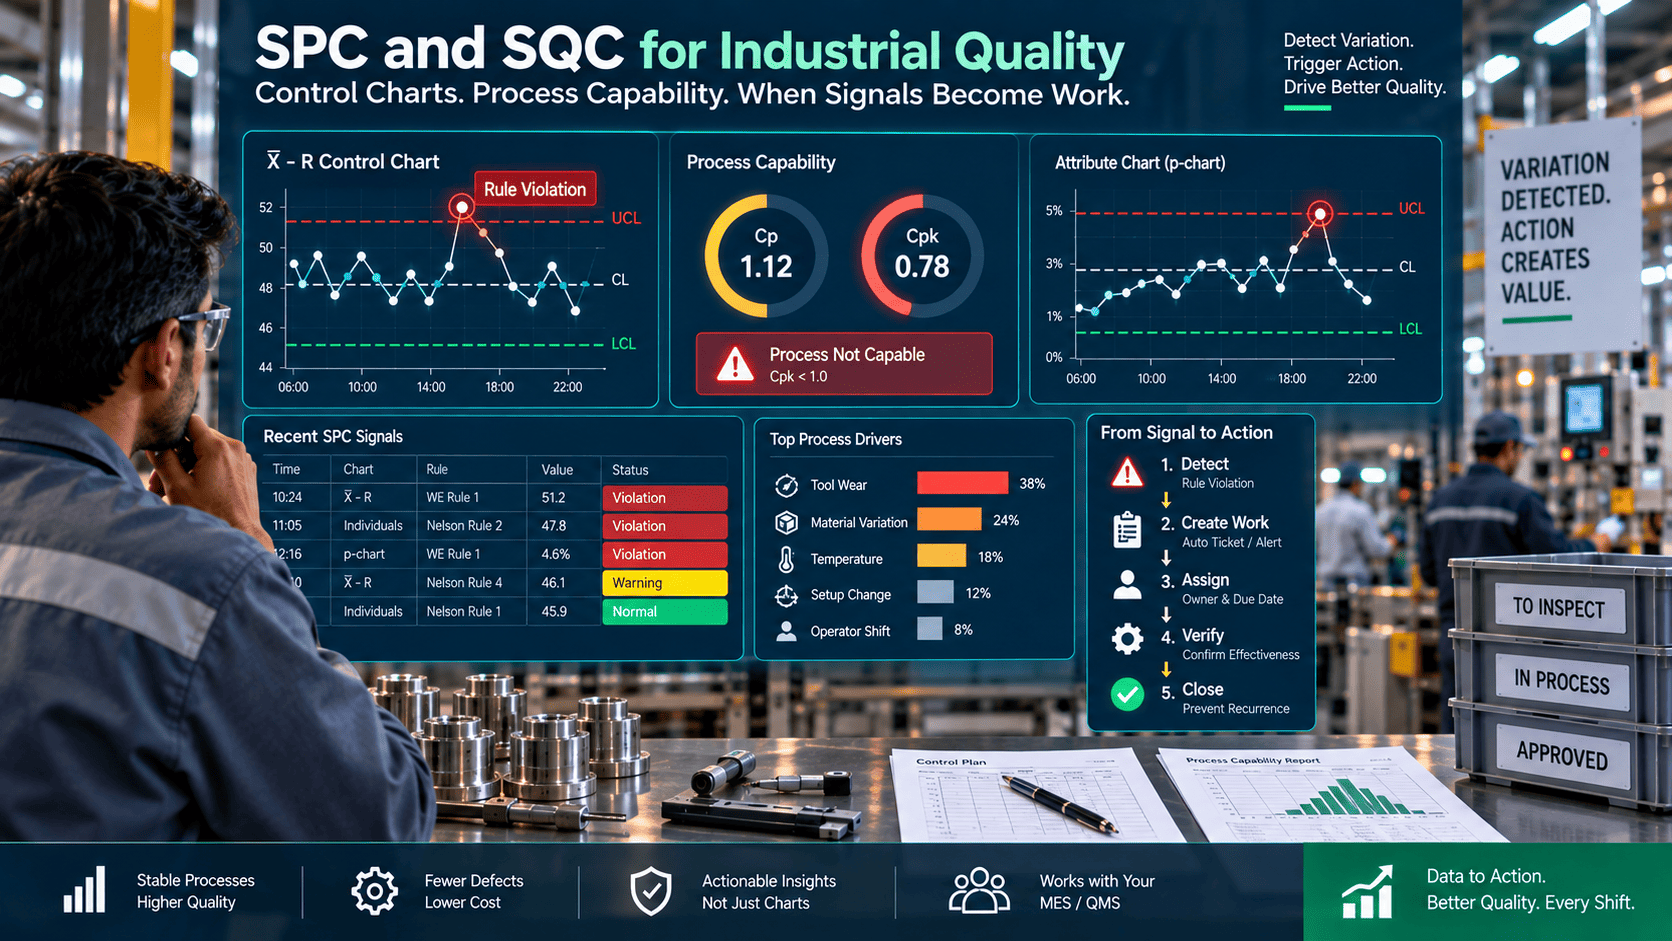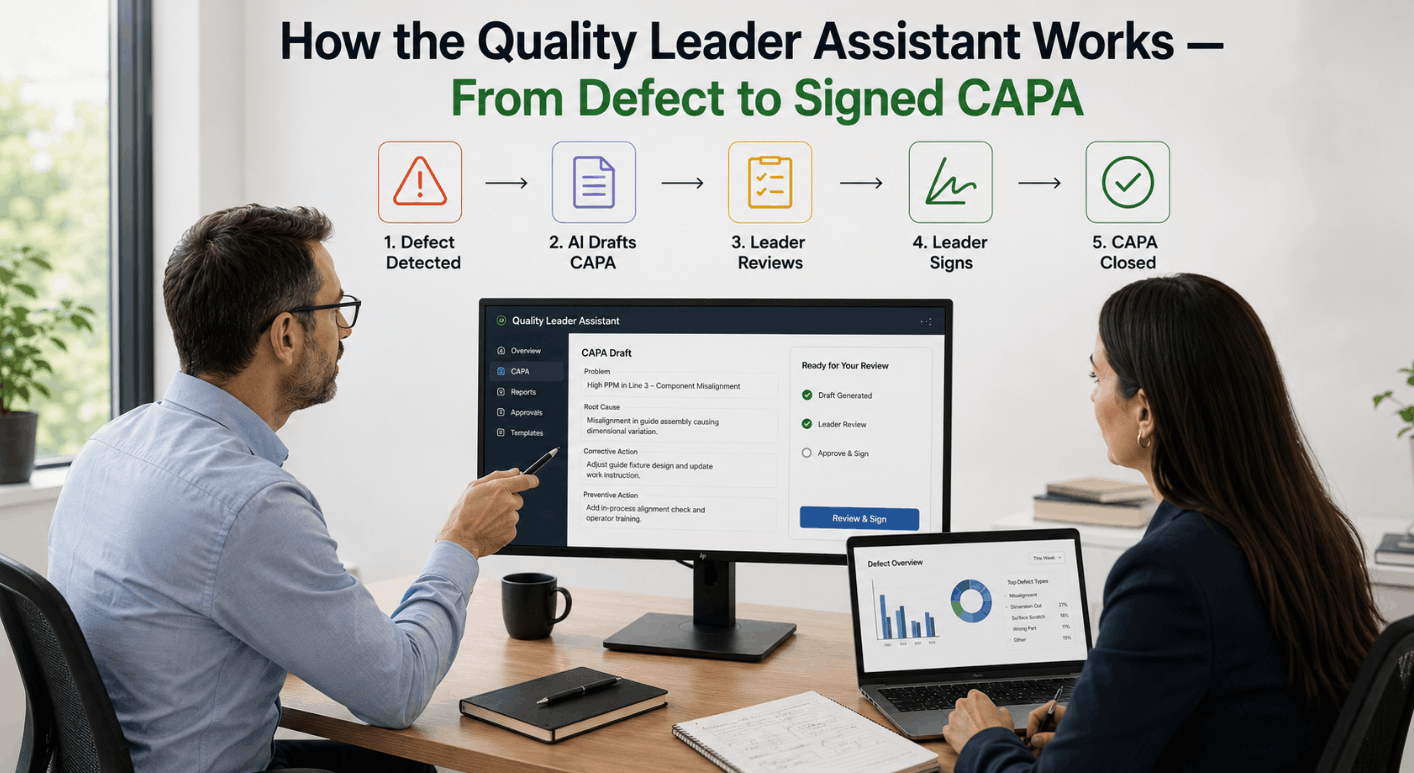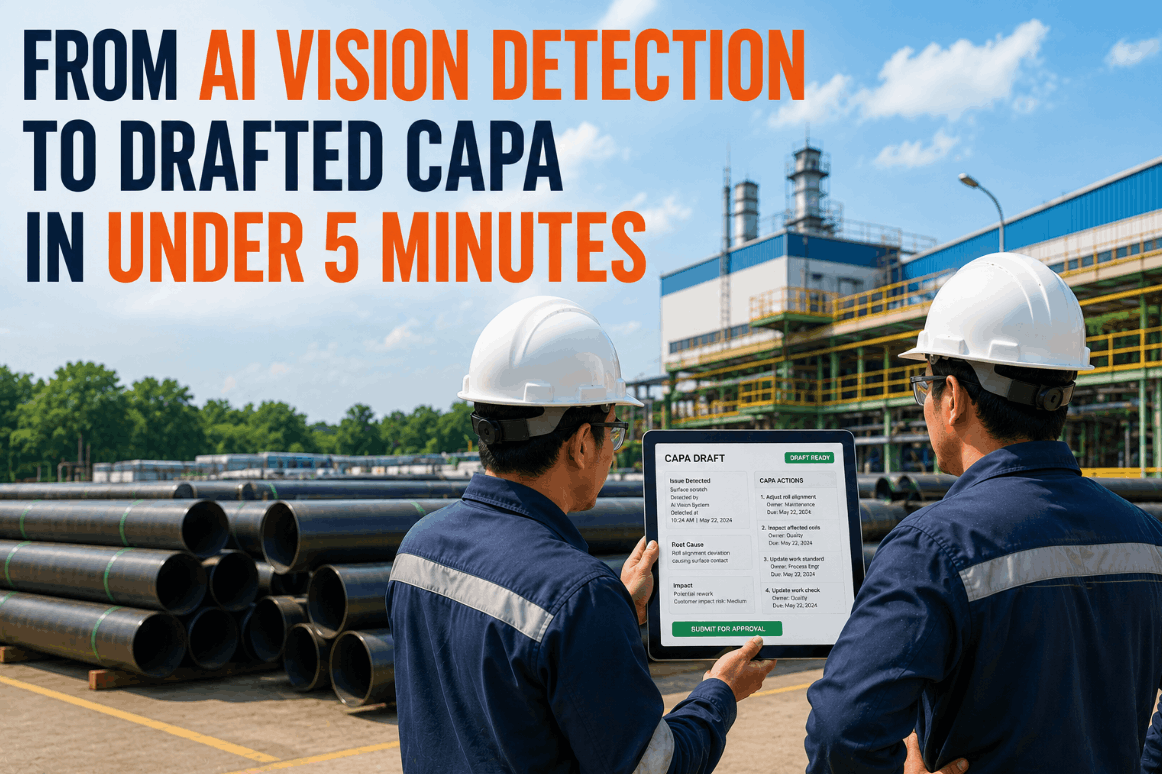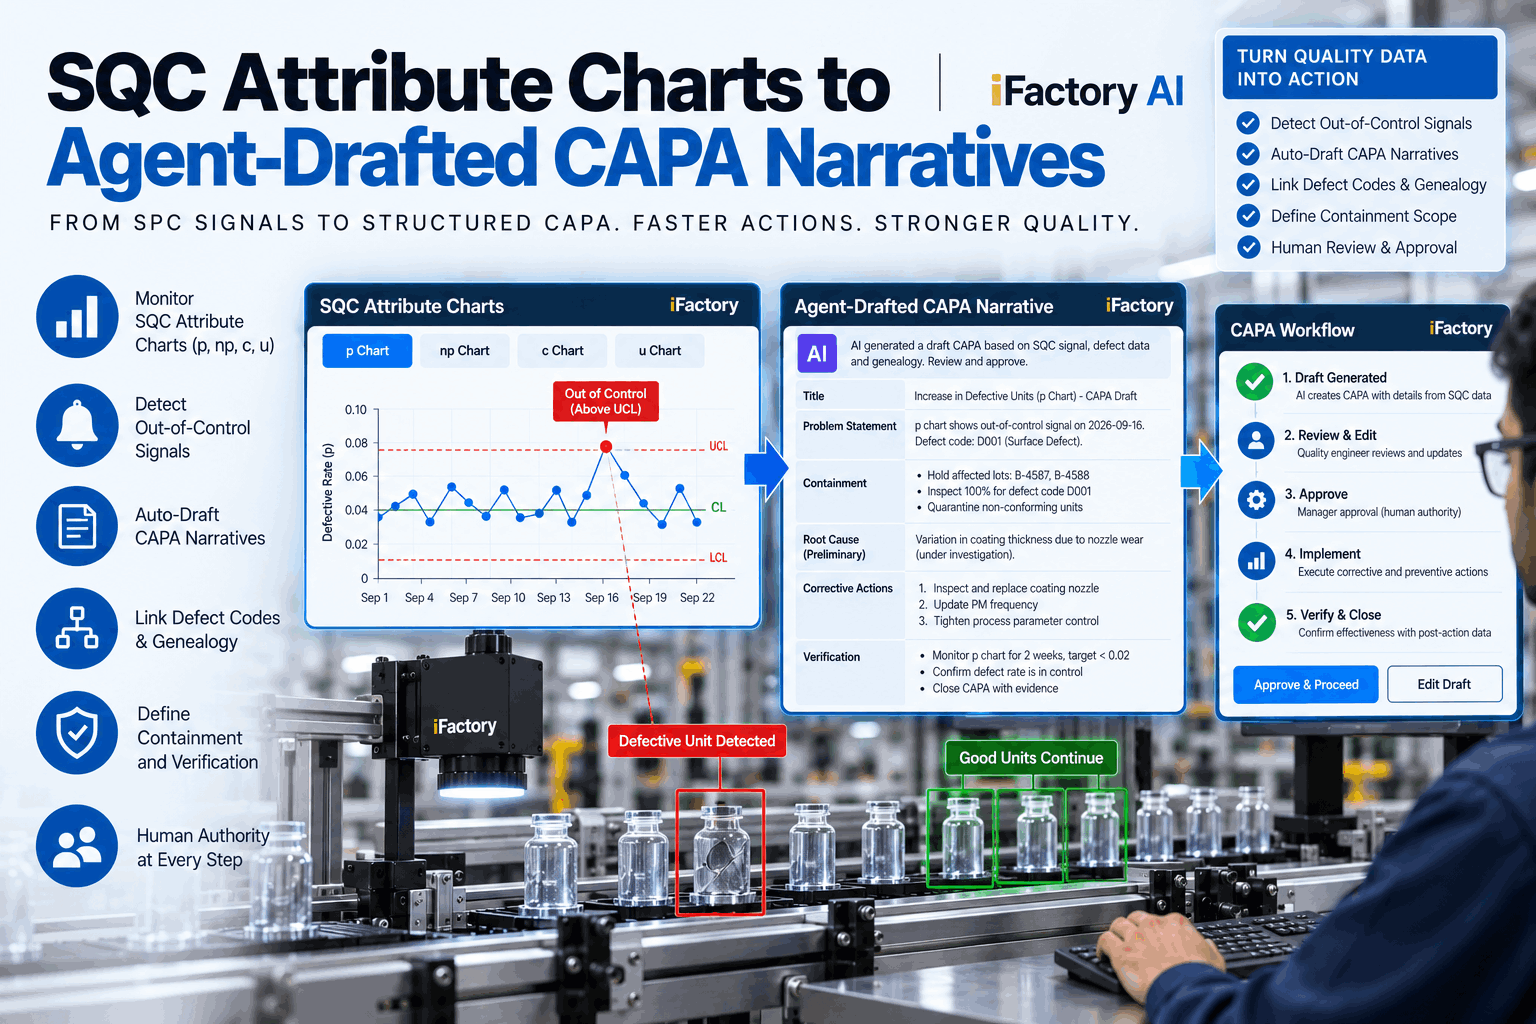
The chart tripped at 6:40 a.m., but the real problem was the delay — the defect signal sat in SPC, the lot kept moving, and the CAPA note was still being assembled when the next shift inherited the mess. SQC attribute charts feeding an agent-drafted CAPA workflow can turn that delay into a structured draft in minutes — while the quality owner still makes the hold, approval, and escalation decisions. iFactory AI overlays your MES and QMS with the drafting layer so p, np, c, and u chart signals become reviewable CAPA packets with defect codes, genealogy, and verification steps attached. See a chart signal become a CAPA draft in 30 minutes.
Turn p, np, c, and u chart signals into structured CAPA drafts with defect codes, genealogy, containment scope, and verification steps — while quality keeps hold and release authority.
At a Glance
What p, np, c, and u Charts Actually Tell Quality Teams
Attribute charts are most useful when the team needs a fast read on nonconformance patterns — not just a statistical plot on a dashboard. Each chart type serves a different purpose, and knowing which one is signaling helps the reviewer decide what kind of suspect window to investigate.
Tracks the proportion nonconforming. Best when sample size varies and defect rate is the meaningful metric.
Tracks the number of nonconforming units. Best when sample size is constant across subgroups.
Tracks the count of defects per inspection unit. Useful when a single unit can have multiple defects.
Tracks defects per unit when sample size or opportunity varies across subgroups.
In practice, these charts answer a simple question: is this process behaving like itself, or is something changing? A point beyond the control limits matters. So do runs, trends, shifts in the centerline, and unusual clustering. Those signals do not always mean special cause, but they always deserve attention.
Why Chart Alarms Often Fail to Become CAPA Action
Most plants do not struggle to see the signal. They struggle to convert the signal into a disciplined response. The typical failure mode is a chain of manual steps where evidence scatters, memory fills the gaps, and the CAPA narrative arrives half-formed.
Someone screenshots or copies it into a spreadsheet. The signal exists but has no attached genealogy or evidence trail.
Quality starts pulling defect codes by hand, checking genealogy manually, and interpreting the alarm from memory.
The suspect window expands while people debate the cause. Quarantine decisions get separated from the evidence trail.
Narrative becomes vague. Root cause and corrective action are not tied closely enough to verification for the issue to close cleanly.
This is the operational problem behind the search query. The question is not whether the chart fired. The question is how to produce an audit-ready response before the situation spreads into more lots, more rework, or more investigation time.
What an Agent-Drafted CAPA Narrative Should Include
A useful draft is not a freeform summary. It is a structured quality document built from evidence. Every statement should link back to a source so the reviewer can audit and approve with confidence.
Chart type, rule triggered, date, affected product, line, cell, sample basis.
Defect family cited from the coded set, with notes if code interpretation varies by shift or site.
Lot, material, machine, shift, operator, tooling, recipe, and downstream inspection results.
Recommended time boundary and affected genealogy branch — not just the most recent part.
Hold, quarantine review, or escalation — routed to a human decision-maker with authority preserved.
A plausible investigation path (material variation, drift, setup, tooling wear, environmental, handoff), not a final conclusion.
Post-action defect trend review, before-after chart comparison, repeat-sample check.
Draft history, reviewer identity, timestamped decisions — kept alongside the MES and QMS records.
Walk through a p-chart or u-chart signal turning into a structured narrative with genealogy, containment scope, and verification steps.
Best Practices for AI-Assisted Quality Workflows
If you want agent-drafted CAPA narratives to help instead of confuse, the workflow needs a few guardrails. The goal is faster, better-structured drafting that supports human decision-making — not autonomous compliance action.
- Event contracts — define what chart signal creates a workflow event so response is proportional to severity
- Hold authority — the platform recommends containment, but final hold decisions stay with the approved quality owner
- Human sign-off — the agent drafts, the quality team approves; separation is essential for audit readiness
- Traceable evidence — every statement links back to a source so the narrative is reviewable, not speculative
- No silent automation — no autonomous CAPA closure without human review
Frequently Asked Questions
The chart type helps define how the signal should be interpreted and what kind of suspect window to investigate. Proportion, count of units, count of defects, and defects per unit each answer a different question.
Yes. AI organizes the signal, defect codes, genealogy, and verification plan into a structured draft. The quality owner still approves containment, hold, and final CAPA actions.
Chart type, triggering rule, defect codes, affected lots or orders, genealogy links, machine or line context, shift details, containment scope, and verification plan.
Attribute charts identify the suspect timing and pattern. Genealogy shows which materials, lots, machines, or downstream branches were affected — defining the quarantine review scope.
It preserves evidence links, timestamps, draft history, and approval traceability while leaving the underlying MES and QMS record intact.
The best quality systems do not just detect variation. They move from signal to hold, from hold to CAPA draft, from draft to verification, and from verification back to a stable genealogy record.