A spec check can only ever tell you something after it has already happened. A tablet is weighed, it either falls inside the weight specification or it doesn't, and if it doesn't, you have already pressed a run of tablets that are out of spec. That is the fundamental limit of checking against a specification: it is a verdict, not a warning. Tablet critical quality attributes — weight, hardness, thickness, friability — do not usually fail all at once; they drift, as tooling wears, powder flow changes, or compression force wanders. Statistical process control watches the process itself and catches that drift while the tablets are still good. Set up SPC correctly and you stop reacting to bad tablets and start preventing them.
Statistical Process Control for Tablet Operations
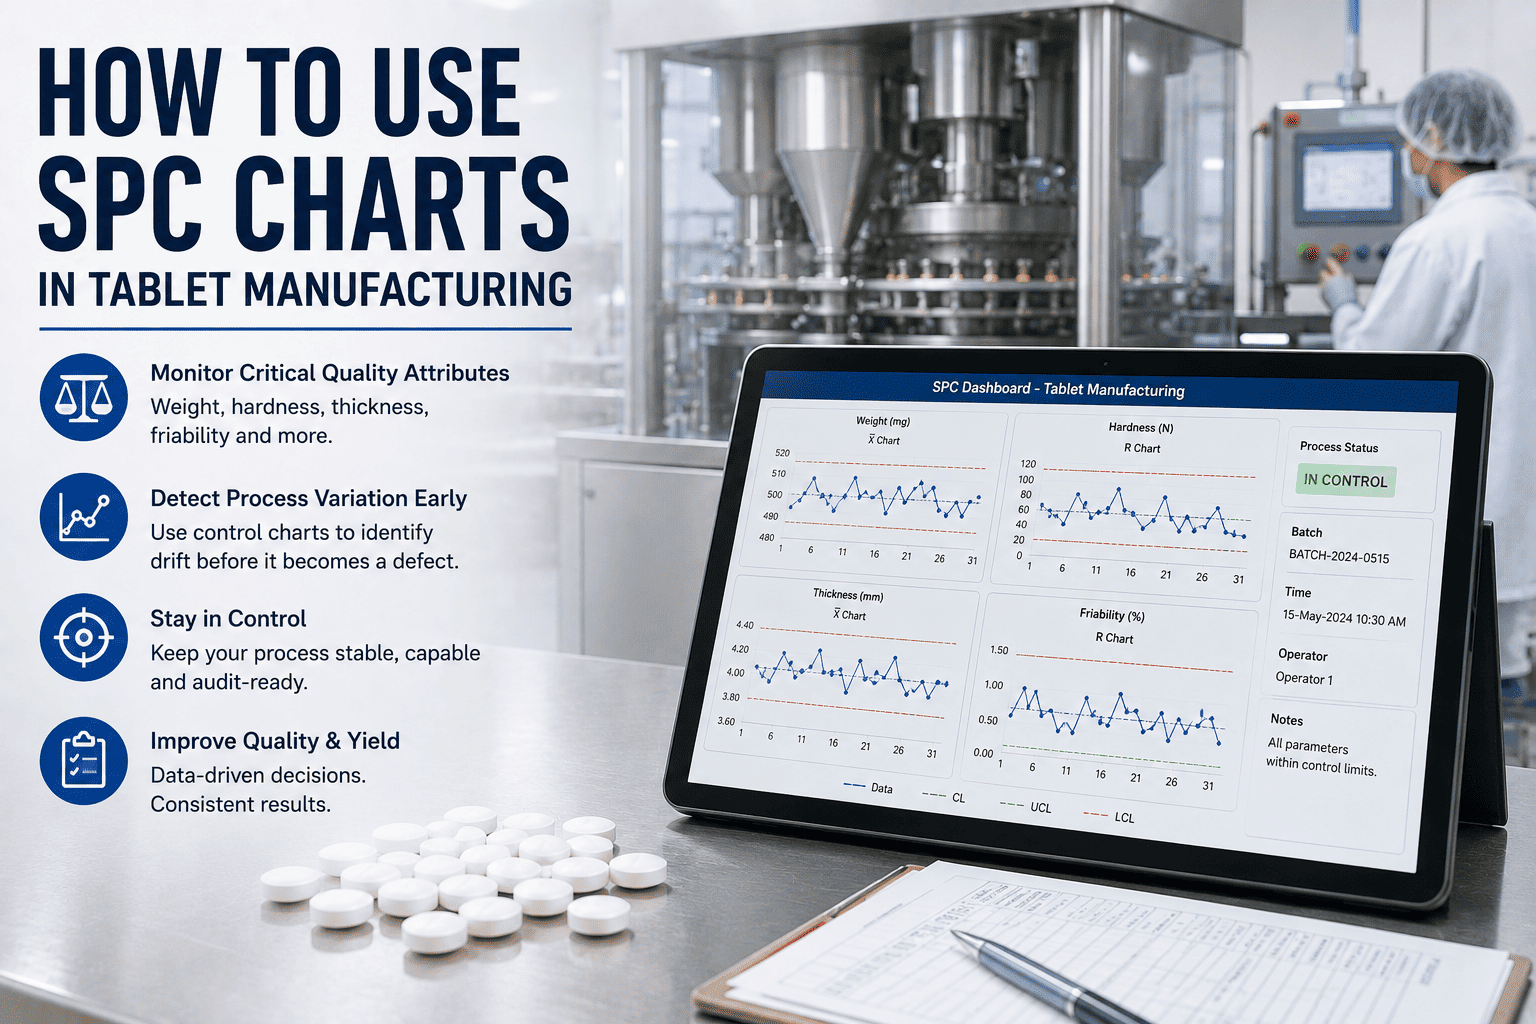
How to Use SPC Charts in Tablet Manufacturing
Weight, hardness, thickness, and friability need SPC, not just spec checks. Learn how to build control charts that read the voice of the process — catching drift and tooling wear before a single tablet goes out of spec.
The trouble with running purely to specification is that the specification is a cliff edge. Everything is fine, fine, fine — and then a tablet is out, and so are the hundreds pressed alongside it while nobody was watching the trend. Compression is a drifting process by nature: punches and dies wear, granule properties shift batch to batch, feed frames and force controllers move. A pass or fail against spec cannot see any of that coming. It can only confirm the damage once it is done, which in a tablet press is measured in thousands of units a minute.
Control Limits Are Not Spec Limits
This is the single most important idea in SPC, and the one most often gotten wrong. Specification limits come from the product requirement — the voice of the customer. Control limits come from the process's own natural variation, set at three standard deviations either side of its mean — the voice of the process. They are different lines answering different questions, and the whole power of a control chart is that the control limits sit inside the spec, so the chart signals a change long before the spec is threatened.
Drift caught by the control chart, long before the spec check would see it
The control limits are the process; the spec limits are the requirement. The chart trips at the upper control limit while every tablet is still in spec — the whole run between those two points is what SPC saves you.
The Patterns That Signal Drift
A control chart does far more than flag a point outside the limits. A set of run rules reads the patterns that reveal a process changing while every point is still within the limits — which is exactly how drift is caught early. These are the ones that matter most on a tablet press.
Point beyond 3σ
One point outside the limits — a clear special cause to investigate now.
Eight points on one side of the mean — the process centre has moved.
2 of 3 beyond 2σ
Two of three points in the outer zone — an early, statistically strong warning.
The CQAs to Chart on a Tablet Press
Four attributes carry most of the compression story, and each drifts for its own reasons. Charting them individually tells you not just that something moved, but what to go and check.
Weight
Driven by fill depth, feed frame, turret speed, and powder flow. The most sensitive early indicator of a feed or flow change.
Hardness
Driven by compression and pre-compression force and dwell time. A drift often points straight at the force setting or the granule.
Thickness
Driven by fill and force together. Moves with weight and hardness, and helps separate a fill problem from a force problem.
Friability
Driven by bonding and hardness. Tends to be tested less often, so trending it protects against a quiet loss of tablet integrity.
On a multi-station turret, chart station to station as well. A single worn punch or die shows up as one station drifting away from the rest — invisible in the batch average, obvious on a station chart.
In Control Is Not the Same as Capable
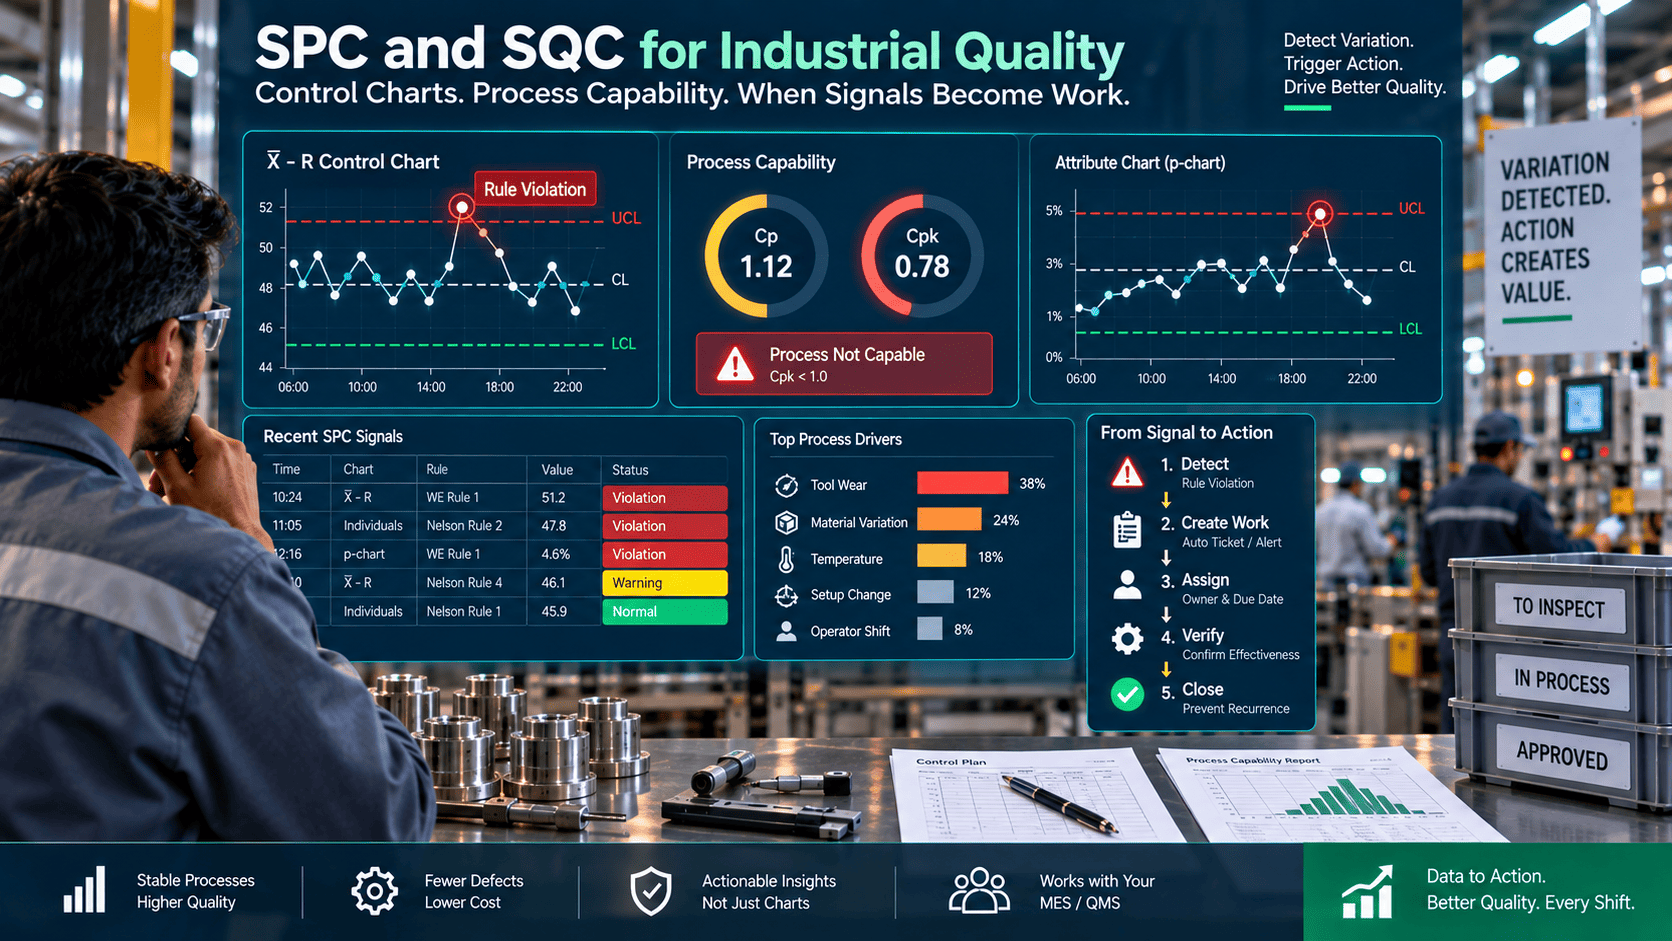
Two ideas often get merged, and keeping them apart is what makes SPC actionable. A process can be perfectly stable and still make out-of-spec tablets; it can also be capable but wildly unpredictable. You are aiming for both.
In control
Stable and predictable — only natural variation, no run-rule signals. The process is behaving consistently, whatever level that is.
Capable
The stable process fits inside the spec with margin, measured by Cpk. It is consistently making good tablets, not just consistently behaving.
Get in control first, because capability only means something for a stable process. Then confirm it is capable — and if it is stable but not capable, that is a process or design problem, not something to adjust your way out of tablet by tablet.
Setting Up SPC That Actually Catches Drift
A control chart that catches drift is built deliberately. Follow these steps and the chart works as intended; skip them and it becomes a spec check with extra lines.
1
Chart the right CQAs
Weight, hardness, thickness, and friability — the attributes the press actually drives.
2
Set limits from the process
Control limits at ±3σ from the process's own data — never the spec limits.
3
Use rational subgroups
Sample a small group across the turret at set intervals to capture the real variation.
4
Pick the right chart
X-bar and R for subgrouped variables; individuals and moving range for single readings.
5
Apply the run rules
Watch for trends and shifts, not only points beyond 3σ — that is how drift is caught.
6
Confirm capability
Once in control, check Cpk to be sure the stable process fits the spec with margin.
7
Act on signals, don't tamper
Respond to a real signal; adjusting to normal noise only adds variation.
Are your press charts drawn with control limits, or just the spec lines relabelled? Book a 30-minute demo and we'll build live SPC on your compression data.
What SPC Delivers on the Press
Reading the voice of the process instead of waiting for the spec verdict changes what your operators can do about a drifting run.
Caught
In spec
drift flagged before a tablet fails
Less
Scrap and rework
fewer out-of-spec runs pressed
Found
Tooling wear early
station charts expose a single bad punch
Stable
And capable
a process you can trust and prove
Frequently Asked Questions
Why not just put the spec limits on the chart?
Because they answer a different question and defeat the purpose. Spec limits tell you whether a tablet is acceptable; control limits tell you whether the process has changed. A chart drawn with spec limits will only alarm once you are already out of spec — exactly the late warning SPC exists to avoid. Control limits, set from the process's own variation, sit inside the spec and trip on a change while the tablets are still good. Keeping the two separate is what makes the chart predictive rather than confirmatory.
Does SPC replace our in-process and release testing?
No. You still test against specification and release to your GMP requirements; SPC sits alongside that, watching the process so you rarely reach a spec failure in the first place. Think of it as the early-warning layer on top of compliance testing rather than a substitute for it. In practice, good SPC reduces how often your spec testing ever catches a problem, because the drift was addressed upstream.
What are rational subgroups on a tablet press?
A rational subgroup is a small sample taken so that the variation within it reflects only short-term, common-cause noise, while differences between subgroups reveal real process change. On a press that usually means sampling a handful of tablets at a set interval, and often sampling across turret stations, so the chart can separate normal moment-to-moment scatter from a genuine drift or a single misbehaving station. Getting the subgrouping right is what gives the control limits their meaning.
What does it mean to tamper, and why is it bad?
Tampering is adjusting the process in response to normal, common-cause variation — nudging the fill because one subgroup came in a little high, when nothing actually changed. It feels responsible but it adds variation rather than removing it, because you are reacting to noise as if it were signal. SPC prevents this by distinguishing the two: you act when a run rule fires and you leave the process alone when the chart says it is simply behaving normally.
How do we get started?
Start with weight and hardness on one press. The best next step is a demo where we take your compression data, establish control limits from the process, apply the run rules and station-to-station view, and show where the chart would have caught a drift ahead of a spec failure. Seeing it flag a real event from your own history is the clearest proof of the difference.
Read the Process, Not Just the Verdict.
See Live SPC on Your Compression Data
Bring weight and hardness data from one press. We'll set control limits from the process, apply the run rules and a station-to-station view, and show where SPC would have caught a drift before a tablet ever went out of spec.