SPC for Stamping Dimensional Control in Automotive Plants
By David Cook on July 18, 2026
A stamped door skin, quarter panel, or floor pan does not get worse quietly. It drifts. Tool wear, blank thickness variation, lubricant temperature, ram parallelism — every one of them nudges a critical dimension a few thousandths of an inch off nominal every hour, and BIW never knows until the sub-assembly won't fit the jig. By then, dozens of panels are stacked as scrap and the press is still making more. Classical Statistical Process Control was built exactly for this problem — but only if you pick the right chart, put it on the right dimension, and react to the right signal. A properly designed SPC layer for stamping catches drift while there is still time to adjust the die instead of scrap the batch.
iFactory SPC for Stamping
SPC Charts That Catch Stamping Drift Before BIW Rejects Appear
X-bar R, I-MR and CUSUM on the panel dimensions that actually matter — with Western Electric rules, MSA-verified inputs, and die-side reaction plans that turn a signal into a corrected process, not just a red dot on a wall chart.
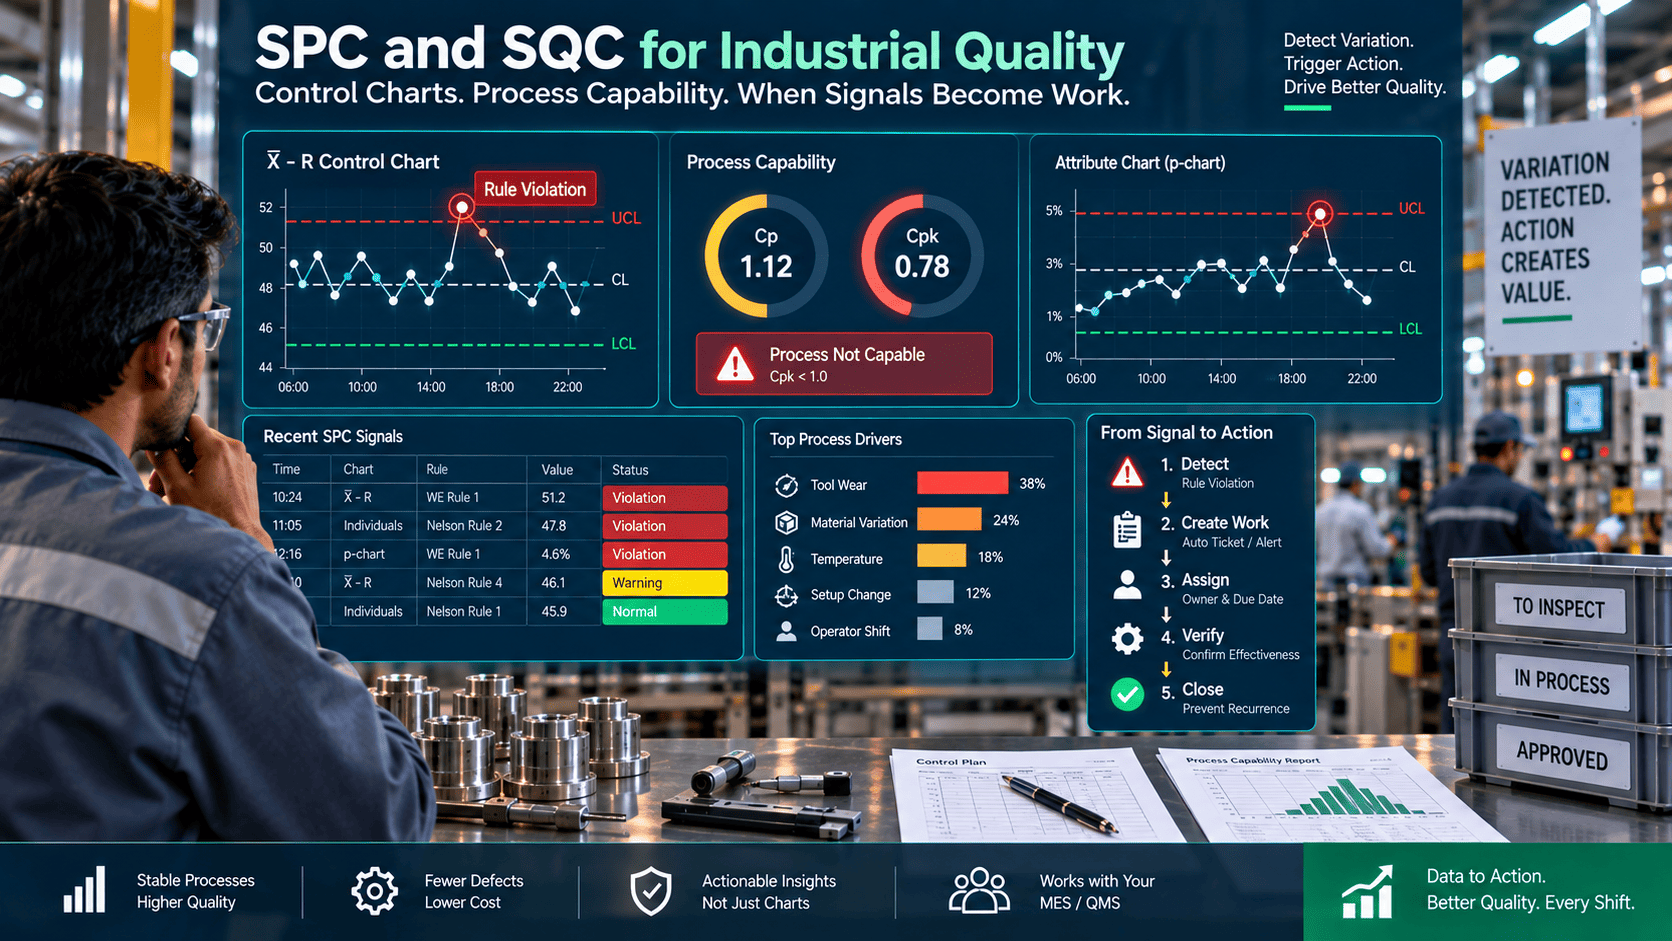
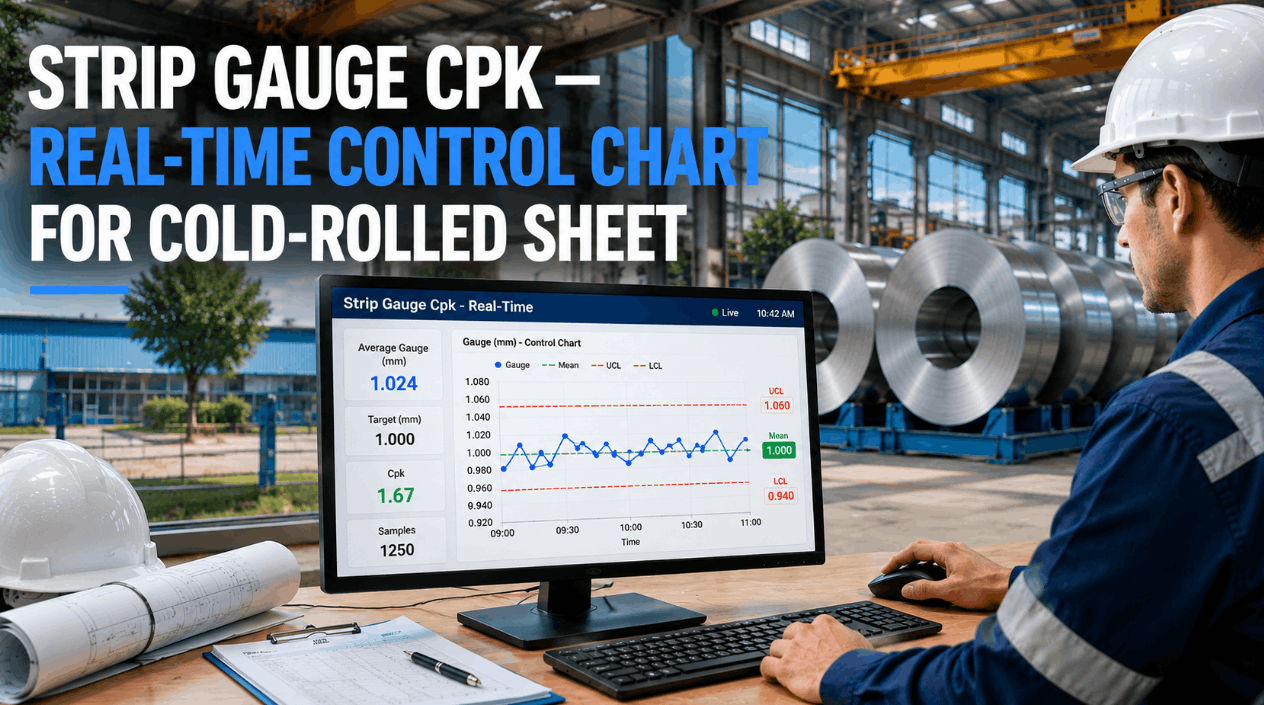
Every stamping SPC chart is really answering one question: is what I am seeing right now normal variation, or a signal that the process has changed? The chart's job is to make the answer obvious in one glance — control limits from the process itself, spec limits from the customer, and a signal the moment a point crosses either.
X-bar chart — door skin edge trim height (mm)
CL
Centerline — the process mean over the baseline period. The target the process is running to.
UCL / LCL
Control limits — three sigma from CL, calculated from the process itself. The "voice of the process".
USL / LSL
Spec limits — from the customer print. Never on the same line as control limits, never the same conversation.
Signal
Point outside UCL. Also: a run of seven trending up — the drift catch that keeps scrap out of BIW.
Three Charts, Three Jobs
No single chart handles every stamping scenario. Pick the wrong one and you either miss the drift entirely or drown in false alarms. Here is when each of the three workhorses earns its place on a stamping line.
X-bar R
Subgroup means & range
Use whenYou can pull a subgroup of 4–5 parts every 25–50 pieces at a fixed CMM or checking fixture.
WhyThe AIAG workhorse for automotive body panels. Xbar catches mean shifts, R catches consistency changes — both on one chart.
ExampleDoor skin edge-trim height sampled 5-up every 40 hits from the checking fixture.
I-MR
Individuals & moving range
Use whenMeasurements are expensive, slow, or the natural sampling interval is once per shift or per lot.
WhySubgrouping is impractical. Individual readings on a slower cadence still detect shifts — with wider limits and longer detection times than Xbar R.
ExampleFull CMM run on a hood inner every shift; blank thickness at inbound receiving.
CUSUM
Cumulative sum of deviations
Use whenSmall, gradual drift is the enemy — tool wear, temperature creep, lubricant break-in.
WhyCUSUM accumulates every deviation from target. Even a 0.5-sigma drift that Xbar R would take twenty subgroups to catch shows up in five.
ExampleFender trim slot width monitored for die-wear drift across a 20,000-hit campaign.
The Western Electric Rules That Actually Fire
A point outside a control limit is the obvious signal. It is not the only one. The Western Electric rules layer four more detection patterns on top — the ones that catch drift, shifts, and non-random behaviour before any part goes outside spec. iFactory evaluates all four continuously so operators don't have to eyeball the chart.
01
One Point Outside 3σ
Any single subgroup mean above UCL or below LCL. The classic signal — a special cause is now in the process, act immediately.
02
Two of Three Beyond 2σ (Same Side)
Two of the last three points on the same side, more than two sigma from centerline. Early warning of an emerging shift before it clears UCL.
03
Four of Five Beyond 1σ (Same Side)
Process centering has moved. Not yet outside control, but the mean is quietly walking off target — the drift signal die-set teams need.
04
Eight Points in a Row (Same Side)
A sustained bias, however small. The Xbar chart missed it as "in control"; the run rule catches the drift the die is telling you about.
Want to see these rules firing on your own panel data? Book a demo and we'll load two weeks of your CMM output into a live chart during the call.
Which Dimensions Belong on the Chart
SPC on every dimension is not diligence — it's noise. Operators tune out when they have twenty charts. The correct list is the three-to-five critical-to-quality characteristics on each panel that drive BIW fit, sealing, or customer-visible quality. These are the ones that reward a chart.
Fit-critical
Edge Trim & Hem Height
Feeds hem quality, door-to-body gap, and the visible A-surface flushness customers actually see. Prime candidate for X-bar R at high frequency.
Fit-critical
Locator Hole Position
Datum for every downstream weld fixture. A shift here cascades into the entire sub-assembly — chart with tight subgroup timing.
Sealing-critical
Flange Angle & Length
Sets sealer bead geometry and weatherstrip retention. Small drift is what CUSUM was built to find — before water-leak audits do.
Tool-wear
Draw Depth
Direct signal of punch and cushion condition. Trends upward as the die works — the run-rule signal you cannot afford to miss.
Material
Blank Thickness In
Charted at inbound not in the press, but drives everything downstream. I-MR at receiving flags coil-to-coil variation before it becomes scrap.
Splits
Wall Thickness at Radii
Thin-out at critical radii predicts splits. Tightening the SPC window here is the difference between planned die maintenance and an unplanned line-stop.
From Signal to Die Adjustment — the Reaction Plan
A chart that nobody reacts to is wallpaper. What separates SPC that changes a plant from SPC that decorates it is the reaction plan — five steps that turn every out-of-control signal into a corrected process, with the paperwork closed inside the shift.
1
Signal Fires
iFactory detects the Western Electric violation the instant the subgroup is entered — before the next panel is stamped.
2
Contain
Suspect parts back to the last known-good subgroup are quarantined. Automatic hold tag, no operator judgement required.
3
Investigate
Routed to the die-set lead with cause-code shortlist: tool wear, material lot change, press-parameter drift, or fixture shift.
4
Adjust & Verify
Die shim, cushion pressure, or feed-line correction applied. Next subgroup must land inside limits before production releases.
5
Close & Learn
Reaction logged against the panel and die, feeding tool-life model and next campaign's baseline. IATF 16949 evidence written for free.
iFactory's SPC-for-Stamping Kit
SPC on paper is a compliance exercise. SPC in a live plant needs signal capture, statistical engines, reaction routing and audit evidence stitched together. iFactory ships all four as one layer, on top of the CMM, checking-fixture and press-controller data you already have.
Multi-Chart Engine
X-bar R, I-MR, X-bar S and CUSUM in one platform. Chart selection guided by measurement cadence, not by what the operator remembers.
Western Electric Rules Live
All four run rules evaluated on every new subgroup. Violations tagged with rule number so investigators know exactly what fired.
MSA / Gage R&R Gate
No chart goes live until measurement system contribution is verified. Stops the plant from monitoring gage noise as if it were process drift.
Cp / Cpk Capability
Continuous capability calculation against customer spec. Answers the question control charts don't — "is the process capable, not just stable".
Die-Life Correlation
SPC drift correlated with hit-count and campaign history. Predicts the next tool-service window before quality has to demand it.
IATF 16949 Evidence
PPAP-ready chart output, retained records, and full traceability from CMM reading through reaction to closure. Audit prep is a filter, not a project.
What Stamping Plants Report
Outcomes stamping operators typically report within the first six months of moving from paper SPC to a live, multi-chart, rule-driven layer with die-side reaction routing.
3-5x
Faster drift detection
CUSUM + run rules catch shifts Xbar-alone misses
30-50%
Stamping scrap reduction
quarantine at the signal, not at the BIW jig
Zero
"Wallpaper" charts
every signal has a routed owner and a closure record
PPAP
Ready output
customer-approval evidence assembled continuously
Want to see the multi-chart engine on your own panels? Talk to our stamping team and we'll load two weeks of CMM data for a live walkthrough.
Frequently Asked Questions
Which chart should we start with on a stamping line — X-bar R, I-MR or CUSUM?
Start with X-bar R on the three-to-five critical-to-quality dimensions where you can pull a subgroup of 4–5 parts every 25–50 hits. It is the AIAG-recommended workhorse for automotive body panels and the chart your operators will actually maintain. Add CUSUM in parallel on the dimensions with known tool-wear drift — it will catch the small, gradual shifts X-bar R takes twenty subgroups to see. Reserve I-MR for dimensions where subgrouping is impractical, like shift-cadence CMM runs.
Why do you need control limits AND spec limits on the chart?
They answer different questions. Spec limits (USL/LSL) come from the customer print and say "is this part acceptable?" Control limits (UCL/LCL) come from the process itself and say "has this process changed?" A process can be in control (points inside UCL/LCL) but not capable (regularly outside USL/LSL) — or the other way around. Managing to spec limits alone is how plants miss drift until scrap piles up; managing to control limits alone is how they ignore whether the part actually meets the print. You need both.
How many subgroups do we need before the control limits are trustworthy?
Minimum 25 subgroups, which is roughly 125 parts at n=5. Control limits calculated from fewer than that are unstable — they will drift as more data arrives and generate false signals. Just as important: don't adjust the process during the baseline collection. You are measuring natural process variation, not testing your ability to hold it. And re-establish limits any time the process fundamentally changes: new tooling, new material lot, new operator, new die-set.
What if our measurement system is what's really varying, not the process?
This is why iFactory blocks SPC deployment until Gage R&R is verified. If the measurement system contributes more variation than the process itself, the control chart is monitoring gage noise — inflated limits, missed real signals, false alarms. The MSA gate makes sure the chart is watching what you actually care about. Any stamping SPC program without an MSA prerequisite is one bad checking-fixture away from months of misleading data.
Will this satisfy IATF 16949 and OEM PPAP requirements?
Yes. Every subgroup, signal, reaction and closure is time-stamped, attributable, and retained. The output includes the control charts, capability indices (Cp, Cpk, Pp, Ppk) and reaction records that IATF 16949 auditors and OEM PPAP submissions require. Because the evidence is captured live rather than reconstructed for audits, prep time typically collapses from weeks of manual assembly to a filter and export.
Catch it at the press, not the BIW jig.
See Your Panels' Drift Before It Becomes Scrap
In a 30-minute demo we'll walk a live stamping SPC dashboard, load two weeks of your CMM data into X-bar R, I-MR and CUSUM charts side-by-side, and show the Western Electric signals your paper charts have been missing — MSA gated, PPAP-ready, on top of the checking-fixture data you already have.