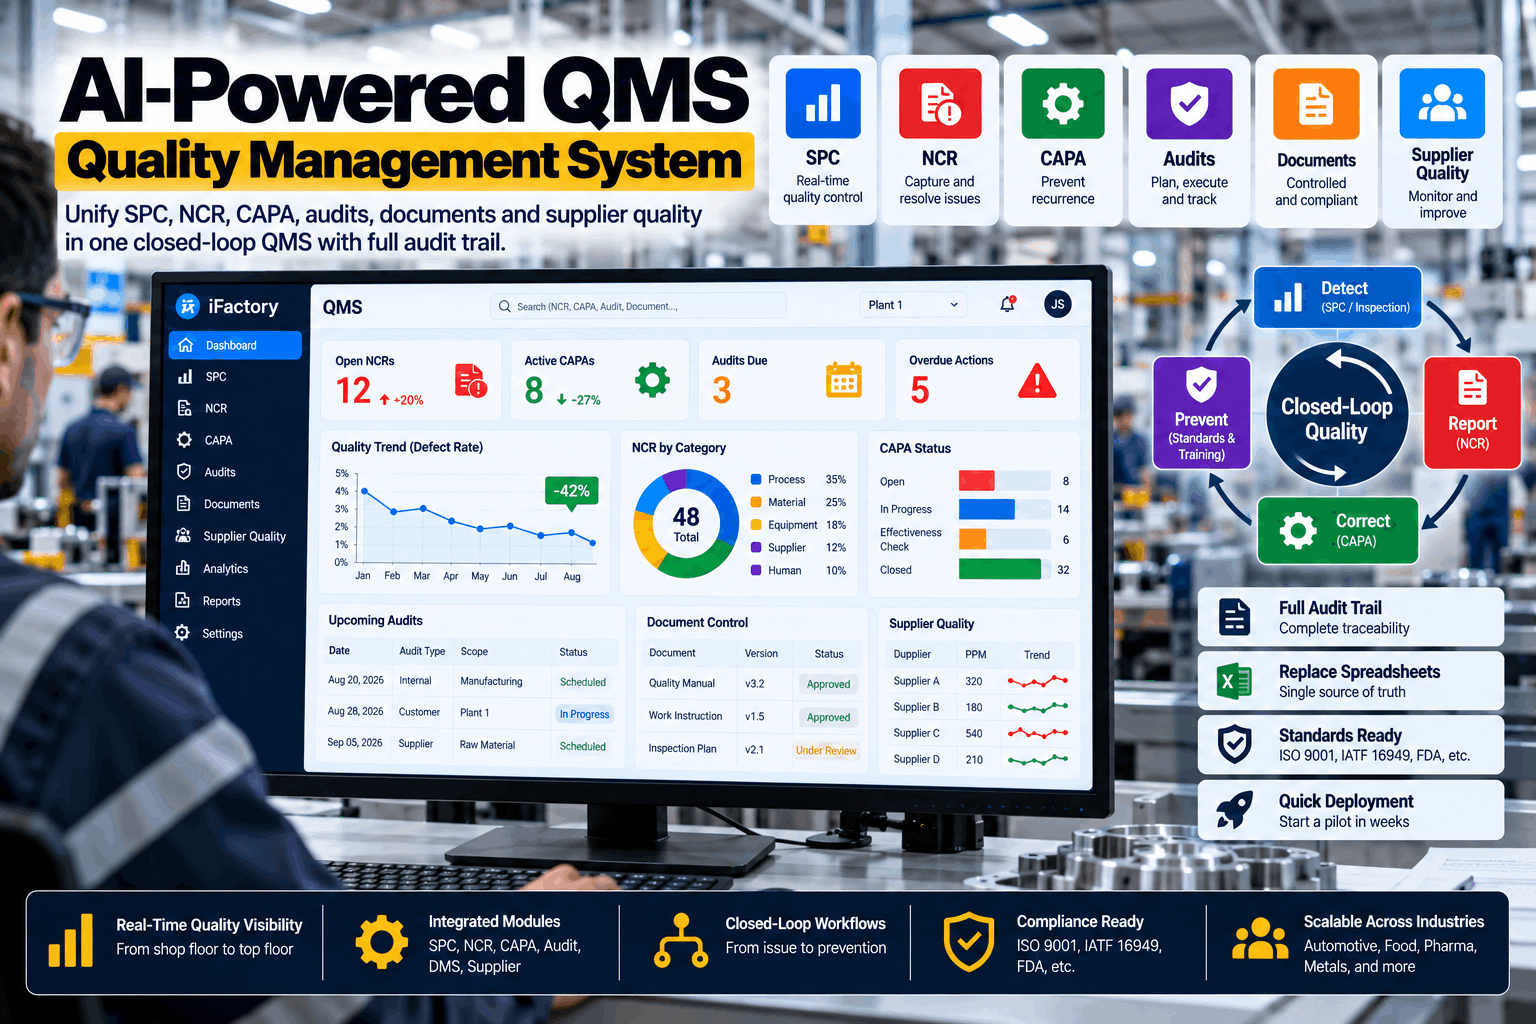
A car body carries thousands of resistance spot welds, yet only a small sample of them is ever torn apart to prove the nugget is big enough. The quality of every other weld depends on whether current, force and energy stayed where the weld schedule put them. Statistical process control turns the data your weld controllers already log into an early warning of that drift, and you can see how it works in a short live demo.
Catch Nugget Drift at the Weld Gun — Not at the Teardown Bench
Electrode wear, coatings, shunting and fit-up move weld current, force and energy a little at a time. SPC on every weld point shows which gun is drifting, what is likely causing it, and what to do before undersized nuggets end up in framed bodies.
A Weld Schedule Stays Fixed While the Conditions Around It Change
A weld schedule fixes squeeze time, current, weld time, hold time and electrode force at launch, once a destructive test batch has proven the nugget. The conditions start changing almost immediately. Electrode faces mushroom, zinc alloys into the copper, coil lots arrive with different coating weights, clamps wear and leave gaps, and nearby welds start to divert current. None of this raises a fault: the controller fires, the robot moves on and the weld looks normal from the outside. What actually happens is that the nugget gets slightly smaller every few hundred welds until a teardown or a dimensional report finds the problem. Each of the six sources below leaves its own trace in the weld data. If one of them is already causing trouble on your line, our support team can help you map it to the signal that reveals it.
As the caps mushroom, the contact face grows and current density falls, so the same kA produces a smaller nugget. A stepper raises current after a fixed weld count, but actual wear rarely follows that count exactly.
Galvanized and galvannealed coatings speed up tip alloying. Three-sheet stacks and mixed AHSS grades also change how heat builds, so the same schedule behaves differently from one coil to the next and from one stack to another.
When a weld sits too close to an earlier one, part of the current flows through the existing nugget. The controller still reads normal current, but the new nugget receives less heat than intended.
Worn clamps, distorted panels or sealer squeeze-out leave an air gap between the sheets. The gun uses part of its force to close that gap, contact resistance shifts and the risk of expulsion rises.
Pneumatic regulators drift, servo guns lose calibration and electrode arms deflect. Low force raises contact resistance and invites expulsion. High force widens the contact area and shrinks the nugget.
Restricted cooling water heats the caps and speeds up wear. Loose shunts, worn cables and hot transformers add resistance that takes away current that should reach the tips.
The Weld Signals That Predict the Nugget
You can't measure the nugget on every weld without destroying the body, so weld SPC tracks the signals that either drive nugget growth or reflect it. Modern medium-frequency DC controllers log most of these on every weld, broken down by weld point and program. The work lies in separating the inputs you control from the responses that show what happened inside the stack, and in matching each signal to the chart that suits it. We walk through this mapping on real controller exports in a working session.
Four Charts for Four Jobs — and Why Standard Limits Mislead on Weld Data
Weld data breaks a basic SPC assumption, which is that consecutive readings are independent. Every weld on a gun wears the same caps a little further, so readings within a dress cycle trend in a predictable direction. If you apply plain Shewhart limits to that data, you get one of two failures: limits wide enough that they never alarm, or an alarm every time the caps reach mid-life. The way out is to choose the chart according to the job it has to do. If your current charts behave like either failure, our weld team can review them with you.
Use it for per-weld input checks such as current and force. It is quick to read and catches single-weld spikes like a missed squeeze or a cable fault.
This is the main chart for slow drift. Because it weights recent welds more heavily, it picks up the gradual slide in energy and resistance caused by tip wear without alarming on single-weld noise.
Group welds by where they fall in the tip-dress cycle. Each band gets limits that reflect normal wear at that stage, so mid-life caps stop triggering false alarms.
This charts the share of welds with expulsion or controller faults, per gun and per shift. A rising rate points to fit-up, force or over-stepped current well before a teardown would.
If your weld SPC alarms all the time, or never, autocorrelation is the usual cause. Two practical fixes work on the shop floor. The first is to subgroup by tip-dress position so the limits move with expected wear. The second is to model the expected wear curve from the stepper profile and chart the residual, which is the gap between what the weld should have done at that tip count and what it actually did. A residual that wanders indicates a real problem, while a reading that simply follows the wear curve does not.
See Weld SPC Built Around Your Dress Cycles
iFactory reads weld controller data per weld point, groups it by gun and tip-dress position, and flags drift with charts designed for autocorrelated weld data. Your team spends its time on real problems instead of normal tip wear.
Set Control Limits Per Weld Point, Not Per Line
The most common failure in weld SPC comes from pooling data rather than from the chart type. A line-level chart averages a thin two-sheet roof weld together with a three-sheet B-pillar weld, and the difference between those two hides the variation you actually need to see. Good subgrouping follows the physics and works outward from the individual weld point. We can show this hierarchy running on your own weld cells in a short call.
This is the base unit. Each point has its own stack-up, access angle and schedule, so each one needs its own baseline and control limits.
Points that share a program can share a chart family, which lets you compare trends across similar stacks.
Guns age at different rates. Charting per gun separates one worn servo or blocked cooling circuit from the rest of the cell.
Tag every weld with its count since the last dress and the last cap change, so wear is accounted for in the limits instead of raising alarms.
Link coil or batch IDs where you have them, so a change in coating weight shows up as a lot effect instead of an unexplained shift.
What the Chart Shows, What Usually Causes It, and What to Do First
A control chart is only useful if the person reading it knows what to do next. These are the patterns weld engineers see most often on spot weld SPC, each paired with the likely root cause and a first action. Treat them as starting points for diagnosis rather than final verdicts. Our support team can help adapt the list to your guns and materials.
A Stable Process Isn't Necessarily Capable — Run Cpk on the Nugget
SPC on electrical signals tells you whether a weld point is stable, but not whether the nugget is big enough. That answer comes from the samples you already take, whether teardowns, chisel checks or ultrasonic tests, charted against the specification. Minimum nugget size is usually written as a multiple of the square root of the thinnest sheet's thickness. AWS D8.1M and many OEM standards follow this approach, using factors such as 4√t, 4.25√t or 4.5√t depending on the spec. The worked example below shows why stability alone isn't enough.
(5.6 − 4.0) ÷ 1.20. The process is centred well above the minimum with tight spread.
(5.2 − 4.0) ÷ 1.35. The process is stable, but it runs too close to the limit for its spread.
Gun B could look entirely stable on its electrical charts and still be incapable, because the process runs too close to the limit. That is why the two views belong together. Electrical SPC protects stability between samples, and nugget Cpk proves that the stable process is good enough. Many automotive quality systems use 1.33 as an ongoing capability benchmark, and customer-specific requirements may ask for more. Our quality team can help you set this up per weld point.
Why Weld SPC Shows Up in Your BIW Dimensional Report
Spot weld quality and body dimensions are usually owned by different teams working from different data, but they are the same problem more often than either team expects. Heat from each weld pulls on the panels, the weld sequence decides where that distortion builds up, and expulsion or undersized welds weaken the joints that hold the geometry once the body leaves the fixture. Linking weld data to the body ID lets both teams look at the same evidence side by side, which we can show in a guided demo.
Teardown-Only Weld Quality Compared With SPC-Led Weld Quality
Most body shops already run teardowns and have weld controllers full of data. The difference lies in whether that data is used between teardowns or only opened after a failure. Our support team can walk you through what changes day to day.
- Weld quality is known only on teardown days
- The suspect window covers every body welded since the last good sample
- Tip dress intervals are set by weld count rather than by condition
- Expulsion is noticed as spatter on the floor, not tracked per gun
- Controller data sits in the controller and is rarely reviewed
- Every weld point is charted continuously between teardowns
- Drift is flagged within the dress cycle in which it starts
- Dress and cap change intervals are tuned to actual wear
- Expulsion rate is charted per gun, per shift
- Weld data sits in one view alongside quality and dimensional records
Weld SPC That Reads Your Controllers and Reasons Like a Weld Engineer
iFactory turns the weld data your plant already produces into charts, alerts and capability records that body shop, quality and maintenance teams can act on together. It works with the controllers and data layer you already run rather than replacing them. You can see the full loop in a live walkthrough.
What Body Shop and Quality Teams Ask About Weld SPC
Turn Weld Controller Data Into Confidence in Every Nugget
iFactory charts every weld point by gun and dress cycle, alerts on real drift with a first action attached, and tracks nugget capability against your spec. Your body shop finds weld problems in the cell before a teardown or dimensional report does.