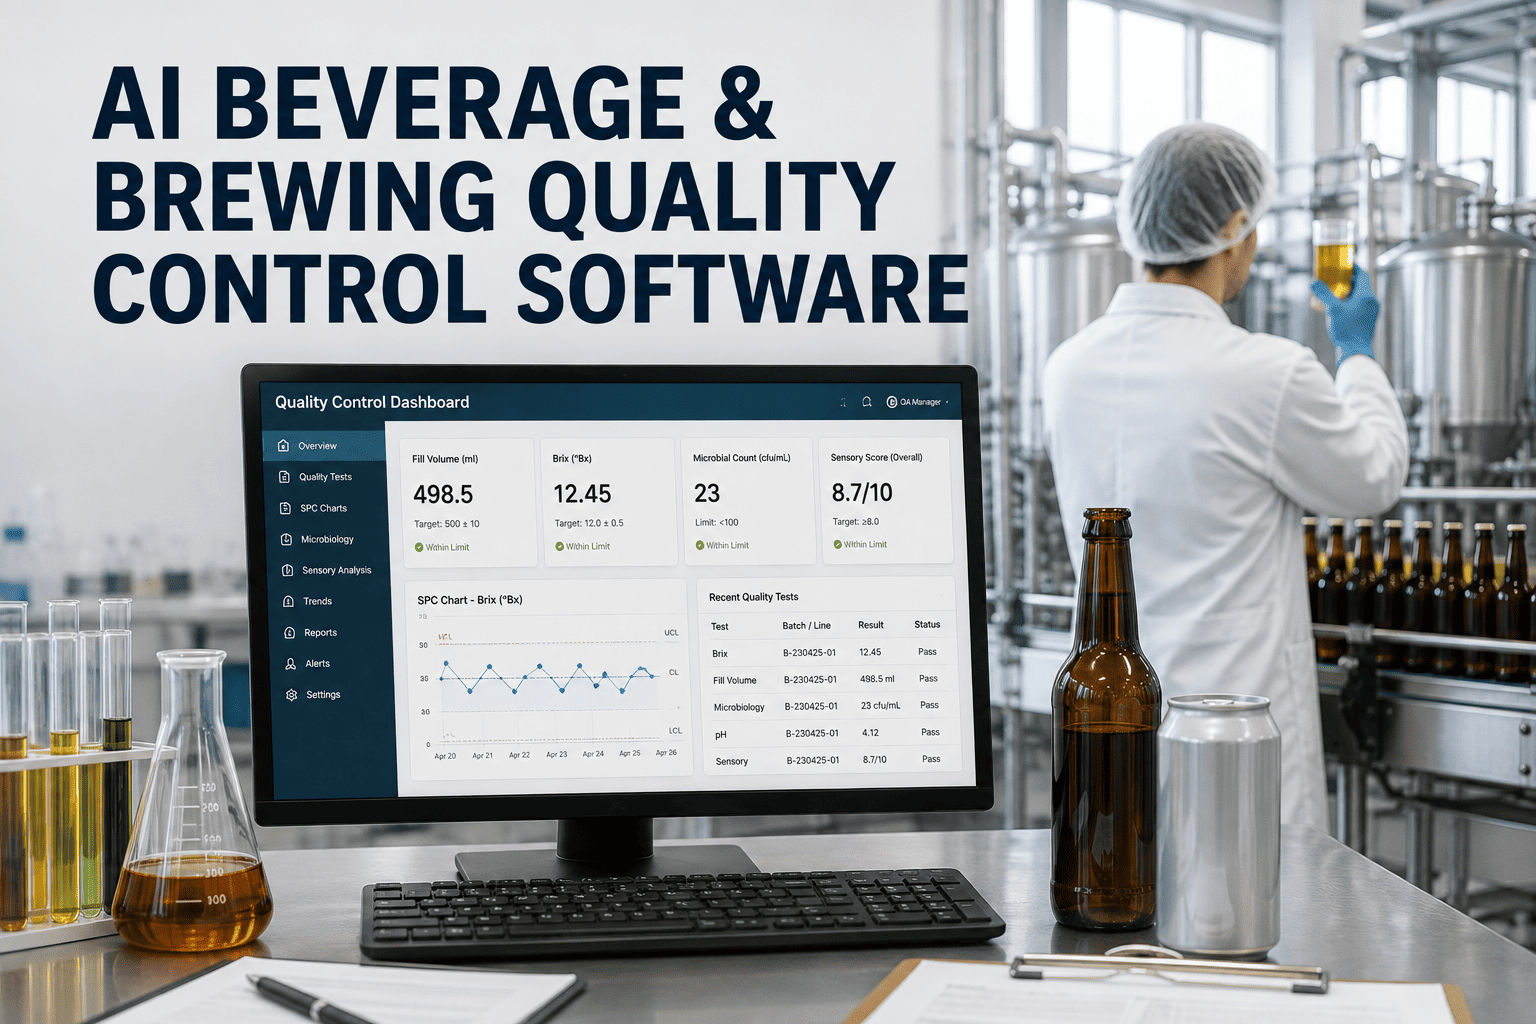
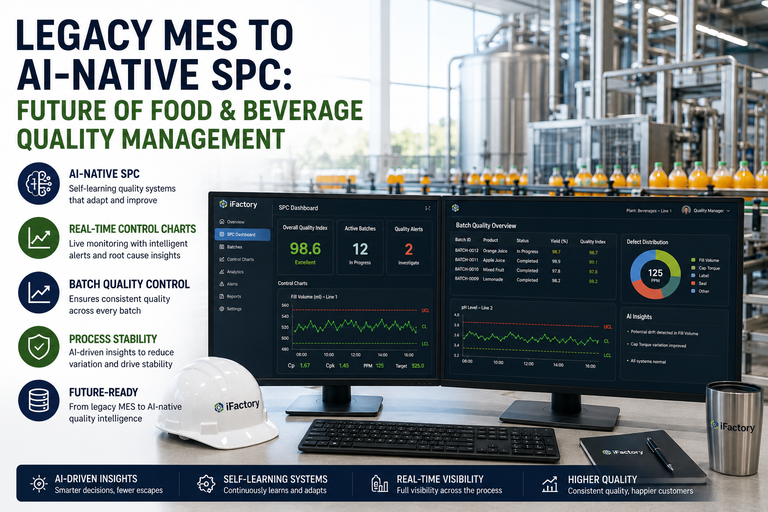
A brewery lab tech runs a specific set of tests every half hour: pH, brix, carbonation, can weight, taste, odor, appearance, code check on the outside of the can. A microbiologist plates samples from the bright tank looking for Pectinatus, Zygosaccharomyces, Dekkera bruxellensis, and the Penicillium spores that cause 90% of spoilage in low-alcohol beers. A sensory panel checks whether the batch tastes like the last one. Every single one of those measurements is a datapoint. Miss one drift and the recall isn't 10,000 cans — it's the batch, then the shift, then the day, then every case that left the warehouse before anyone noticed. The American Society of Brewing Chemists publishes the standard methods. IFU sets the ISO-aligned standards for non-alcoholic and juice beverages. Every OEM audit and every retailer QSA cares. And yet the typical brewing quality operation is a chain of clipboards, disconnected instrument printouts, and a Monday-morning summary spreadsheet that shows what already went wrong three days ago. The plants that win at beverage quality don't have more testing — they have the same testing plus live SPC on every measurement, lab integration that skips manual transcription, and traceability that binds every finished can to its wort batch, its fermentation vessel, its bright tank, and its fill line. iFactory Quality Management for Beverage & Brewing is built to run exactly that — lab-integrated, SPC-driven, traceable end to end.
iFactory QMS for Beverage & Brewing
From Wort to Warehouse — Live Quality Across Every Vessel, Every Fill, Every Case
Lab-integrated brix, pH, ABV, CO₂, and microbiological data with SPC on every stage — plus batch-to-can traceability, ASBC-method compliance, and sensory panels built in.
90%
of NA beer spoilage = yeast
pH <4.0
micro-stability threshold
The Brewing Quality Timeline — QC at Every Checkpoint
Brewing is a chain of eight stages, and each one has its own quality signature. Miss a check at any stage and the drift compounds downstream — bad wort makes bad beer, cross-contamination in the bright tank kills the shelf life, a bad fill wrecks the can. This is where quality actually gets tested.
01
Raw Materials
Malt COA, hop α-acid, yeast viability, water composition
Supplier COAs verified, incoming lots quarantined
02
Mash / Wort
Original gravity (OG), pH 5.2-5.6, wort color (SRM/EBC)
Recipe target vs. actual, mash efficiency tracked
03
Fermentation
Gravity drop OG-to-FG, temp profile, cell count, diacetyl
Attenuation profile vs. yeast strain baseline
04
Bright Tank
ABV, dissolved O₂, CO₂, turbidity, microbiological plating
Most critical stage — micro contamination caught here or nowhere
05
Filtration & Stabilization
Turbidity NTU, protein stability, colloidal check
Filter integrity, membrane pressure differential
06
Filling / Packaging
Fill weight, headspace O₂, seam quality, code readability
Airborne micro sampling — Pectinatus is the classic risk
07
Pasteurization / Sterile Fill
PU units delivered, seal integrity, sterile-air pressure
Time-temp equivalent verified per batch
08
Finished Goods
Sensory panel, shelf-life challenge, retention samples
Release-or-hold decision on every batch
The Three Pillars of Beverage Quality
Beverage QC lives on three legs, and if any one of them is weak the whole program topples. Analytical tells you the chemistry. Microbiological tells you the stability. Sensory tells you whether the customer will actually notice. All three feed the same release decision.
Analytical
Chemistry & Physics
Brix / gravity / apparent extract
pH — critical for stability
ABV / alcohol by volume
Dissolved O₂ / CO₂
Bitterness (IBU), color (SRM/EBC)
Turbidity (NTU / EBC formazin)
Microbiological
Stability & Safety
Membrane filtration plating
Total viable count (TVC)
Wild yeast detection
Beer-spoilage bacteria (Pectinatus, Megasphaera)
Fungal load (Penicillium, Zygosaccharomyces)
ATP swabs on tanks and lines
Sensory
Perception & Consistency
Trained panel triangle tests
Descriptive analysis vs. reference
Off-flavor identification (DMS, diacetyl, oxidation)
Shelf-life challenge tests
Retention sample tracking
Consumer feedback correlation
The Spoilage Organisms That Actually Cause Problems
Not every microbe kills beer. But a specific handful — well-documented in ASBC and IFU literature — cause almost every spoilage incident in production. Knowing what to look for is half the battle. Live micro tracking is the other half.
Bacteria
Pectinatus & Megasphaera
Off-flavors, turbidity
Anaerobic, packaging-stage risk. Detected too late in-package means recall. Live airborne monitoring in filling hall is the counter.
Bacteria
Lactobacillus & Pediococcus
Sourness, ropiness
Classic beer spoilers. Hop tolerance in some strains means they survive where others don't. Bright tank plating is essential.
Wild yeast
Dekkera / Brettanomyces
Phenolic, barnyard notes
Preservative-resistant. Contaminates pipework and gaskets. Only detectable via specific-media plating, not general TVC.
Wild yeast
Zygosaccharomyces bailii
Package explosion
Ferments in packaged product. Dangerous. Physical package damage means retail loss and consumer safety issue.
Fungi
Penicillium spp.
Off-flavors, spores
Dominant filamentous fungi in filling halls. Air sampling and surface swabs on filler carousels catch it.
Special risk
Low/no-alcohol products
90%+ spoilage from yeast
Reduced ethanol removes a natural barrier. Requires pH <4.0, restricted fermentable sugars, and enhanced processing controls.
Want to see your own spoilage-risk profile mapped to your fill line and bright tanks? Book a demo — bring one month of micro plating results.
Where SPC on Every Measurement Actually Changes Things
The typical brewery still runs quality as a "did we pass?" gate check. SPC transforms it into an early-warning system — every measurement plotted against its control limits, drift caught while the fix is still cheap, and every batch closed with a proper release-or-hold decision backed by trend evidence, not just a single-point reading.
01
Fill Weight per Head
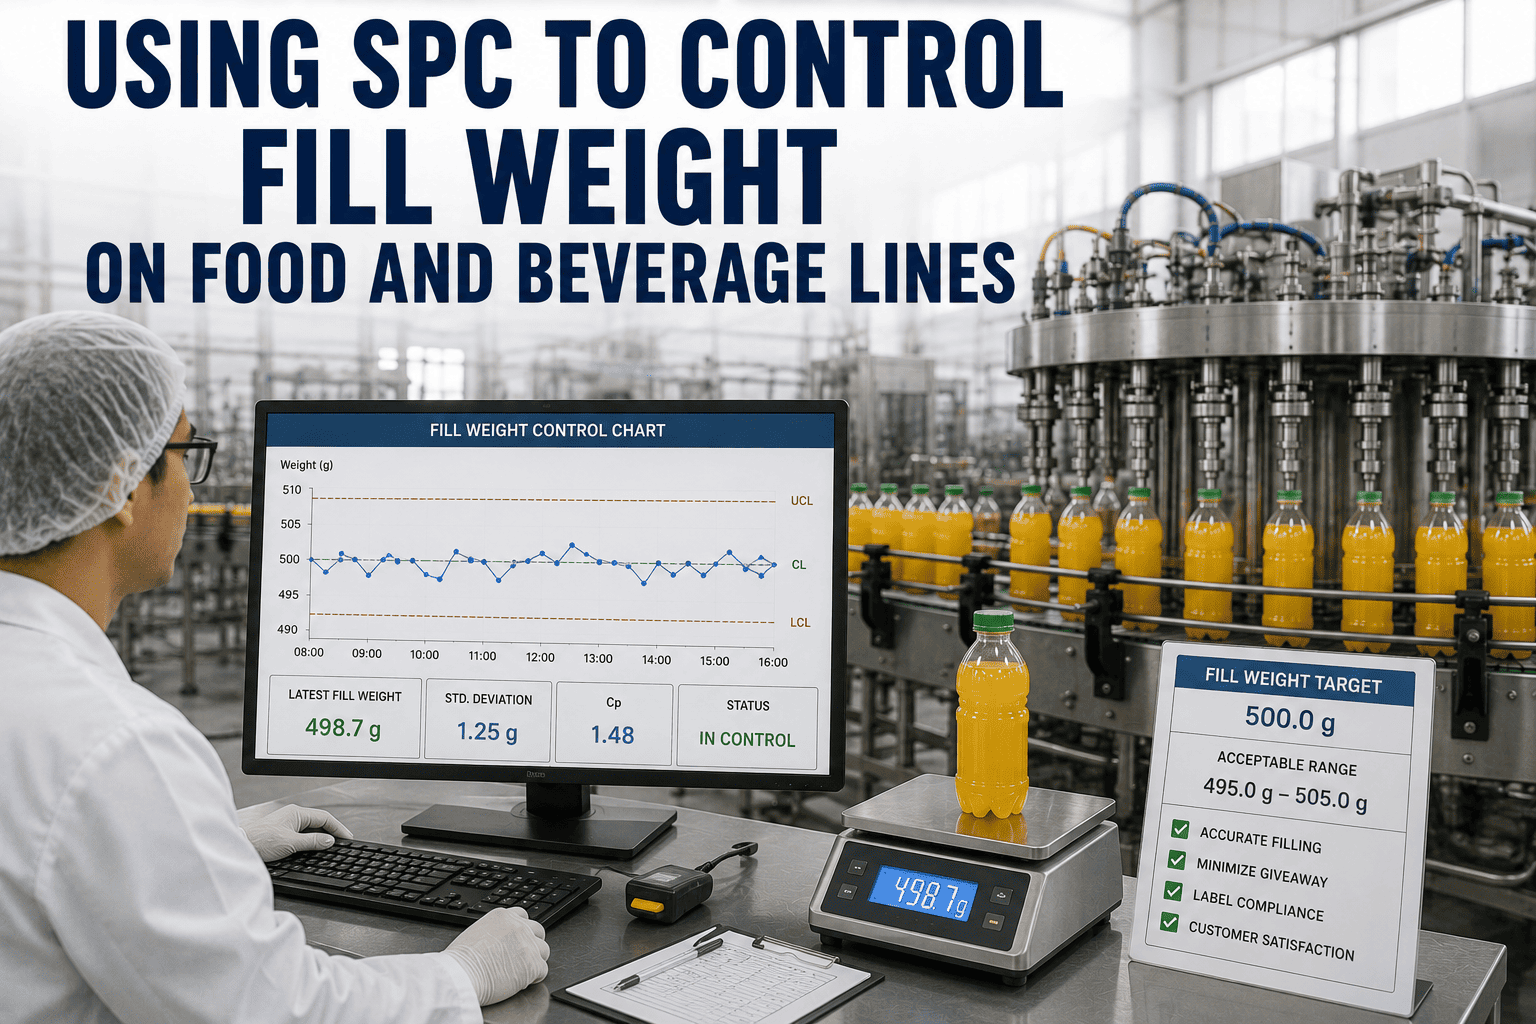
Per-head X-bar and R-chart. Drift caught 30+ minutes before checkweigher rejects — protects TNE compliance and giveaway.
02
Brix / Gravity Trending
Fermentation curves versus yeast strain baseline. Stuck ferments and slow attenuation flagged inside 12 hours.
03
Dissolved O₂ Post-Fill
Ppb-level DO tracked per fill head. Shelf-life killer — trend up means seal or CO₂ delivery issue, caught before batches ship.
04
Bright Tank Turbidity
NTU trending per tank per batch. Filtration effectiveness and colloidal stability tracked over time.
05
Micro Plate Counts
Colony counts per stage per shift. Rising trend triggers CIP investigation before a positive turns into a batch hold.
06
Sensory Panel Consistency
Panel scores trended vs. reference. Drift in taster consensus flags either process drift or panel-training drift.
Lab Integration — The Manual Transcription Problem
Most brewery quality time is not spent testing. It's spent typing lab results into spreadsheets, chasing paper log sheets, and reconciling instrument printouts with batch records. Direct lab integration eliminates the whole layer.
BEFORE INTEGRATION
Instrument › paper › spreadsheet
Anton Paar density meter prints a slip
Tech writes reading on shift log
Log transcribed into Excel end of shift
Errors compound — transcription, unit confusion, missing rows
Trend visible only in Monday review, days after the drift
WITH LAB INTEGRATION
Instrument › QMS › SPC engine
Anton Paar, Sartorius, Hach connected directly
Every reading auto-recorded with batch, tech, timestamp
SPC rules fire in real time on the reading
Zero transcription errors, zero missed data
Drift visible in minutes, not Monday
How iFactory QMS Runs the Loop
Beverage quality is a live loop — measure, trend, decide, act, verify. Every measurement feeds the batch record, every batch record feeds traceability, every traceability record feeds the compliance evidence pack.
01
Ingest Lab & Line
Direct integration with Anton Paar, Sartorius, Hach, Bevington, PLC-connected flow meters, checkweighers, and vision systems.
02
Bind to Batch
Every reading tagged to brew number, vessel, fill line, SKU, and shift. Traceability threaded from grain lot to can code.
03
Run SPC Rules
Western Electric and Nelson rules on every measurement per stage. Warning bands inside the critical limit.
04
Release or Hold
Digital batch record consolidates all analytical, micro, and sensory data — one screen, one decision, one signature.
05
Audit & Recall Ready
ASBC/IFU method compliance logged. Every can code traceable back to the brew, the tank, the fill head, the shift.
What Live Beverage QC Delivers
Beverage quality is one of the highest-leverage places to invest — the same measurements you're already making, but caught days earlier and bound to the batch record automatically. These are the outcomes brewers typically see.
Zero
Transcription errors
direct instrument integration
Days
Earlier drift detection
SPC vs. weekly review
Can
to grain-lot traceability
narrow recall scope
ASBC
Method compliant
retailer QSA and FDA audit ready
Curious what live SPC would have caught on your last shipment hold? Talk to our beverage team — we'll replay it against your batch data.
Frequently Asked Questions
Isn't our current lab process good enough?
If your process catches drift the same shift it happens, tracks trend on every measurement automatically, and gives you a batch-to-can traceability chain in minutes for a recall, yes. If drift is caught on Monday's review, if micro results are typed into Excel from paper printouts, and if a shipment hold means someone spends four hours reconciling records — those are the specific gaps live QMS closes. Same lab, same tests, but the data becomes actionable.
Does this replace our existing LIMS?
Usually complements it. LIMS handles sample management and lab workflow well. iFactory QMS adds the SPC, batch-record integration, real-time trending, and production floor visibility LIMS platforms typically don't do. Native connectors work with LabWare, STARLIMS, and most other LIMS platforms — the lab keeps its LIMS, and production gets the live quality layer.
What analytical instruments does it integrate with?
Direct integration with the major beverage-lab instruments: Anton Paar density meters and DMA analyzers, Sartorius water and micro testing platforms, Hach turbidimeters and DO meters, Bevington fill weight scales, Foss NIR analyzers, and most GC and HPLC systems for congener and off-flavor analysis. On the production side, we read fill weight from checkweighers, headspace O₂ from post-filling gauges, and micro results from plate readers or membrane filtration systems.
How does it handle low- and no-alcohol beverages specifically?
NA and low-alcohol beers have higher spoilage risk because reduced ethanol removes the natural microbial barrier — yeasts cause more than 90% of spoilage in low-alcohol products. The QMS treats these SKUs with tighter micro monitoring, mandatory pH tracking below 4.0, restricted fermentable-extract tracking, and dedicated sensory panels to catch developing off-flavors. Pasteurization / sterile filtration parameters are logged per batch with the time-temperature equivalent verified.
How does traceability actually work from can code back to grain?
Every can code links to a fill run. Every fill run links to a bright tank. Every bright tank links to fermentation vessel and duration. Every fermentation links to wort batch, mash, and grain/hop lots with supplier COAs attached. When a customer complaint or QC hold surfaces, the trace runs backward through the whole chain in seconds — and forward: "all can codes from bright tank BT-3 batch 2274" returns the affected shipment list immediately. Recall scope stops being a Friday afternoon investigation.
Can we run a pilot on one line before full rollout?
Yes — that's usually how enterprise deployments start. Pick one high-value SKU or one fill line, connect the analytical and micro instruments, wire in the checkweigher and DO meter, and prove the workflow with real production. Pilots typically run 6-8 weeks and produce hard per-line ROI numbers before you scale plant-wide.
Stop finding out on Monday.
See Live Beverage QMS Running on Your Own Line
Pick one SKU or one fill line, and we'll instrument the analytical and micro paths, wire in the checkweigher and DO meter, and run the SPC engine live on real production data — with batch-to-can traceability, a mock recall scope, and the exact release-or-hold workflow your QA team would use every day.
Can-code
to grain-lot trace