Using SPC to Control Fill Weight on Food and Beverage Lines
By Jackson T on July 30, 2026
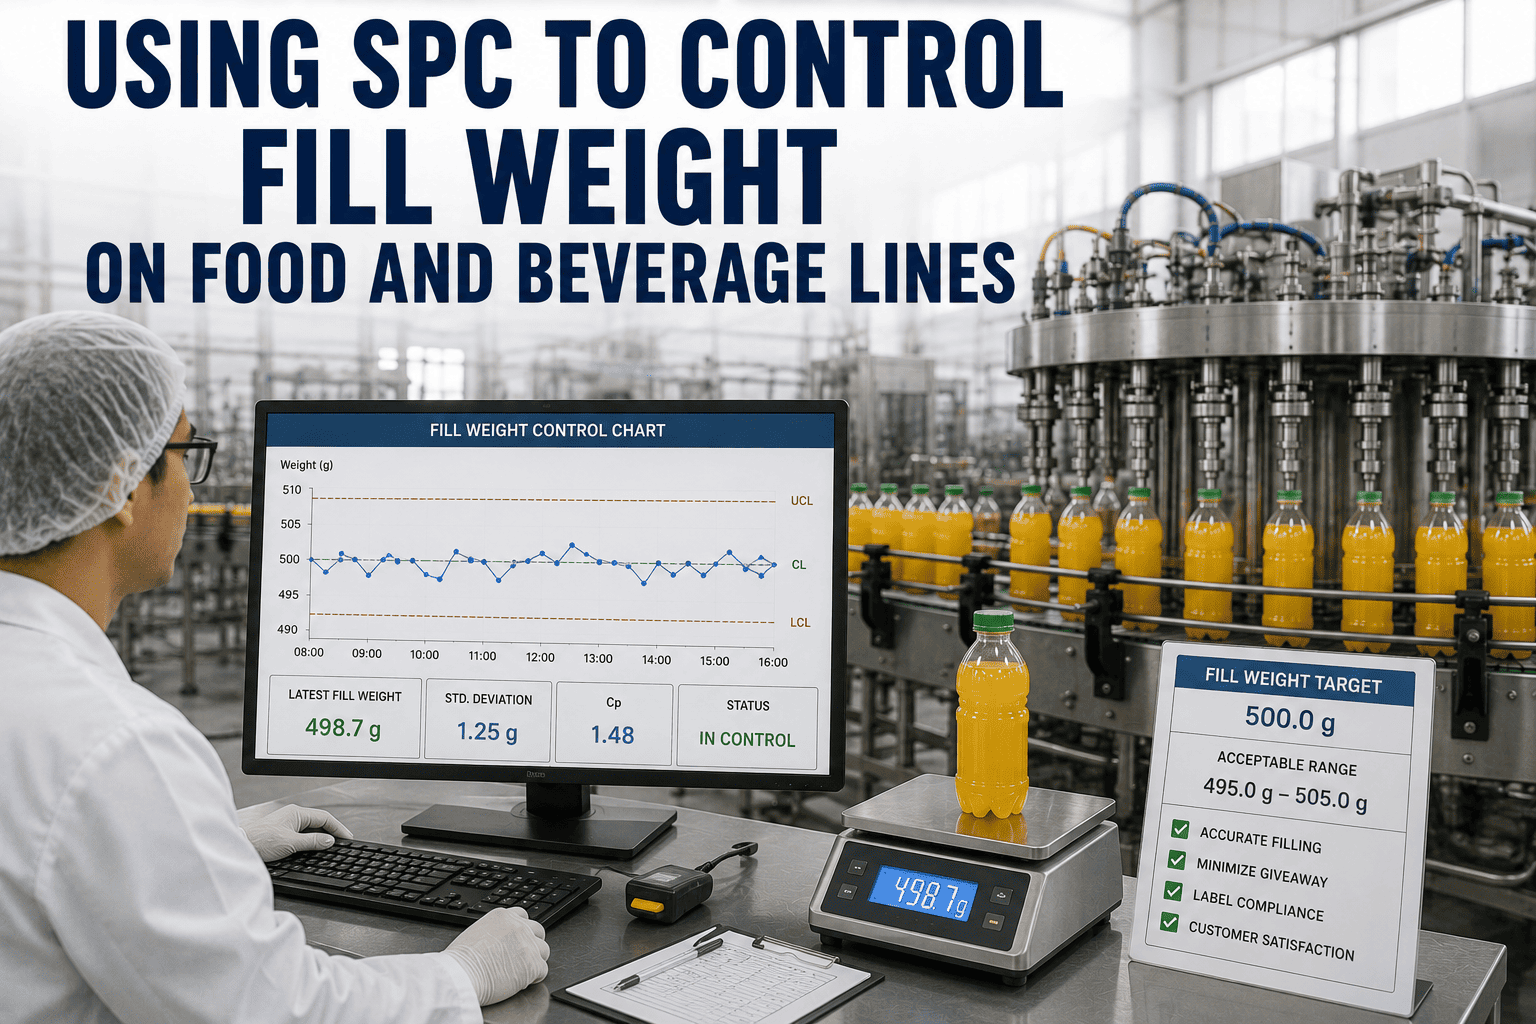
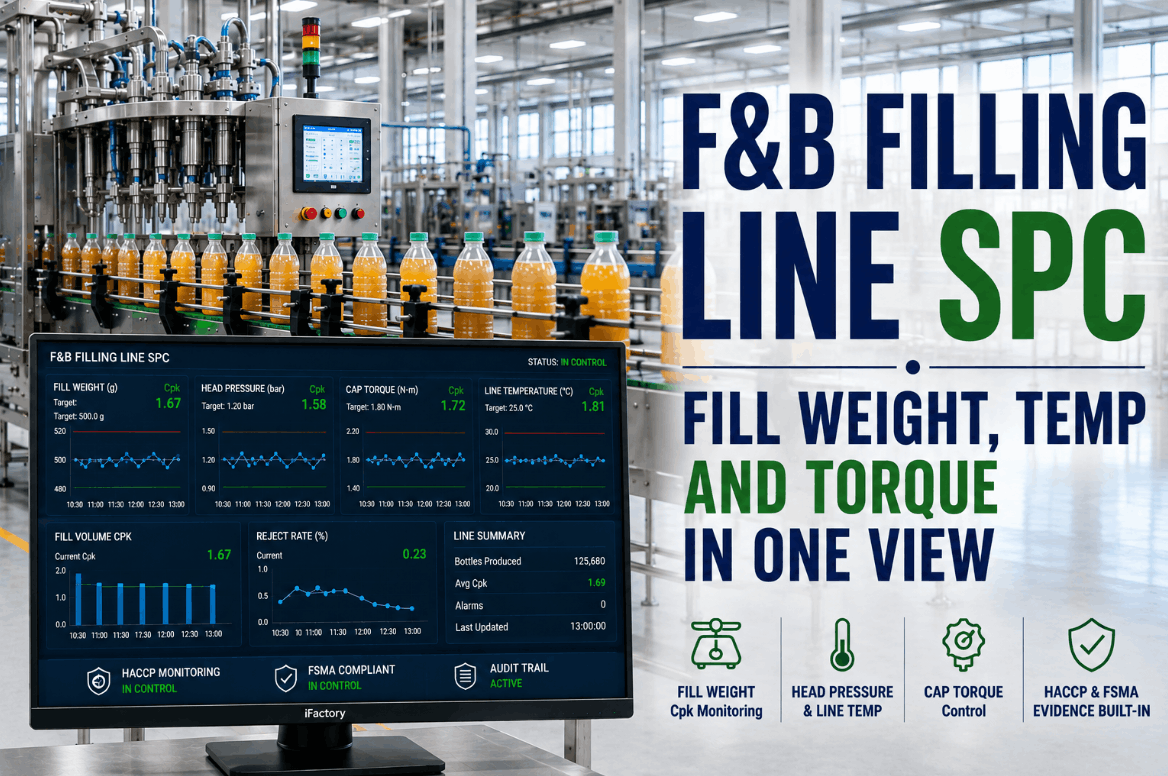
A 200-gram jar that averages 207 grams looks fine on the checkweigher. Nobody complains, no regulator calls, and the operator sleeps at night. Multiply 7 extra grams by 10,000 jars a shift, by three shifts, by 250 production days, and the number stops being 7 grams and becomes 5.25 tonnes of product given away for free every year. On the other side of the same distribution, one shift of under-fills becomes a tolerable negative error violation, a chargeback from the retailer, and a MAV finding that pulls the line for inspection. This is the two-sided trap of fill weight — overfill quietly bleeds margin, underfill loudly triggers compliance action, and most plants have picked "overfill" as the safer answer to a process that isn't actually stable. That is exactly the wrong answer. Overfilling to cover variability doesn't fix the variability — it just pays for it. Real-time SPC on the fill stream lets you do what "extra grams" was pretending to do: keep every fill inside spec while moving the target down toward the label. In one documented case, an SPC intervention on a filling line that was running 30.5% out of specification cut giveaway cost by $0.048 per package — the kind of number that compounds into real annual savings on any high-volume line. iFactory SPC on fill weight is built for exactly this — protecting the label, cutting the giveaway, and holding both together across every valve, every head, every shift.
iFactory SPC for Fill Weight
Cut Giveaway Without Ever Risking an Underfill
Real-time SPC on fill weight per valve, per head, per SKU — with tolerable negative error tracking and drift alerts before the average leaves the safe zone.
The Goldilocks Distribution — Before and After SPC
Fill weight lives on a bell curve. Where the curve sits, and how wide it is, decides everything about giveaway and compliance risk. The whole point of SPC is to narrow the curve and move it closer to the label line — without letting the left tail cross into underfill.
Before SPC
Wide curve, target far right of label
207g mean
±5g σ
28% overfill
After SPC
Narrow curve, target just above label
202g mean
±1.5g σ
5g saved / unit
The Two-Sided Cost of Getting Fill Weight Wrong
Fill weight is one of the few metrics where being "safe" costs money. Overfill hides in the P&L. Underfill hides in the compliance file. Both need to be trended, and neither can be treated as the acceptable answer.
OVERFILL
The margin killer
Every gram above target is product walking out the door unpaid
3% overfill on 100,000 units monthly compounds fast into six-figure annual loss
Overfilling to "play safe" is usually covering an unstable process, not fixing it
Invisible on the shop floor — nobody catches it because nothing looks wrong
UNDERFILL
The compliance killer
TNE violation triggers regulator action, potential fines and product recall
Loud, visible, immediate — and usually the reason overfill exists in the first place
How SPC Reads the Fill Stream Differently
A checkweigher tells you a package was underweight. SPC tells you the process is trending toward one. That is a fundamentally different signal — and it's the one that lets you act before rejects or violations happen.
Signal 1
Mean drift
Nine consecutive fills trending down toward the label line — SPC fires while every individual pack is still above spec. The checkweigher won't catch it for another 40 minutes.
Signal 2
Widening range
The R-chart opens up before the mean moves. The process is becoming less stable — usually valve wear or seal degradation on specific positions.
Signal 3
Per-valve drift
Aggregate weight looks fine; positions 18-22 are drifting light. Head-by-head SPC catches the subset before the overall distribution widens visibly.
Signal 4
Warning-band cluster
Two of three points inside the warning zone near the lower spec limit. Not yet a violation, but the process is asking for attention before it becomes one.
Want per-valve SPC on your own fill weight stream? Book a demo and bring one shift of checkweigher data.
Setting the Fill Target — The Real Math
The tighter the distribution, the closer to the label you can safely set the target. That's the arithmetic that turns SPC into real dollars — every gram of process variation you reduce is a gram you can subtract from your safety margin.
Label weight
200 g
TNE tolerance
−9 g
Process σ (before)
5 g
Process σ (after SPC)
1.5 g
Safe target before
207 g
Label + 1.4σ margin
Safe target after
202 g
Label + 1.4σ, but σ shrunk
Recovered per unit
5 g
Per package, every shift
How iFactory Runs the Fill Weight Loop
Fill weight SPC only pays back when the fired rule reaches a calibration or a valve change. iFactory routes every drift into a specific action — before the checkweigher rejects, and before the target has to be raised.
01
Ingest Checkweigher & PLC
Per-package weights, per-valve fill times, per-head torque pulled from the checkweigher DAS and filler PLC.
02
Baseline per SKU & Position
Individual UCL / LCL / warning bands computed per SKU, per valve — 40 valves means 40 baselines, not one.
03
Run Rule Engine Live
Nelson and Western Electric rules fire on mean drift, widening range, and warning-band clusters per position.
04
Route Targeted Action
Valve seal on position 21. Calibration on head 8. Target trim on the SKU. Specific action, specific owner, specific deadline.
05
Verify Return & Log
Post-action distribution confirms σ dropped and mean is on target — event closes with the audit trail regulators and finance both want.
What Fill Weight SPC Delivers
Fill weight is one of the few metrics that pays back in both directions — cut giveaway and cut compliance risk with the same intervention. These are the outcomes food and beverage plants typically see after moving from checkweigher-only monitoring to per-position SPC.
5 g
Giveaway saved
per unit, typical on tight-σ recovery
Zero
TNE violations
as target moves down safely
Per-valve
Drift caught
before it becomes reject or overfill
HACCP
Audit trail
continuous and time-stamped
Curious what 5g giveaway savings across your SKU mix is worth? Talk to our F&B team — we'll size it against your line rate and SKU mix.
Frequently Asked Questions
Isn't overfilling just the safe way to avoid TNE violations?
It's the tempting way, not the safe way. Overfill covers up process instability, but it doesn't fix it — the same variability that causes underfill risk is still there, just hidden. If the process drifts wider or the mean moves down, you're back in violation territory anyway. Real SPC on fill weight lets you narrow the distribution, which is what actually makes the process safer, and then move the target down toward the label to convert that stability into recovered giveaway.
How is this different from what our checkweigher already does?
The checkweigher tells you a package was underweight. SPC tells you the process is trending toward one. That means SPC fires while every individual pack is still above spec — 9 declining points can be flagged 30-40 minutes before any single fill actually crosses TNE. The checkweigher stays as the last line of defense; SPC becomes the early-warning layer that keeps rejects near zero.
How much giveaway can we realistically recover?
It depends on how much your current process σ can shrink. A typical case in the industry: process σ drops from 5 g to 1.5 g through per-valve tuning and drift alerting, letting the target move from 207 g to 202 g on a 200 g label. That's 5 g per package. On 100,000 units per month, 5g × 100,000 = 500 kg of recovered product per month, per SKU. The dollar value scales with product cost.
Does this support HACCP, FSMA, and legal-metrology audits?
Yes. Every fill event, every SPC rule fire, and every corrective action is time-stamped and logged. The record shows the individual fills, the process mean and σ per shift, the TNE compliance trend, and the actions taken — the audit trail regulators and legal-metrology inspectors both expect. That trail satisfies HACCP evidence requirements, FSMA preventive controls, and average-quantity law demonstration in the same record.
Can we see it on our own line before committing?
Yes. Bring one filler, one SKU, and one week of checkweigher and PLC data. We'll compute the real per-valve baseline, apply the SPC rules, and show exactly what giveaway you're currently paying for, which valves are driving the variance, and what the target could safely move to. Book a demo and we'll walk it live on your numbers.
Stop paying for the safety margin.
See What Your Own Fill Weight Distribution Looks Like
Bring one filler, one SKU, and one week of checkweigher data. We'll build the per-valve baseline, plot the distribution against the label and TNE lines, run the SPC engine on actual fills, and show the exact grams of giveaway that would come back with a tighter σ.