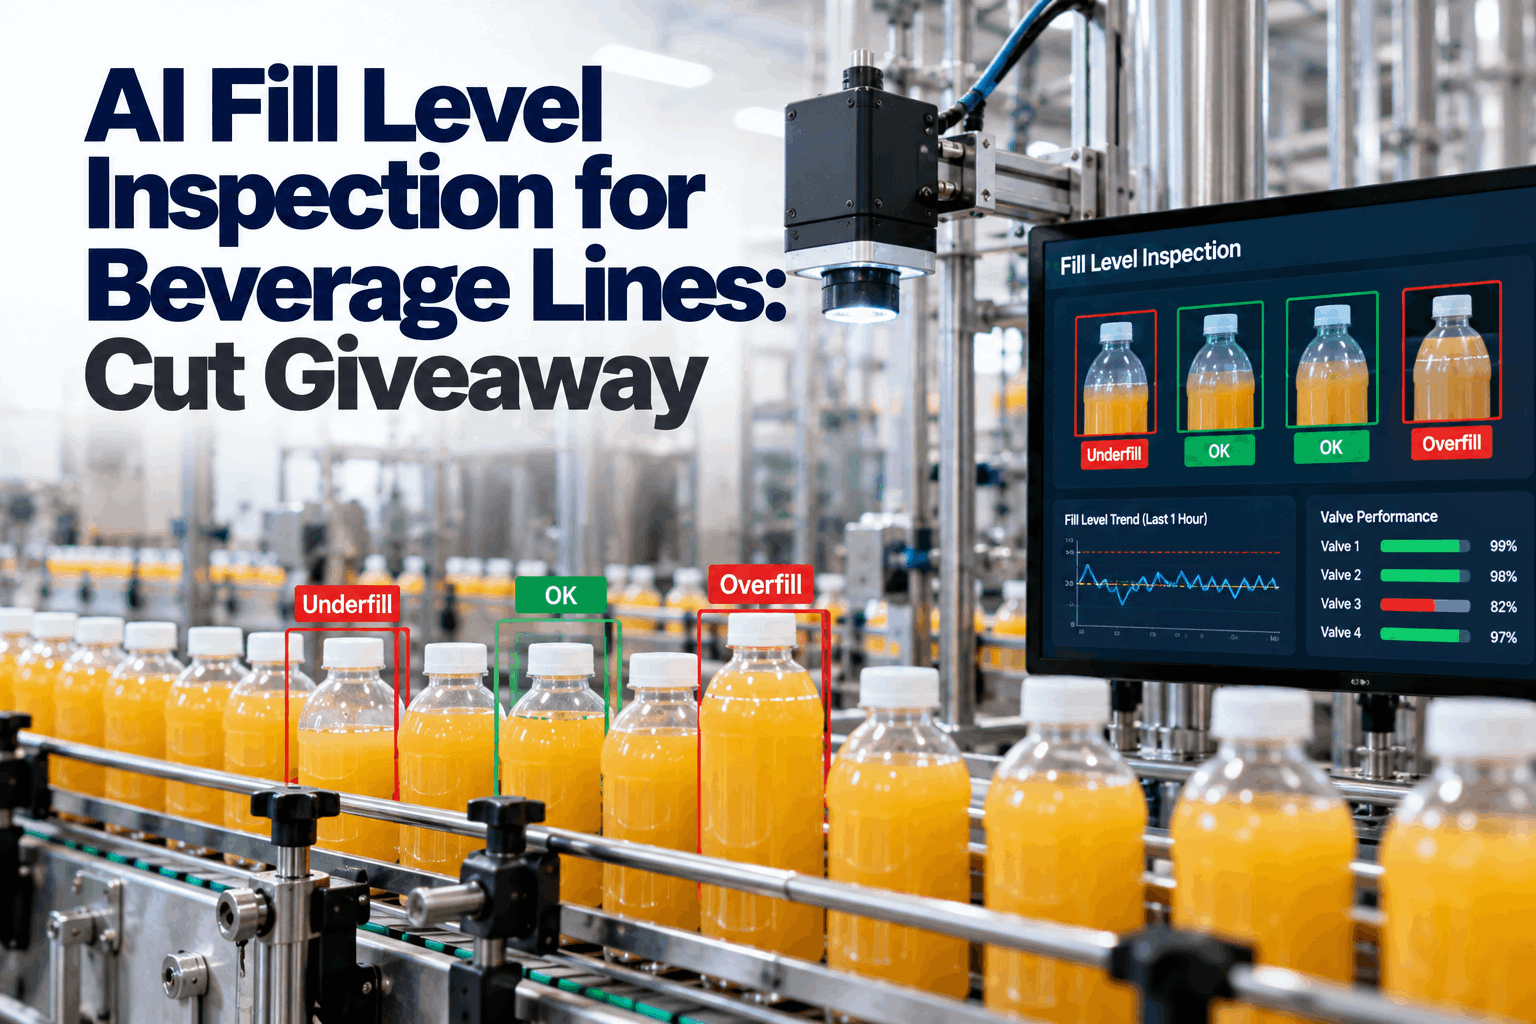
On most beverage lines, fill height is set a little high on purpose. Nobody wants a short-fill complaint or a failed net content audit, so the target creeps up a few millilitres above the label. At line speed, that margin turns into thousands of litres of free product a week. The real cause is usually a handful of filler valves drifting from the rest. AI fill level inspection measures every container, rejects true under-fills, traces variation to individual valves and shows giveaway in money per shift. Start with a giveaway review.
AI Fill Level Inspection for Beverage Lines: Cut Giveaway
Measure every container, not a sample. Find the valves that force the fill target up, fix them, and run closer to the label without risking short fills.
- Why fill targets drift up and what it costs
- Per-container measurement and valve-level SPC
- A worked giveaway calculation in money per shift
Why Fill Targets Drift Upward
Variation, not the average, is what forces overfill.
Net content rules push plants to fill on the safe side. In the US, NIST Handbook 133 sets an average requirement: the average net quantity of a lot must at least equal the quantity on the label, and packages short by more than the maximum allowable variation count as unreasonable errors. Many other markets use similar average systems. The wider the spread of fills, the higher the target must sit to keep short fills rare. If a few valves run low, the whole filler is pushed up to compensate. The good valves then overfill on every cycle, and the plant pays for the bad ones many times over, every shift, for as long as nobody can see which valves are at fault. Our quality engineers can review how your target is set today.
Sample checks
A few containers an hour cannot see one bad valve.
Whole-filler targets
Everyone pays for the variation of the worst valves.
Slow drift
Valve wear and seal changes move fills gradually.
Invisible cost
Overfill is never reported as money, so it is rarely chased.
How AI Fill Level Inspection Works
Measure, map to the valve, chart, act.
A camera after the filler or capper images every container. The AI finds the liquid line, even through foam, condensation or coloured glass, and converts it to a fill height or volume using a calibration for that container. Each container is tracked back to the filler valve that filled it, so every measurement lands on the right valve's chart. Because it measures at full line speed, there is no need to slow the line or pull containers for manual checks, and operators see results on a screen beside the filler. See it on a line like yours in a live demo.
Image
Every container at line speed.
Measure
Liquid line found, height converted to volume.
Map
Container linked to its filler valve.
Chart
SPC per valve and for the whole filler.
Act
Reject under-fills, flag drifting valves.
Fill height only means something if it is tied to volume. Calibrate each container type against check-weighed samples, and repeat when the bottle supplier or mould changes, because small changes in wall thickness or shape move the height for the same volume.
Valve-Level SPC: Finding the Real Cause
One chart for the filler hides the valve that matters.
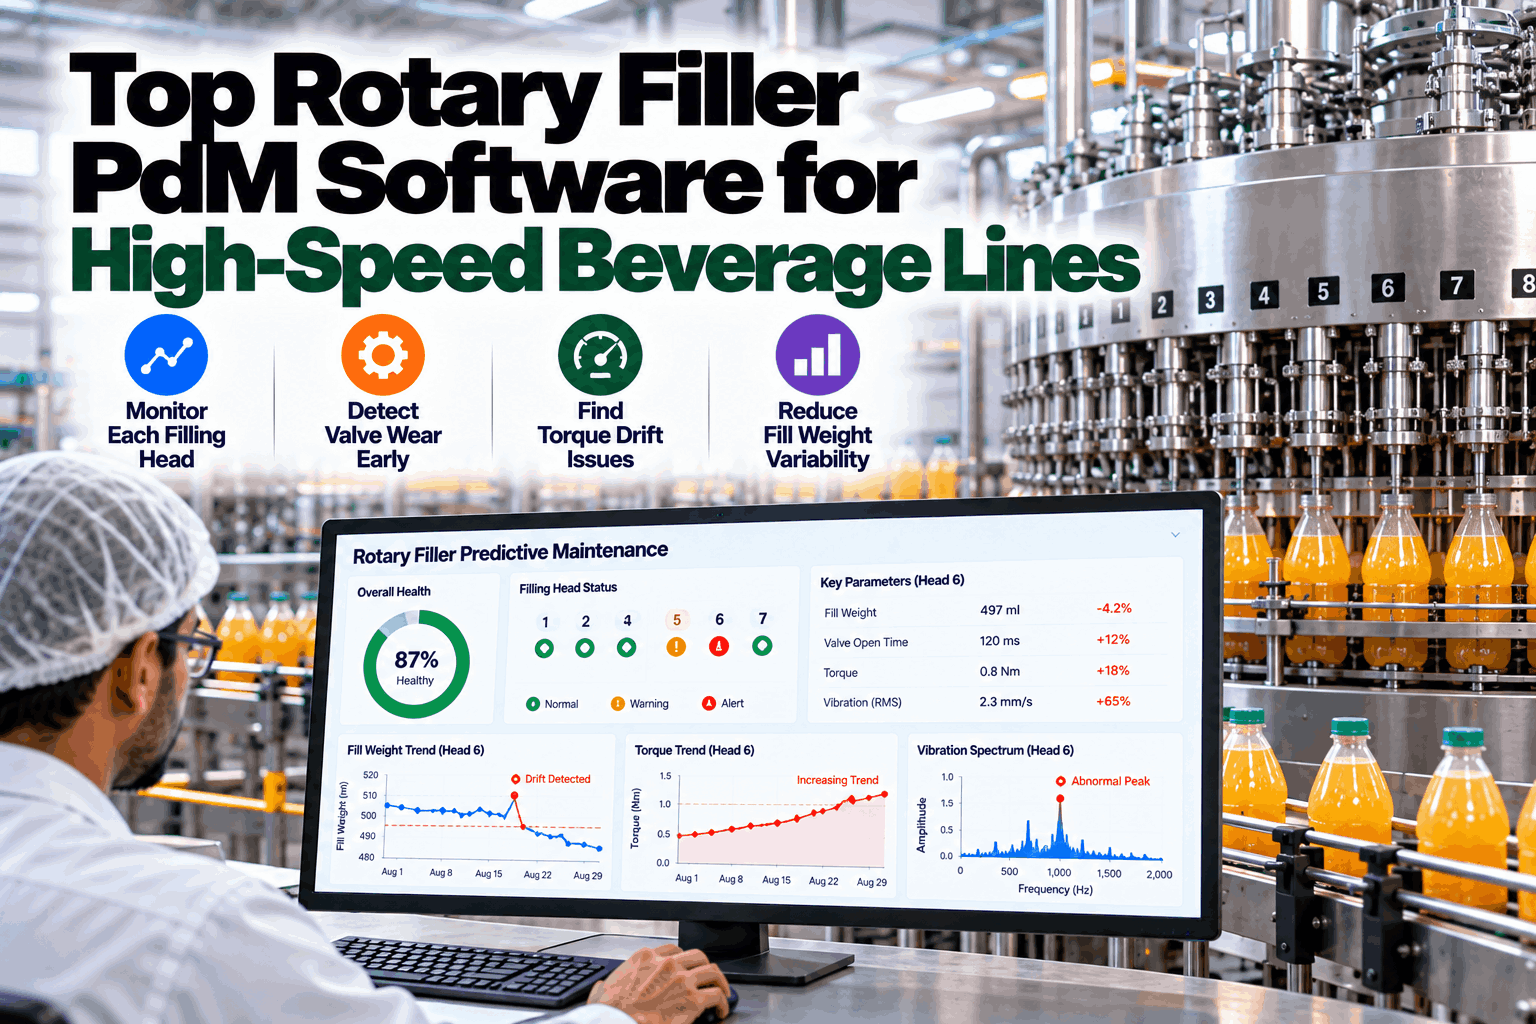
A rotary filler with dozens of valves can show a healthy overall average while one valve runs low and another runs high. Charting each valve separately shows which ones drift, how fast and since when. That turns a vague quality problem into a specific maintenance job. It also shows whether a rebuild worked, because the valve's chart should snap back into line with the others straight after the repair. Set up valve charts with our SPC specialists.
If every valve moves together, the cause is upstream: product temperature, carbonation level or bowl pressure. If one valve moves alone, the cause is in that valve. Valve-level charts make this split obvious in seconds.
Where to Inspect on the Line
Camera position decides what you can see and fix.
Fill inspection is usually placed right after the filler and capper, before labelling, so containers can still be traced to their valve and rejected before more value is added. On some lines a second check after the labeller catches containers that leak or lose product later. Plan camera positions with our line engineers.
After the capper
Fill is settled, the valve link is still exact and rejects cost the least.
After the labeller
Catches leaks and loose caps before packing.
Verified reject
A reject confirm sensor proves each flagged container left the line.
The vision system should reject containers below the limit your net content procedure sets, not an arbitrary line drawn for comfort. Rejecting too many good containers wastes product just like overfill does. Review limits with quality whenever a product, container or market changes.
Records That Back Up Your Net Content Control
Every container measured means every container on record.
Auditors and customers increasingly ask how net content is controlled, not just whether a sample passed. Per-container data gives a full picture: averages by lot, rejects by valve and every adjustment made. Records are stored by lot and shift so they can be pulled up quickly when needed. Ask our quality team how records are structured.
What is recorded
- Fill measurement for every container
- Average and spread by lot and shift
- Every reject with valve and time
- Calibration checks and target changes
What it answers
- Did this lot meet its average?
- Which valves caused short fills?
- When did the target last change, and why?
- How much was given away last month?
See Your Giveaway in Money per Shift
Every container measured, every valve charted, and overfill turned into a number your finance team understands.
A Worked Giveaway Calculation
Small millilitres, large money.
Take a 500 mL bottle line running 400 bottles per minute, so 192,000 bottles in an eight-hour shift. The plant sets its target two standard deviations above the label. With a spread of 3.0 mL, the target is 506 mL. After fixing the drifting valves, the spread falls to 1.5 mL and the target can move to 503 mL. Product costs $0.60 per litre. All figures are illustrative. Run your own numbers in a working session.
The two standard deviation target rule is an example only. Set your own target with your net content procedure and the rules of each market you sell into.
Giveaway by Product, Line and Shift
Know where the money goes, not just that it goes.
Once every container is measured, giveaway can be broken down any way that helps people act. Product costs differ, so a millilitre of premium juice is worth more than a millilitre of water. Shifts differ too, often because of how carefully the filler is set up after a changeover. Review the breakdown in a data session.
By SKU
High-value products first, where each millilitre costs most.
By filler
Fillers with the widest spread and the most valve drift.
By crew
Differences after changeovers and start-ups.
By week
Whether giveaway is falling as fixes go in.
From Drifting Valve to Work Order
The fix is a maintenance job, so treat it as one.
When a valve drifts past its limit, the system drafts a work order with the valve number, its chart, the size of the drift and the likely cause. The planner approves it and schedules the rebuild into the next changeover or sanitation window. Until then, the system keeps rejecting under-fills from that valve, so no short containers reach customers while the job waits. Ask our support team how work orders reach your CMMS.
Fill Inspection Mistakes to Avoid
Measuring every container is only the start.
These patterns limit the value of fill inspection on many lines. A short line review can find them.
What works
- Calibration per container type
- Charts per valve, not just per filler
- Giveaway shown in money per shift
- Valve drift turned into planned work
What fails
- Rejecting under-fills without finding why
- Raising the target after every complaint
- Ignoring foam and condensation effects
- No link from inspection to maintenance
How iFactory Runs AI Fill Level Inspection
AI Vision QC, on your own network.
iFactory measures fill on every container, maps each one to its filler valve, runs SPC per valve, drafts work orders for drifting valves and reports giveaway in money per shift. It runs on an on-prem AI server beside your line. Fit questions go to our solutions team.
Per-container measurement
Every bottle or can at line speed.
Valve-level SPC
Charts per valve and per filler.
Under-fill rejects
Short containers removed and logged.
Autonomous work orders
Drifting valves drafted for planners.
Giveaway in money
Overfill cost per shift and per line.
Container calibration
Height to volume per container type.
Results depend on your containers, products, line speed and target rules. We measure fill spread, giveaway and rejects on your own line during the pilot, rather than promising a general figure.
Turnkey AI: Delivered, Connected and Live in 6–12 Weeks
You do not build this. It arrives ready.
iFactory ships as a pre-configured NVIDIA AI server with the software pre-loaded, racked and ready. Rack it, plug in power and Ethernet, and the AI is live on your network. Our team handles cabling, network setup, PLC, SCADA, DCS and CMMS integration, filler and camera links, operator training and 24×7 remote monitoring. Data stays on your network. For a scope matched to your plant, request a turnkey quote.
Ship, network and data
Server installed. Cameras mounted, filler position tracking and CMMS connected.
Model training and pilot
Container calibration done. Valve charts and reject limits tuned on one line.
Go-live and training
Fill inspection live. Quality and maintenance teams trained. 24×7 monitoring begins.
Frequently Asked Questions
What is AI fill level inspection?
It is camera-based inspection that measures the fill of every container at line speed, rejects under-fills and charts fill by filler valve to find the source of variation.
How does it reduce giveaway?
By finding and fixing the valves that widen the spread of fills. A tighter spread lets the plant set its target closer to the label without more short fills.
What does the average requirement mean?
Under NIST Handbook 133 in the US, the average net quantity of a lot must at least equal the labelled quantity, and packages short by more than the maximum allowable variation are unreasonable errors.
Can it see through foam or coloured glass?
Yes, with the right lighting and models. Foam, condensation and dark containers are tested during the pilot.
How is each container linked to a valve?
The filler's position signal tracks each container from the valve to the camera, so every measurement is assigned to the right valve.
Does it replace check weighers?
Not always. Many plants keep check weighing for net content records and use vision for every-container measurement and valve diagnosis.
How quickly can we lower the target?
Only after the valve fixes have tightened the spread and the new data has been reviewed. Most plants lower targets in small steps, checking short fills and complaints at each step.
Does it work on cans?
Opaque containers need a different method, such as X-ray or gamma level sensing. We advise on the right method for each line.
How do we start?
Start with one high-volume line. A 6-week pilot installs cameras, calibrates containers and runs valve charts. To plan it, contact our team.
Stop Giving Product Away
In thirty minutes we look at your fill targets, line speed and check-weigh data, and estimate giveaway per shift on one line. You keep the estimate either way.
- 1Fill target and label size per product
- 2A week of check-weigh data
- 3Filler make and number of valves
- 4Product cost per litre
- 5Last short-fill complaint or audit finding