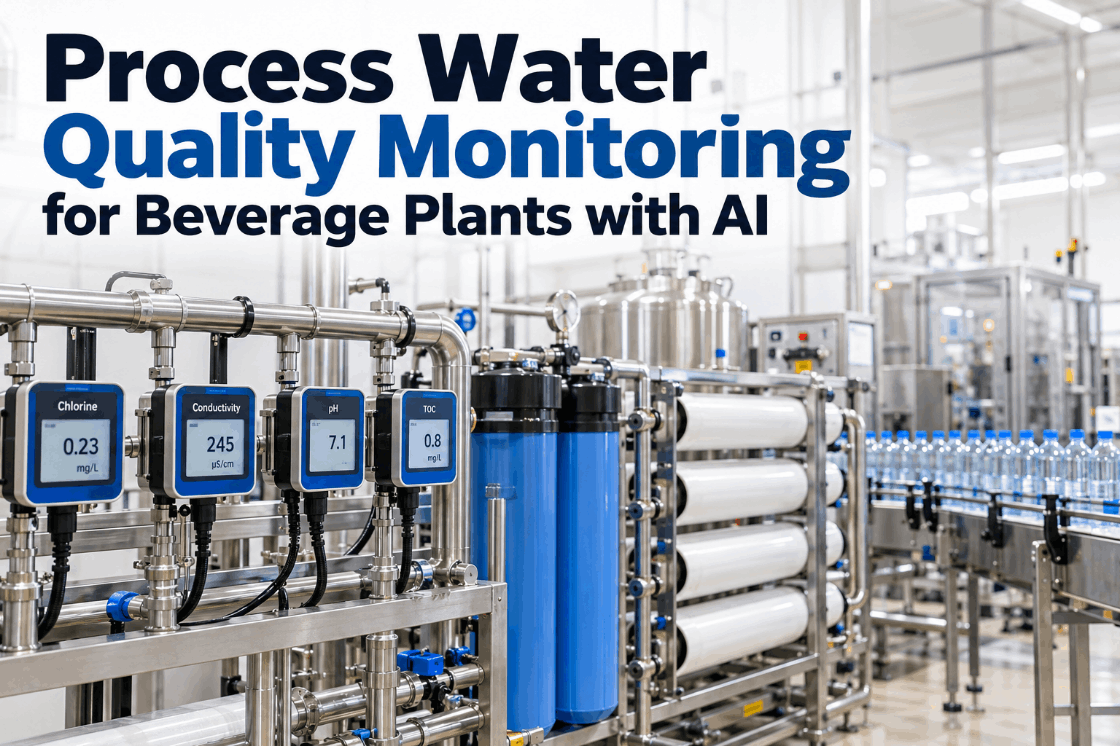
Process Water Quality Monitoring for Beverage Plants with AI

By Josh Brook on October 19, 2026

process-water-quality-monitoring-beverage-plants-ai

In a beverage plant, water is the main ingredient and the main cleaning agent at the same time. A carbon bed that lets chlorine through can damage RO membranes in days and leave an off-taste in product, while a slow drift in RO performance can go unnoticed until a quality check fails. Process water quality monitoring ties inline sensors, filter health and manual tests into one view, so problems show up as trends rather than surprises. See it on a real water room in a short water analytics demo.

PREDICTIVE AI · BEVERAGE PROCESS WATER

See Every Stage of Your Water Room, and What Will Wear Out Next

iFactory Water Analytics trends inline sensors across the treatment train and predicts carbon, filter and RO membrane life. Manual tests are logged by voice and land in the same compliance record as the sensor data.

Water room · Line 2 supplyLive
MMFΔP 0.6 bar
CarbonCl rising
RONPF −6%
UVLamp OK
Carbon bed 2Chlorine slip trending up · plan media change in about 9 days
Voice-logged · 07:42 · Operator"Carbon outlet, free chlorine zero, total chlorine zero point zero two."Read back and saved to today's record
WATER TREATMENT BEVERAGE

A Typical Treatment Train and What Each Stage Removes

Most beverage water rooms follow the same logic, even if the exact equipment differs. Particles come out first, then chlorine and organics, then hardness, then dissolved salts, with a final disinfection step before storage. Each stage protects the next one, so a weak stage upstream shows up as damage downstream. Your source water and product specification decide which stages you need. Map your own water room in a water room review.

1
Multimedia filterSuspended solids and turbidity
2
Activated carbonChlorine, taste and odour, organics
3
SoftenerHardness that would scale membranes
4
Reverse osmosisDissolved salts and most remaining organics
5
UVInactivates microorganisms, leaves no residual
6
Product water tankStored and sent to syrup room and CIP
Softener or antiscalant

Some plants skip the softener and dose antiscalant ahead of the RO instead, as their membrane supplier advises. Either way, scale control is what protects the membranes, so whichever method you use needs its own outlet check and a place in the daily water record.

CONDUCTIVITY MONITORING AND TOC

What to Measure After Each Stage

Good monitoring checks the outlet of each stage, not just the final tank. Conductivity is the fast, continuous signal for dissolved salts after RO. Total organic carbon (TOC) shows organic load that conductivity cannot see. Chlorine checks after carbon protect the membranes. The matrix shows a common layout. Your limits come from your own product specification and your membrane supplier. Ask our water support team to review your sensor points.

Point
Inline sensor
Manual test
Why it matters
Raw or city water in
Free chlorine, turbidity, temperature
Total chlorine, hardness
Sets the load on every stage after it
After multimedia filter
Differential pressure, turbidity
Silt density index if your RO supplier asks for it
Tells you when to backwash
After carbon
Free chlorine or ORP
Free and total chlorine
Protects RO and taste
After softener
Hardness analyser, if fitted
Hardness
Shows exhaustion before scale forms
RO feed and permeate
Conductivity, flows, pressures, temperature
Conductivity cross-check
Membrane health
Product water tank
Conductivity, TOC where fitted
Micro samples, taste panel
Product water quality
CHLORINE RESIDUAL

Wanted on the Way In, Removed Before RO and Product

Chlorine plays two roles. In incoming water it keeps microbial growth down. Before the RO, it has to be gone, because polyamide membranes are damaged by oxidation. FilmTec lists free chlorine tolerance for a common brackish water element as less than 0.1 ppm, and Hydranautics says composite polyamide elements may not be exposed to chlorinated water under any circumstances. Chlorine also has to be out of product water, where it affects taste. Talk through your chlorine control points in a chlorine control session.

Chlorine wanted
Incoming water and raw water storageResidual keeps bacteria down until the carbon stage
Carbon or bisulfite
Chlorine removed here
Chlorine must be absent
RO feed, permeate and product waterOxidation damages membranes and changes taste
Bisulfite dosingHydranautics gives 1.8 to 3.0 ppm sodium bisulfite per 1.0 ppm free chlorine, with enough mixing and contact time
ChloramineSome utilities use chloramine, which is harder for carbon to remove. Test total chlorine, not only free
Carbon bedsOnce chlorine is gone, bacteria can grow in the bed. Many plants sanitise carbon with hot water or steam
RO MEMBRANE MONITORING

Normalise First, Then Decide When to Clean

Raw RO readings move with feed temperature, pressure and salt content, so they can hide fouling or raise false alarms. A 4°C fall in feed temperature can cut permeate flow by about 10% on perfectly clean membranes. Normalisation corrects for those conditions and compares performance against the stable baseline from the first days of operation. Widely used cleaning triggers are shown below. Check them against your membrane supplier's guidance with our support team.

−10%
Normalised permeate flowA 10% fall from baseline points to fouling or scalingNow −6%
+5 to 10%
Normalised salt passageA rise points to scaling, damage or an O-ring leakNow +2%
+10 to 15%
Normalised differential pressureA rise points to fouling in the feed channelsNow +6%

Predict Filter and Membrane Life From Your Own Trends

iFactory normalises RO data automatically, tracks every filter's pressure and outlet quality, and forecasts when each stage will need attention. Manual tests logged by voice sit beside the sensor data in one record.

Water room · QA lead and iFactory
QA leadIs permeate conductivity up because of the membranes?
iFactoryMostly not. Feed conductivity rose after the city supply changed. Normalised salt passage is up only 2%.
QA leadAnd flow?
iFactoryNormalised flow is down 6% and falling slowly. At this rate it reaches the 10% cleaning trigger in about three weeks.
CARBON FILTER AND FILTER LIFE

How Much Life Is Left in Each Stage

Every stage wears out in a way you can measure. Multimedia and cartridge filters load up and their differential pressure rises. Carbon loses capacity and chlorine starts to slip through. Softener resin exhausts between regenerations. UV lamps lose output with age. Trending each signal against its own limit turns fixed replacement intervals into planned work. The view below is illustrative. See life forecasts on real data in a forecast walkthrough.

Multimedia filterBackwash in 2 days
Carbon bed 2Media change in about 9 days
Cartridge filtersChange in about 3 weeks
RO train AClean in about 3 weeks
UV lampWithin rated hours
PRODUCT WATER QUALITY IN CIP

The Last Rinse Is Only as Good as the Water

CIP ends with a rinse that leaves water on product-contact surfaces, so the final rinse water should meet the quality your food safety plan sets for product contact. Conductivity does two jobs here. It separates detergent from rinse water during each step, and at the end it should come back to the rinse water's own baseline, which shows detergent has been flushed out. A slow return points to a rinse that is too short or water that has changed. Ask our support team how to link CIP and water records.

Step 1Pre-rinseRemoves loose product
Step 2Caustic washConductivity confirms strength
Step 3Intermediate rinseConductivity falls back
Step 4Acid washWhere your program uses one
Step 5Final rinseTreated water, conductivity at rinse baseline
WATER ANALYTICS SOFTWARE

Manual Tests, Spoken Once and Filed Correctly

Many checks are still manual: chlorine test kits, hardness titrations, taste panels and micro samples. Written on a clipboard, they are slow to file and easy to miss in an audit. With voice logging, the operator says the result, the system reads it back and the value is saved next to the sensor trend for the same point and time. See voice logging in a short demo.

Operator says"Softener two outlet, hardness zero, test kit batch four one seven."
iFactory reads back"Softener 2 outlet, hardness 0, kit batch 417. Save?"
PointSoftener 2 outlet
TestHardness, manual kit
Result0, within plant limit
Who and whenOperator, 07:51
Linked sensorSoftener 2 trend, same time
RecordDaily water quality log
PROCESS WATER QUALITY MONITORING IMPLEMENTATION GUIDE

From Scattered Readings to One Water Record

Most water rooms already have sensors. The work is connecting them, agreeing limits and closing the gaps in manual testing. Doing it in stages keeps the water room running throughout. Plan the stages with our water support team.

1
Survey the trainList every stage, sensor, manual test and its limit
2
Connect the sensorsBring PLC and analyser signals into one history
3
Set up normalisationUse RO baseline data from a known clean period
4
Move tests to voiceReplace paper logs, one test round at a time
5
Plan work from forecastsBackwash, media changes and RO cleans scheduled ahead
PROCESS WATER QUALITY MONITORING COST AND ROI

Size the Value With Your Own Numbers

The biggest single risk in most water rooms is a chlorine event that damages a full RO train. The worksheet uses assumed inputs to show the arithmetic only. Replace them with your own element count, price and testing routine. Build your own case in a cost review session.

RO elements in one train18, assumed
Price per element$600, assumed
Element cost of one chlorine-damaged train18 × $600 = $10,800, before downtime
Manual tests per day12, assumed
Minutes saved per test with voice logging3, assumed
Operator time saved per day12 × 3 = 36 min
BEST PRACTICES FOR PLANT MANAGERS

Six Rules That Keep Process Water in Control

These rules apply whatever equipment you run. They keep problems visible early and make audits simple. Review them against your current routine with our support team.

Test after every stageAn outlet check finds a weak stage before the next one is harmed
Track total chlorineFree chlorine alone can miss chloramine
Trend normalised RO dataDecide on cleaning from normalised values, not raw flow
Sanitise carbon bedsOn a schedule, before counts rise, not after
Check sensors against kitsA drifting probe is worse than no probe
Keep one recordSensor data and manual tests filed together by point and time
TURNKEY AI DEPLOYMENT

Water Analytics, Voice Logging and NVIDIA Server in One Package

iFactory delivers Water Analytics as a turnkey system. A pre-configured NVIDIA AI server ships racked and ready with the normalisation, life prediction and voice models pre-loaded, so data is processed on site. You rack it, plug in power and Ethernet, and the AI is live. To scope it for your water room, request a turnkey quote.

What's Included
  • Pre-configured NVIDIA AI edge server, racked and ready
  • Links to water room PLCs and inline analysers
  • Automatic RO normalisation against your baseline
  • Life forecasts for filters, carbon, resin and membranes
  • Voice logging of manual tests with read-back
  • One compliance record per point, shift and day
  • 24×7 remote monitoring of models and hardware
Live in 6–12 weeks
Wk 1–4
Survey and Connect

Train mapped, server installed, sensors and analysers linked.

Wk 5–8
Baseline and Tune

RO baseline set, limits agreed, forecasts checked against history.

Wk 9–12
Go-Live and Training

Voice logging and alerts switched on, operators and QA trained.

HOW iFACTORY FITS

One View of Water From Inlet to Final Rinse

iFactory brings sensors, forecasts and manual tests together, so quality, maintenance and production see the same water data. Our support team can walk you through a pilot plan.

1
Trends inline sensors. Chlorine, conductivity, TOC, pressures and flows for every stage in one history.
2
Predicts filter and membrane life. Normalised RO data and filter trends become planned work.
3
Logs manual tests by voice. Results are read back, confirmed and saved against the right point.
4
Builds one compliance record. Sensor data and manual tests are filed together for audits.
1000+
Industrial clients running iFactory
99.9%
Platform uptime for round-the-clock water rooms
6-12 wks
From racked server to live water analytics
FREQUENTLY ASKED QUESTIONS

What Plant Managers Ask About Process Water Quality Monitoring

What should a beverage plant monitor in process water?
At minimum, chlorine after the carbon stage, hardness after the softener, conductivity, flows and pressures on the RO, UV lamp status and conductivity in the product water tank. TOC adds a view of organic load. Manual tests and micro samples complete the picture, at points and limits set by your own specification.
Why must chlorine be removed before the RO?
Most RO membranes in beverage plants are polyamide, which is damaged by oxidation. Membrane makers set very low or zero chlorine tolerance, so chlorine is removed upstream with activated carbon or sodium bisulfite and checked continuously at the RO feed.
What is normalised permeate flow?
It is RO permeate flow corrected to fixed reference conditions for temperature, pressure and feed concentration. Normalising separates real fouling from normal swings, such as the lower flow a colder feed produces, so cleaning decisions are based on membrane condition.
How are filter and membrane life predicted?
Each stage has a signal that changes as it wears: differential pressure for filters, chlorine slip for carbon, normalised flow and salt passage for RO. iFactory trends each one against its limit and estimates when it will get there, so the work can be planned.
Do inline sensors replace manual tests?
No. Manual tests check that sensors are reading correctly and cover parameters that are not measured inline, such as micro counts and taste. Voice logging makes those tests faster to record and files them next to the sensor data for the same point. When a manual result and a sensor disagree, that gap is flagged so the probe can be checked or recalibrated.
How do we get started?
Start with the carbon and RO stages, where problems are most costly. Connect the sensors you already have, set the RO baseline and move one daily test round to voice logging. Our support team can plan that first phase with you.

Know Your Water Before It Reaches the Product

Trend every stage, predict carbon, filter and membrane life, and log manual tests by voice into one compliance record. The full system is delivered turnkey and goes live in 6 to 12 weeks.

Example daily summary · Water room
Stages trendedFilter, carbon, softener, RO, UV
RO healthNormalised flow and salt passage
ForecastsBackwash, media and RO cleans
Manual testsVoice-logged with read-back
One compliance record for every water point

Share This Story, Choose Your Platform!