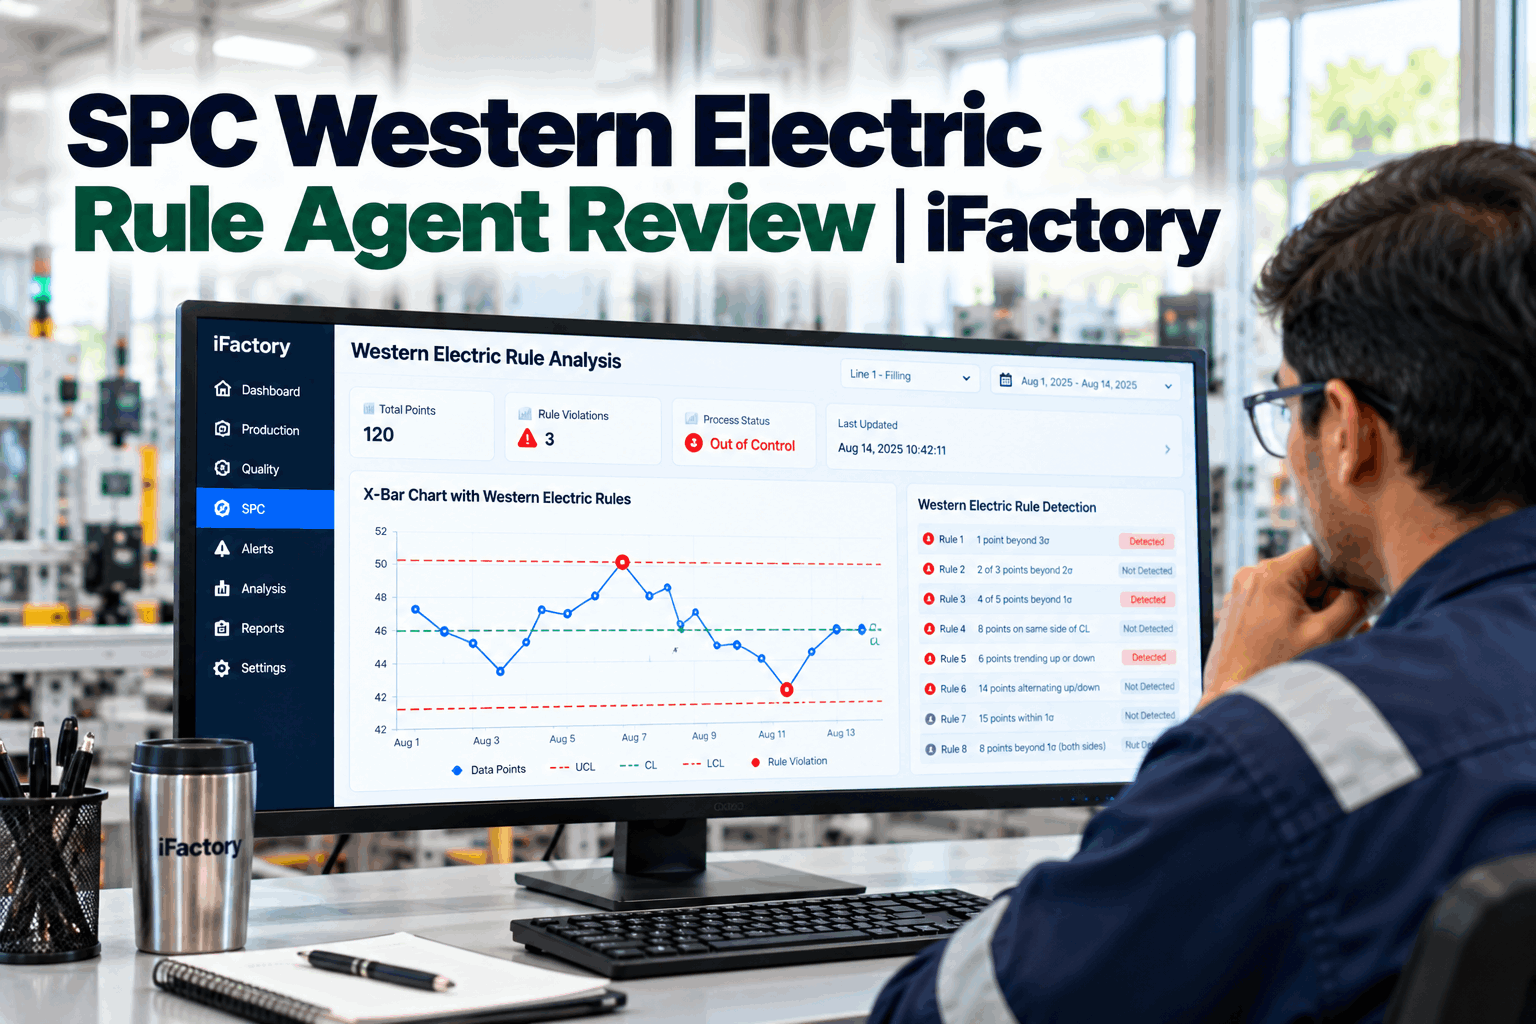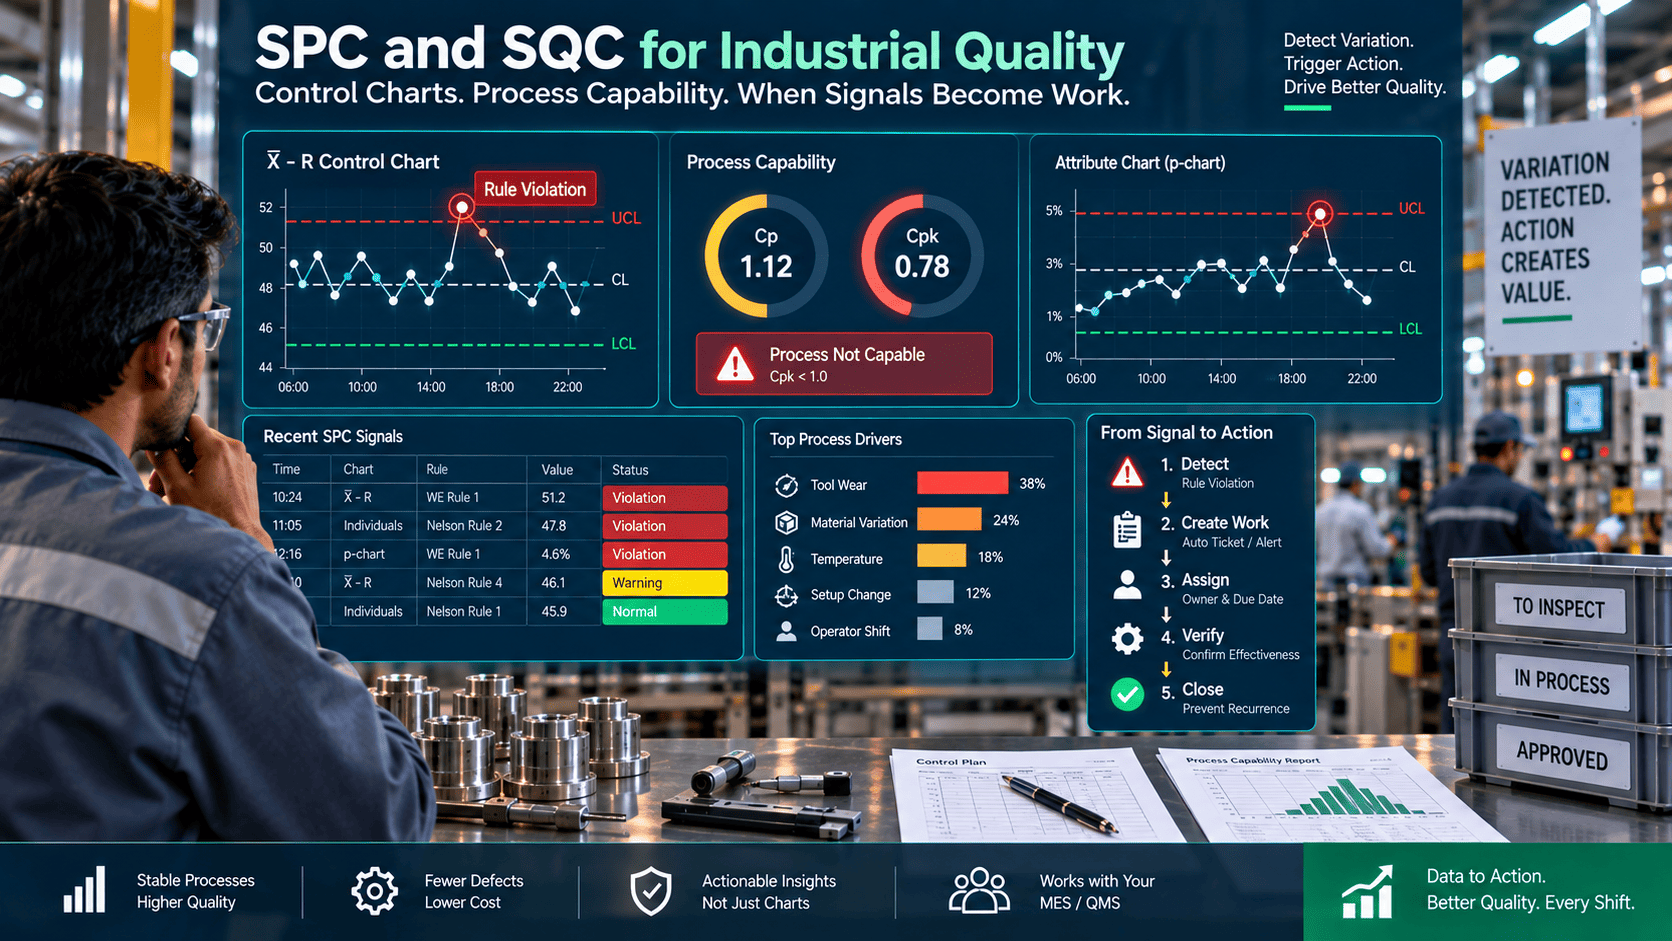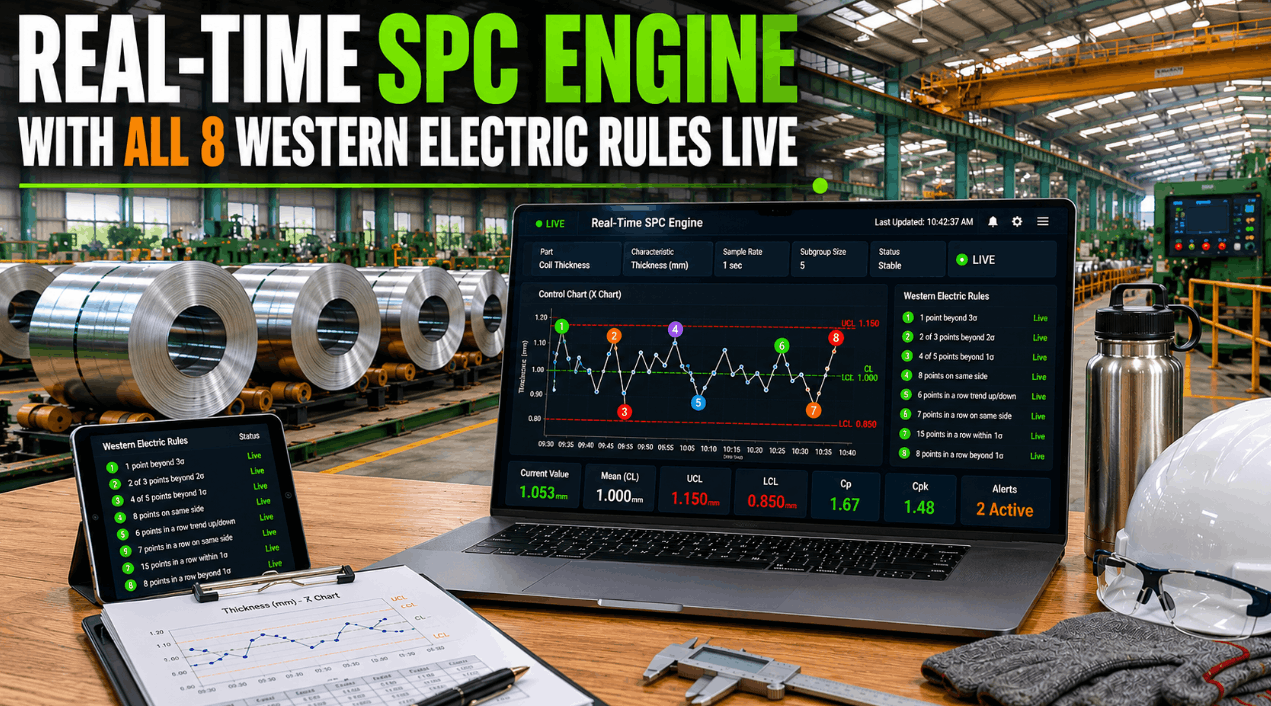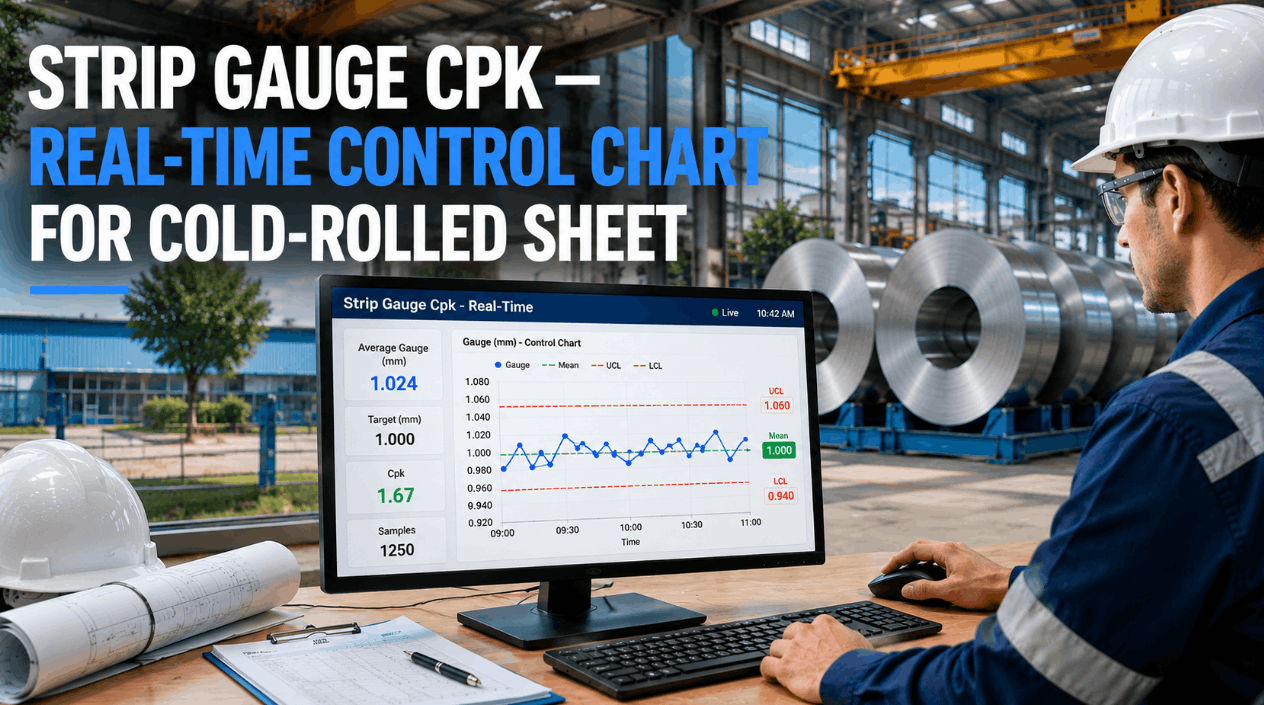
Every SPC package ships with the Western Electric and Nelson rules, and many plants leave them all switched on. The result is a chart that alarms several times a shift on a process that has not changed, and operators who learn — correctly — that most alarms mean nothing. The rules are sound. They were written for independent samples from one stream, and automotive processes are full of tool wear, every-part measurement and multi-cavity tooling that break that assumption. This guide explains what each rule detects, what each costs in false alarms, and how to match rules to the process. To have your own charts checked, book a rule audit.
Western Electric and Nelson Rules That Fire on Real Signals, Not on Noise
The right rule set depends on how the data is produced: how often, from how many streams, with what natural drift. iFactory replays your own history against each rule set, shows what would have signalled and why, and gives every rule an owner and a reaction.
- Rules matched to each process, not one default
- False-alarm cost shown before a rule is switched on
- A named reaction for every signal an operator sees
Why Operators Stop Believing the Chart
A control chart is a trade. Every rule added catches some real changes sooner and raises some alarms that mean nothing. With rule 1 alone, an unchanged process gives a false alarm about once in 370 points. With the four Western Electric rules it is about once in 91. Now take one machining cell with 40 charted characteristics, each plotting a point an hour for 20 hours a day: 800 points. That is about two false alarms a day on rule 1, nine on the four rules and eleven with all eight Nelson rules — before anything has gone wrong. An operator who investigates ten alarms and finds nothing ten times stops investigating. If your alarm log looks like this, our SPC engineers can review it with you.
Every rule left on
The software default is often all tests enabled. Nobody chose it; nobody has switched it off.
Rules that fight the process
A trend rule on a dimension that wears with the tool will fire on every tool life. It is reporting the design of the process.
Signals with no instruction
"Rule 6 violation" appears on the screen. Nothing says what it means, who should act or what to check.
Limits from the wrong data
Limits calculated from part-to-part ranges on every-part data sit far too tight, and every rule fires more often than the textbook says.
The Eight Tests, and What Each Means on an Automotive Line
Western Electric's 1956 handbook set out four zone rules — tests 1, 2, 5 and 6 here — and described the other patterns in words. Lloyd Nelson's 1984 list made all eight into explicit tests. They differ in one detail that matters: the same-side run is eight points in the Western Electric version and nine in Nelson's, and the AIAG SPC manual's summary lists seven. Check which your software uses before comparing alarm counts between plants. To go through the eight tests against your own charts, book a chart session.
One point beyond three sigma
A sudden event: a broken tool, a wrong component, a part not seated in the fixture, a gauge fault.
Nine in a row on one side
A sustained shift: a new coil or material lot, a tool offset, a setting left in place after changeover.
Six in a row rising or falling
Drift: tool or electrode wear, a temperature creeping, coolant or bath concentration changing.
Fourteen in a row zigzagging
Two streams taking turns — two spindles, two fixtures, two nests — or an operator over-adjusting.
Two of three beyond two sigma
A moderate shift caught early, on the same side of the centre line. The most useful partner to rule 1.
Four of five beyond one sigma
A small shift that has persisted, on the same side. Sensitive, and a frequent source of false alarms.
Fifteen in a row within one sigma
Limits too wide for the data: several cavities or spindles mixed inside each subgroup, or limits that are out of date.
Eight in a row beyond one sigma, both sides
A mixture: two populations on one chart, such as two cavities, two machines or two suppliers.
See What Each Rule Would Have Signalled on Your Own Data
Choose one cell. We load a few months of its SPC history, replay it against each rule set, and show which signals matched real events and which were noise — before any setting is changed on the floor.
What Each Rule Set Costs in False Alarms
These figures come from a simulation of 20,000 runs on independent, normally distributed data with no change in the process. They show the average number of points before the first false alarm. The two published values — 370 for rule 1 and 91.75 for the four Western Electric rules — are reproduced, which is a fair check on the rest. With all eight Nelson rules on, about 2.5% of points are flagged, arriving in clusters roughly once every 73 points. Our quality team can run the same comparison for your sampling plan.
Where the Standard Rules Go Wrong in Automotive Processes
The published false-alarm rates assume each point is independent of the last and comes from one stream. Many automotive measurements are neither. Every-part data is the starkest case: when each part resembles the one before it, limits calculated from part-to-part ranges come out too tight. In our simulation with a moderate correlation of 0.5 between neighbouring parts, the three-sigma limits sat at about 2.1 true standard deviations, rule 1 alone fired every 33 points, and the four Western Electric rules every 13. The remedy is rarely to switch rules off blindly. It is to chart the data in a way that restores the assumption. To map your characteristics to the right approach, book a process review.
Fastening torque, press-fit force, leak test, in-line gauging
Moulding, die casting, multi-spindle machining
Stamping, heat treatment, paint
Flatness, runout, position, cleanliness
Weld teardown, hardness, pull-out
Give Every Rule an Owner and a Reaction
A rule that signals without telling anyone what to do should not be on an operator's screen. The practical answer is to tier the rules: a few go to the operator with a specific reaction, more go to the engineer as notifications, and the rest are used only when someone sits down to analyse the process.
IATF 16949 expects a reaction plan for characteristics that are out of control or not capable. A rule that is enabled but has no defined reaction is a gap an auditor can see on the screen. This note paraphrases the standard; check the wording against your own copy.
What the AI Adds to Rule Setting
Choosing rules by hand for hundreds of characteristics is slow, so plants fall back on one default for all. iFactory's models run on a GPU server in your plant, read the SPC history for each characteristic, and do the first pass: what kind of data this is, which chart suits it, and what each rule set would have signalled.
- Classifies each characteristic. Independent or correlated, one stream or several, drifting or level, symmetric or skewed.
- Replays history. Each rule set is run against past data and its signals are matched to logged tool changes, lot changes and adjustments.
- Recommends, with reasons. A proposed chart type, rule set and limit basis for each characteristic, for an engineer to approve.
- Answers in plain language. Engineers ask why a chart alarmed and get the rule, the data and the events around it.
All Rules On, Rule 1 Only, and Rules Matched to the Process
Plants usually arrive at one of two positions: everything on, or — after the alarms become unbearable — everything off except rule 1. Both give something up. Our application engineers can show where your current settings sit.
Delivered as a Turnkey AI System — Hardware and Software Together
iFactory ships as a complete bundle: a pre-configured NVIDIA AI server, racked and ready, with the SPC engine and AI models pre-loaded. Rack it, plug in power and Ethernet, and the AI is live on your network — measurement data stays in your plant. Our team handles cabling, network setup, PLC and SCADA integration, links to your gauges, CMMs and existing SPC or MES data, operator training and 24×7 remote monitoring. For a scoped proposal, book a deployment call.
Ship, network and data
Server delivered and racked. SPC history, limits and current rule settings loaded for the first cell. Tool, lot and setting-change logs connected.
Model training and pilot
Each characteristic classified and replayed. Recommended charts and rules reviewed with your engineers, then run in parallel with the existing settings.
Go-live and training
Approved rule sets and reaction plans go live. Operators and engineers trained on what each signal means. Remaining cells follow the same route.
Frequently Asked Questions
What is the difference between the Western Electric and Nelson rules?
Western Electric's 1956 handbook defined four zone rules: one point beyond three sigma, two of three beyond two sigma, four of five beyond one sigma, and eight in a row on one side. Nelson's 1984 set has eight tests, adding trends, zigzag patterns, points hugging the centre line and mixtures, and uses nine in a row for the same-side run.
Should we turn on all eight Nelson rules?
Not for routine monitoring. On an unchanged process, all eight flag about 2.5% of points and give a false alarm roughly every 73 points. All eight are useful when an engineer is studying a process; on the shop floor, a small set with a defined reaction for each rule works better.
Which rules are a sensible starting point?
Rule 1 for every chart, plus one rule for shifts: rule 5 for speed or rule 2 for sustained changes. Add rule 6 where sampling is infrequent and each point is costly. Add others only when replaying your own data shows they catch real events.
Why does our tool-wear chart alarm constantly?
Because the dimension is meant to drift between tool changes, and the trend and same-side run rules are designed to detect drift. Chart the deviation from the expected wear slope instead, or use limits that allow for the slope, and keep rule 1 on that chart.
Do the rules work on every-part data from in-line gauges?
Not directly. Neighbouring parts are usually alike, which makes limits based on part-to-part ranges too tight and causes every rule to fire far more often than the published rates. Subgrouping over time or an EWMA chart with appropriate limits restores a usable false-alarm rate.
Does the customer or IATF 16949 require specific rules?
IATF 16949 expects statistical tools to be applied and understood and a reaction plan for out-of-control conditions; it does not name a rule set. The AIAG SPC manual lists typical special-cause criteria and leaves the choice to the process. Some customer-specific requirements go further, so check yours.
How long does deployment take, and what do we need to provide?
A typical cell is live in 6–12 weeks. You provide rack space, power, an Ethernet connection, access to SPC history and current settings, tool and lot change logs, and a process engineer for the pilot. iFactory supplies the pre-configured NVIDIA AI server, software, integration and training. To scope your plant, contact our project team.
Fewer Alarms, and Every One Worth Answering
One turnkey system — NVIDIA AI server, SPC engine, integration and training — delivered and live inside 12 weeks. Start with the cell whose alarm log nobody reads any more.
- 1Which rules are on, and who chose them?
- 2Is the same-side run seven, eight or nine points?
- 3Are neighbouring points independent?
- 4Is more than one stream on the chart?
- 5Does every enabled rule have a reaction?