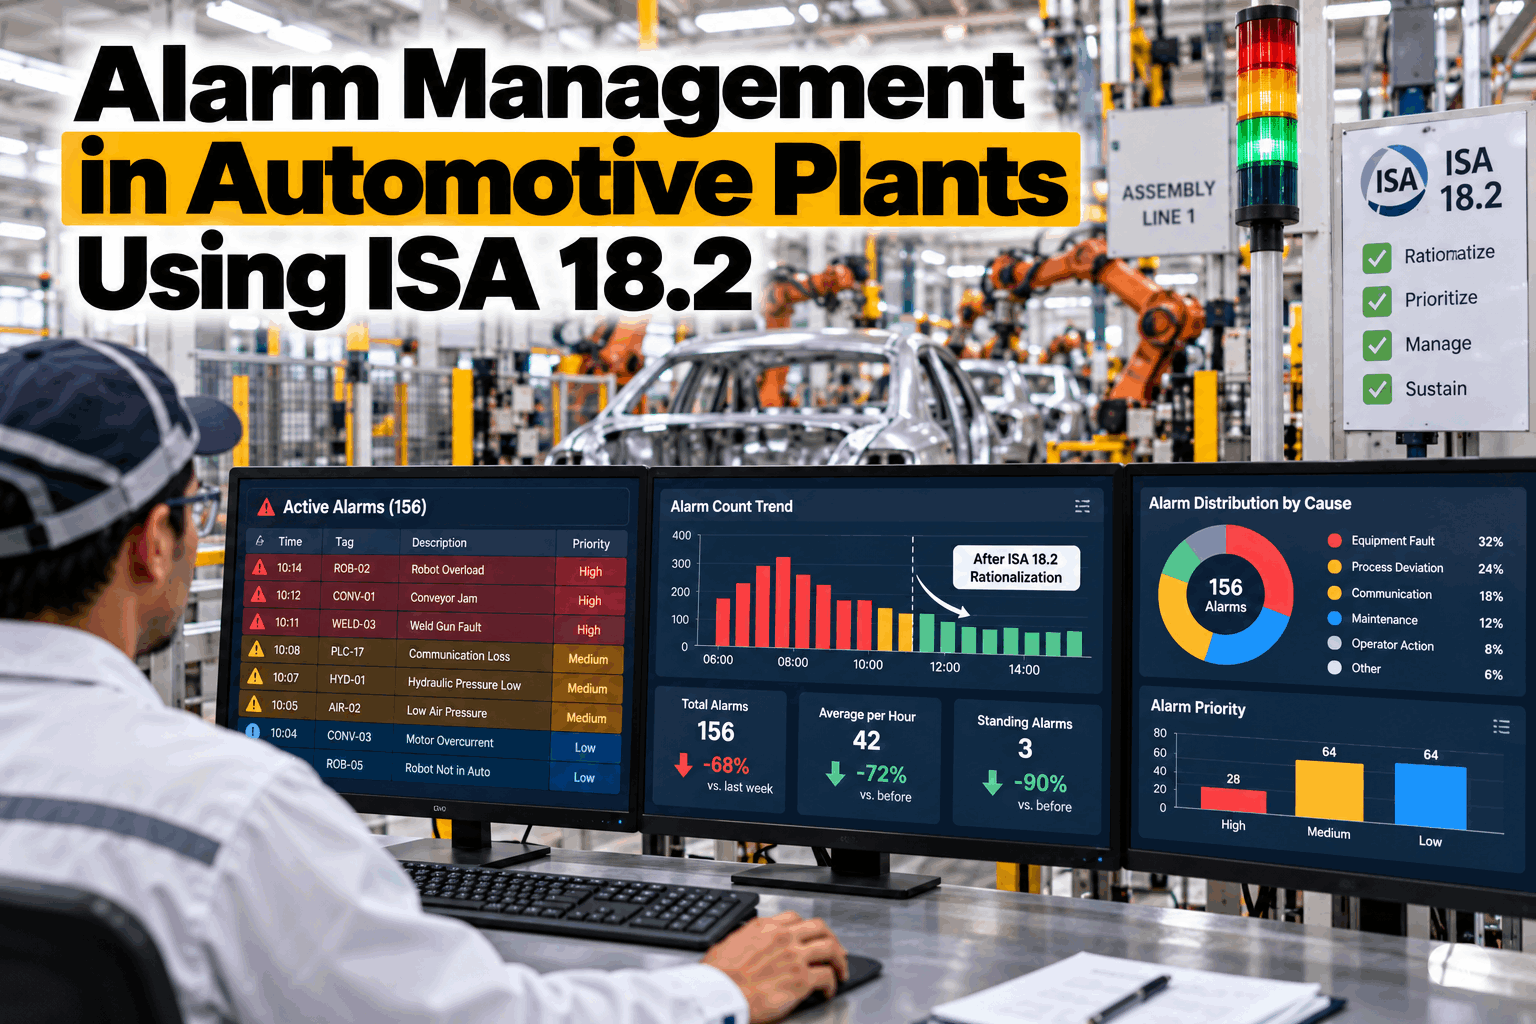
An operator who sees 35 alarms an hour cannot treat each one as a call to act. Most get acknowledged and ignored, and the one that matters sits in the same list as the other 34. Automotive plants have the same problem as process plants, spread across press, body, paint and assembly lines, with PLC, SCADA and DCS systems each raising their own alarms. ISA 18.2 gives a way to fix it: treat the alarm system as something managed through a lifecycle, rationalize every alarm and measure the load against clear targets. This guide shows how to apply ISA 18.2 alarm management in an automotive plant, where the noise comes from and how to cut it without losing the alarms that matter. To see how this looks on your own alarm data, book an alarm load walkthrough.
Alarm Management in Automotive Plants Using ISA 18.2
A practical guide for operators and control teams: how to apply ISA 18.2 to automotive lines, find the alarms that flood the operator and rationalize the list so every alarm earns its place.
- How ISA 18.2 applies to PLC, SCADA and DCS alarms on automotive lines
- Where press, body, paint and assembly areas flood the operator
- How to rationalize alarms and track the KPIs that prove it
Four causes explain more than four fifths of the alarms, and only 20 of the 280 called for an operator response. The dashed line marks where the cumulative share passes 80%. Chattering alarms repeat on the same tag, consequential alarms follow one upstream fault, and alarms not suppressed fire during maintenance or start-up.
What ISA 18.2 Asks For
ISA 18.2 treats alarms as a managed system with a lifecycle, not as a list of tags.
ISA 18.2 is the standard for the management of alarm systems. It was written for the process industries, and the same lifecycle applies to automotive lines, paint shop ovens and plant utilities. It asks you to define an alarm philosophy, rationalize each alarm, design and implement it, then monitor, change and audit it over time. Our alarm analytics team can show how this maps to the control systems on your lines.
Agree the rules
What counts as an alarm, how it is prioritized and how it is reported.
Justify every alarm
Purpose, consequence, response and time to act, recorded for each one.
Set it in the system
Limits, priorities, grouping and suppression, built to the agreed design.
Measure and control
KPIs by position, with every change approved and logged.
An alarm should call for an operator response, with a known consequence and a time to act. A message that needs no response is information, and it belongs on a status screen, not in the alarm list.
Where Automotive Plants Flood the Operator
Each area floods in its own way.
A typical plant runs a press shop, a body shop with weld and robotics cells, a paint shop, final assembly and a set of utilities. Alarms come from PLCs, robot controllers, SCADA and DCS packages, often with different naming and priorities in each. Start with the position that carries the heaviest load. To see which one that is, book an alarm load review.
When a conveyor trips, a dozen downstream alarms can follow within seconds. Group or suppress the consequential ones in the design, so the operator sees the cause first instead of sorting through the effects.
Set the Alarm KPIs Before You Change Anything
You cannot cut noise you have not measured.
ISA 18.2 and the older EEMUA 191 guidance point to a small set of KPIs measured for each operator position. Take a baseline first, so every change can be checked against it. The targets below are common reference values, so confirm them against your own alarm philosophy.
A plant average hides the overloaded desk. A paint shop control room and an assembly station carry different loads, so set and track the targets for each position.
What One Quieter Operator Position Looks Like
Removing the noise does not remove the alarms that matter. It leaves them visible. When four in five alarms are chattering, consequential, badly set or never acted on, rationalizing them gives the operator back time and attention for the faults that need a response.
From Alarm Flood to a Rationalized List
Every alarm needs a purpose, a consequence and an owner.
Rationalization is the step that turns a flooded list into a working one. For each alarm you record why it exists, what happens if it is missed, what the operator should do and how long they have. Alarms that fail this test are removed, regraded, grouped or suppressed by plant state, and each change goes through your change process.
Collect
Alarm and event logs from every system.
Rank
Bad actors and floods by position.
Rationalize
Purpose, consequence and response.
Set
Limits, priorities and grouping.
Approve
Change control and a logged record.
Verify
KPIs checked against the baseline.
Common Alarm Management Mistakes
Most alarm projects fail by silencing alarms, not by rationalizing them.
It is easy to make the list shorter and hard to make it safer. A few simple rules keep the operator's trust in the alarm system.
Good practice
- Rationalize before changing any limit or priority
- Track the KPIs for each operator position
- Review the top ten bad actors every week
Common mistakes
- Widening limits just to stop the noise
- Suppressing alarms with no approval or record
- Mixing status messages with true alarms
Shelve or suppress an alarm only with a reason, an owner and a time limit, and log it. An alarm switched off quietly during a bad week is often still off a year later.
How iFactory Alarm Analytics Works
Alarm data in, ranked bad actors out.
iFactory collects alarm and event data from your PLC, SCADA, DCS and historian systems and calculates the ISA 18.2 KPIs by operator position, area and shift. It finds chattering, standing and consequential alarms, ranks the bad actors and tracks each change against the baseline. It runs on an on-prem server inside your network, with one view across all lines and sites. Your control engineers still make and approve every change to limits and priorities. Questions on fit go to our support desk.
All alarm sources
Alarm and event logs from PLC, SCADA, DCS and historian systems.
ISA 18.2 KPIs
Alarm rate, floods, standing alarms and priority split by position.
Bad actors
Chattering and consequential alarms ranked by how many they add.
Every change
Each rationalization checked against the baseline, with a record.
Results depend on your lines, your control systems and how quickly alarms are rationalized. We measure the baseline and the effect of each change on your own data during the pilot, rather than promising a general figure.
Turnkey AI: Delivered, Connected and Live in 6–12 Weeks
You do not build this. It arrives ready.
iFactory ships as a pre-configured NVIDIA AI server with the software pre-loaded. Rack it, plug in power and Ethernet, and the AI is live on your network. Our team handles cabling, network setup, PLC and SCADA integration, team training and 24×7 remote monitoring. Data stays on your own network. For a scope matched to your plant, request a turnkey quote.
Ship, network and alarm feeds
Server installed. Alarm and event feeds connected for the pilot area.
Baselines and bad actors
KPI targets agreed. Baselines checked and the first bad actor list reviewed with your teams.
Go-live and training
Dashboards and reports live. Teams trained. 24×7 remote monitoring begins.
Frequently Asked Questions
What is ISA 18.2?
ISA 18.2 is the standard for the management of alarm systems in the process industries. It sets out a lifecycle from philosophy and rationalization through to monitoring, change control and audit.
Does ISA 18.2 apply to automotive plants?
It was written for process plants, but the lifecycle and the KPIs carry over well to automotive lines, paint shop ovens and plant utilities. Treat it as a framework and adapt the targets to your own alarm philosophy.
What is an alarm flood?
A flood is a burst of alarms the operator cannot realistically handle. A common definition is more than 10 alarms in 10 minutes. Floods usually follow one upstream fault, such as a conveyor or oven trip.
How many alarms per hour is acceptable?
A commonly used reference is about 6 per hour per operator position, with up to 12 still manageable. Your own target depends on the work the operator does, so agree it for each position.
Which alarms should we fix first?
The bad actors. A small number of chattering and consequential alarms usually produces a large share of the total, and removing them carries the least risk because they rarely call for an action.
How do we start?
With one operator position that carries the heaviest load. A 6-week pilot connects the alarm feeds, takes a KPI baseline and shows the first ranked bad actor list. To plan it, contact our team.
Know Which Alarms Your Operators Actually Need
In thirty minutes we look at your alarm logs, your operator positions and how alarms are managed today. You keep the notes whether or not you go further with iFactory.
- 1A month of alarm and event log exports
- 2The alarm list with limits and priorities
- 3A map of operator positions and areas
- 4The nuisance alarms operators complain about most
- 5Past incidents where an alarm was missed