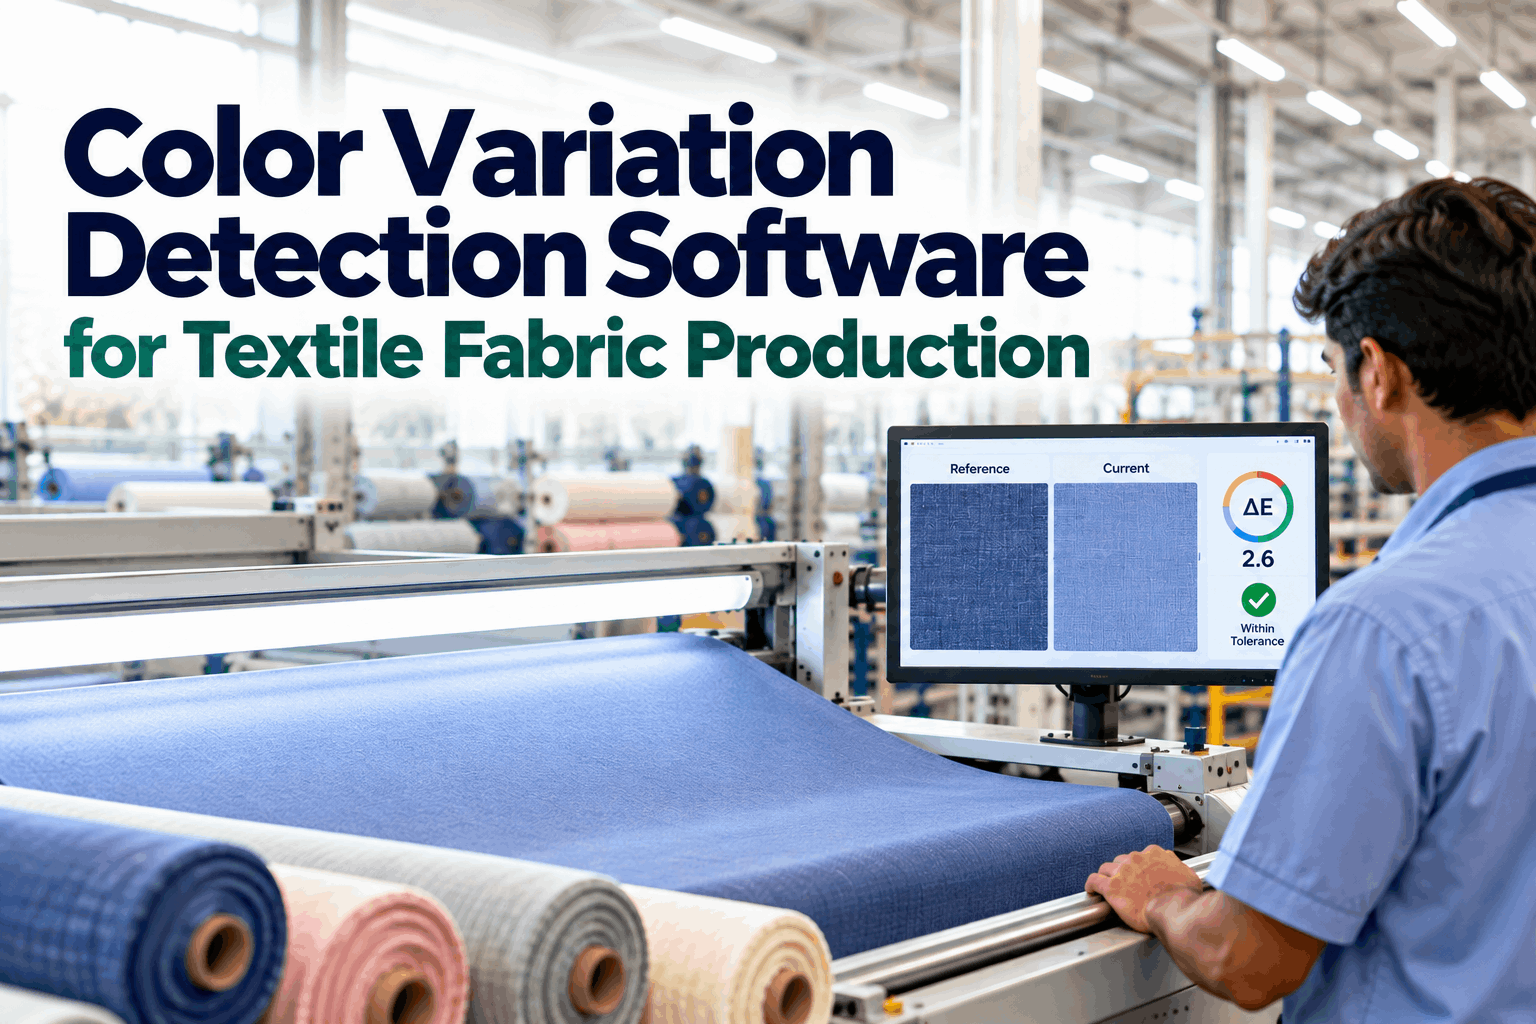
Color variation is the textile defect that hides best and costs most once it is found. A roll can pass every four-point check, look fine on the inspection frame and still produce garments where the sleeve does not match the body. By then the fabric has been cut, sewn and sometimes shipped. Catching shade problems early means measuring color along and across every roll, grouping rolls into shade bands, and keeping each garment inside one band. This guide explains how color difference is measured, which variations matter, how to set realistic tolerances and where inline detection fits. To see shade mapping on your own fabric, book a short walkthrough.
Color Variation Detection for Textile Fabric: Catch Shade Problems Before Cutting
Shade measured along and across every roll, sorted into bands and tied to dye lots, so garments are cut from fabric that matches.
Why Shade Problems Surface Too Late
Most defects are local: a slub, a hole, a stain. Color variation is different. It is a gradual difference spread over meters of fabric, and the eye is poor at judging gradual change. An inspector watching fabric move past a frame sees each meter against the one before it, not against the start of the roll. A slow drift from one end to the other can pass unnoticed even when the two ends clearly differ side by side.
The problem becomes visible in the cutting room and the finished garment. Panels for one shirt are cut from different parts of a lay, sometimes from different rolls. If the shade varies, the front and back or the sleeve and body no longer match. Cutting rooms guard against this with shade bands, but bands are only as good as the measurements behind them. When shade grouping is done by eye on a few swatches, errors slip through.
Measuring color continuously, with an instrument rather than the eye, moves detection to the earliest point. We can show how that works with your fabrics on a call.
How Color Difference Is Measured
Color difference is measured in a color space where distances roughly match what people see. The result is a single number, Delta E, that says how far a sample is from a standard. Different formulas weight lightness, chroma and hue differently, which is why the formula must always be named with the number.
There is no universal pass limit. A Delta E CMC of 1.0 might be fine on a mid-shade workwear fabric and too loose for a fashion basic. The right limit comes from the customer standard and visual trials, which our specialists can help you run.
Grouping Rolls So Garments Match
Even a well-controlled dye lot contains some variation. Shade banding accepts that and manages it: every roll is measured, rolls with very similar color are grouped into bands, and the cutting room keeps each garment, and ideally each lay, inside one band.
Illustrative grouping. Bands are built from measured color on each roll, not a visual judgment on a single swatch, so rolls in the same band can be cut together safely.
Two things make banding reliable. First, the measurement has to represent the whole roll, not just the first meter. A roll that drifts end to end needs readings along its length, and a roll with side-to-center variation needs readings across the width. Second, the band limits must be tighter than the customer tolerance, so two rolls at opposite ends of one band still match each other.
Band labels should travel with the roll: printed on the roll ticket, stored in the roll record and passed to cutting planning, so nobody has to re-check shade at the spreading stage.
When bands come from continuous measurement, the cutting room gets a band label it can trust, and fewer lays are mixed by mistake. That is the core of a good shade system.
Spot Checks Versus Continuous Measurement
Most mills already measure color with a lab spectrophotometer. The question is how much of each roll the measurement actually represents.
- One or two swatches cut from each roll end
- Accurate at the point measured
- Misses end-to-end drift inside the roll
- Side-to-center only if extra swatches are taken
- Results arrive after the roll is finished
- Banding based on a few points
- Readings at intervals along the full roll length
- Several points across the width
- Drift visible as it develops
- Side-to-center measured on every roll
- Alerts while the roll is still running
- Banding based on the whole roll
Inline measurement does not replace the lab. The lab spectrophotometer stays the reference for approving standards, checking recipes and settling disputes. Inline readings add coverage, and the two should be checked against each other regularly so they agree.
Sample conditioning matters for both. Fabric measured warm off a stenter reads differently from fabric that has cooled and regained moisture, and some dyes shift noticeably as they settle. Inline readings are therefore compared against a conditioned lab reading of the same roll, and the offset between them is tracked. If the offset starts to wander, the sensor needs cleaning or recalibration before anyone trusts its bands. Treating inline and lab readings as two views of the same truth, rather than competing numbers, keeps the dyehouse and the QC lab working from one standard.
Many mills start inline measurement at final inspection, then move a sensor to the stenter exit once the value is proven. Ask our engineers which point fits your process.
What Inline Color Monitoring Watches For
Inline color monitoring is not only about pass or fail. The pattern of the variation points to its cause, which is what the dyehouse and finishing teams need.
Left or right selvage lighter or darker than center points to padding pressure, uneven drying or tension.
A steady trend from start to end suggests bath exhaustion, temperature drift or speed changes.
A jump at one point often marks a machine stop, a batch join or a recipe correction.
Regular bands can come from roller or drum faults and repeat at a fixed distance.
Rolls from the front and back of a dye batch differing points to circulation or loading.
A whole lot moving away from standard points to recipe, dyes or water quality.
Each pattern is logged with its position on the roll, so the finishing team can see exactly where and when it started. That link is covered in a short demo.
Setting Shade Tolerances That Hold Up
A tolerance that is too tight rejects good fabric. One that is too loose lets mismatched garments through. This checklist helps set limits you can defend with buyers.
Tolerances are a commercial agreement as much as a technical one. Our team can help turn buyer requirements into limits the software enforces.
How iFactory Delivers Color Variation Detection
Measurements across the width and along the length of each roll.
Delta E limits per customer, fabric and formula.
Rolls grouped into shade bands from whole-roll data.
Selvage shading, drift and steps flagged while rolls run.
Every reading tied to its batch, recipe and machine.
Band labels and roll lists passed to cutting planning.
It works alongside your lab spectrophotometer and color software rather than replacing them. See the shade map on your own fabric in a session.
Map the Shade of Every Roll in One Dye Lot
Pick one article and one dye lot. We measure every roll along and across its width, build shade bands and compare the result with your current banding.
Side-to-center shift rising along the roll. Right selvage is now outside the agreed tolerance against the approved standard.
A Shade Problem Caught Before Cutting
This exchange shows how a finishing supervisor might use iFactory during a navy twill run.
iFactory ships as a pre-configured NVIDIA AI server, racked and ready with the color variation and shade banding models loaded. Rack it, plug in power and Ethernet, and the AI is live on your network. Our scope covers cameras and lighting on inspection frames and finishing lines, PLC/SCADA and ERP integration, cabling and network setup, operator and QC team training, and 24×7 remote monitoring.
Server installed, cameras and lighting mounted, historical inspection and defect records loaded.
Models trained on your own fabrics and styles, then piloted on one line with your QC team reviewing every call.
Rollout to the agreed lines, inspector and supervisor training, ERP hand-off and 24×7 remote monitoring in place.
Instruments, software and integration come as one package. For a quote scoped to your lines, contact our sales team.
Frequently Asked Questions
It is any difference in shade within a roll, between rolls or between dye lots. The common types are side-to-center shading across the width, end-to-end drift along the length, roll-to-roll differences within a lot and lot-to-lot differences against the standard.
CMC 2:1 is widely used for textile quality control and is described in ISO 105-J03. CIEDE2000 tracks perception more closely for very similar colors. The key is to name the formula and use the same one throughout.
There is no single limit for all textiles. The right limit depends on the fabric, shade and customer. Many teams start from the customer tolerance, run visual trials and set shade band limits tighter than the customer limit.
Shade banding groups rolls with very similar color so the cutting room can keep each garment inside one band. It prevents mismatched panels, such as a sleeve that differs from the body.
No. The lab instrument remains the reference for standards and disputes. Inline measurement adds coverage along and across every roll, and the two should be compared regularly.
Most rollouts take 6–12 weeks, from installation and calibration through a pilot on one line to full go-live and training. Our engineers can plan the steps with you.
Cut Garments From Fabric That Matches
iFactory measures every roll, sorts it into shade bands and flags drift while it runs, so color problems are fixed in finishing instead of found in finished garments.
Cutting keeps each garment inside one band, so panels match on the finished piece.