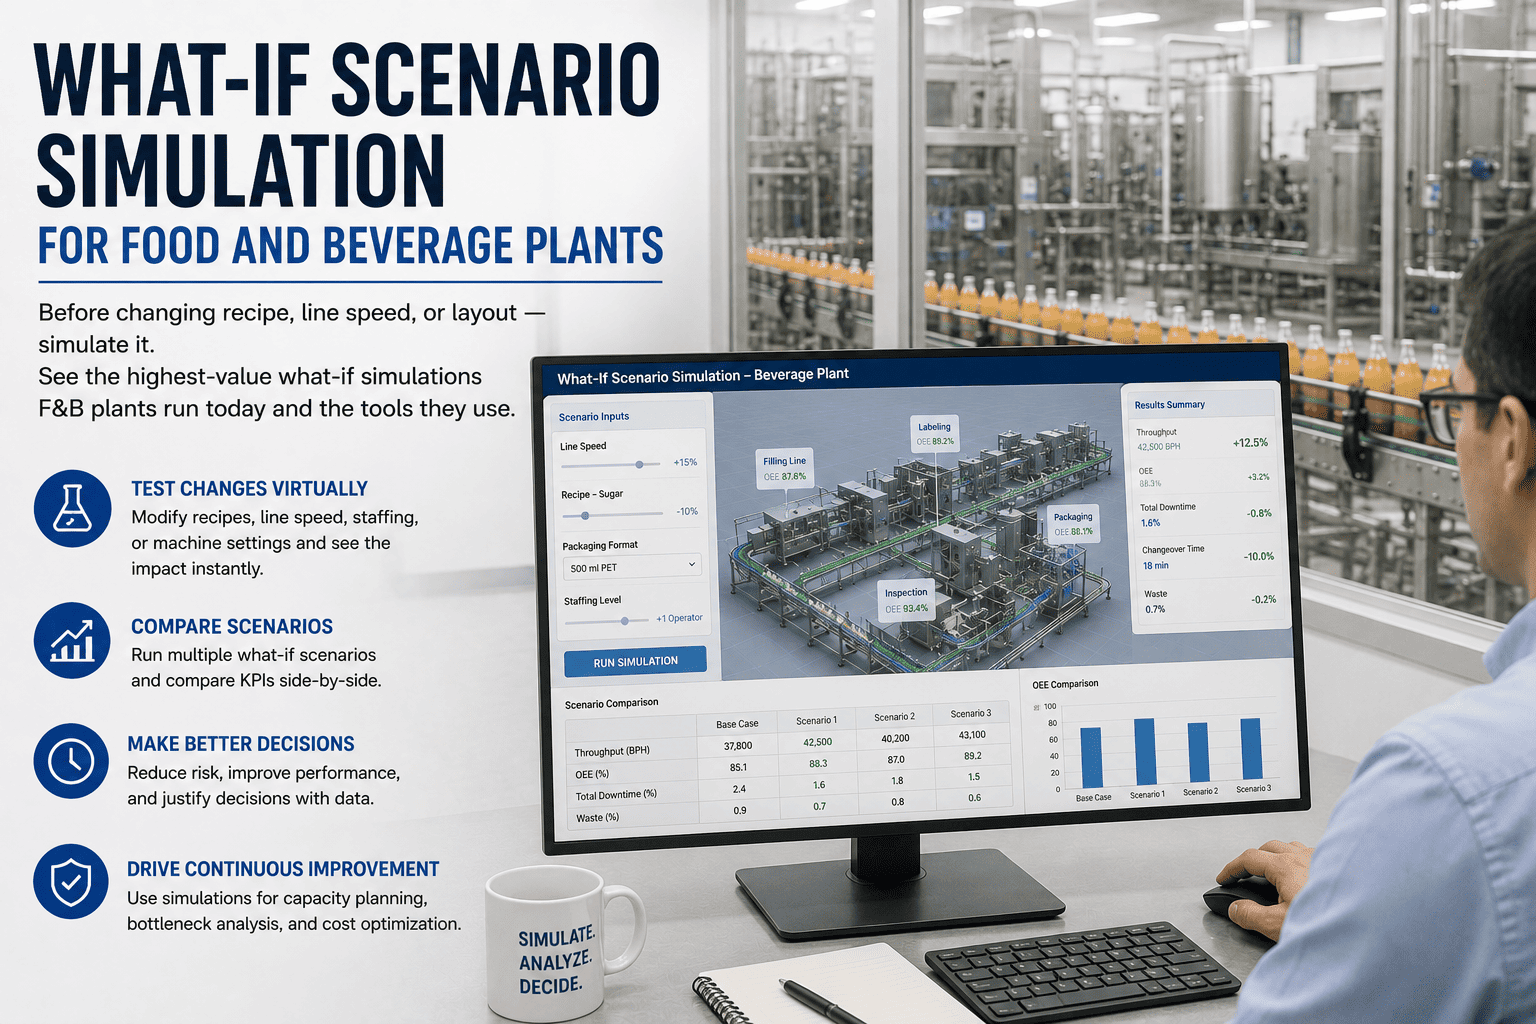
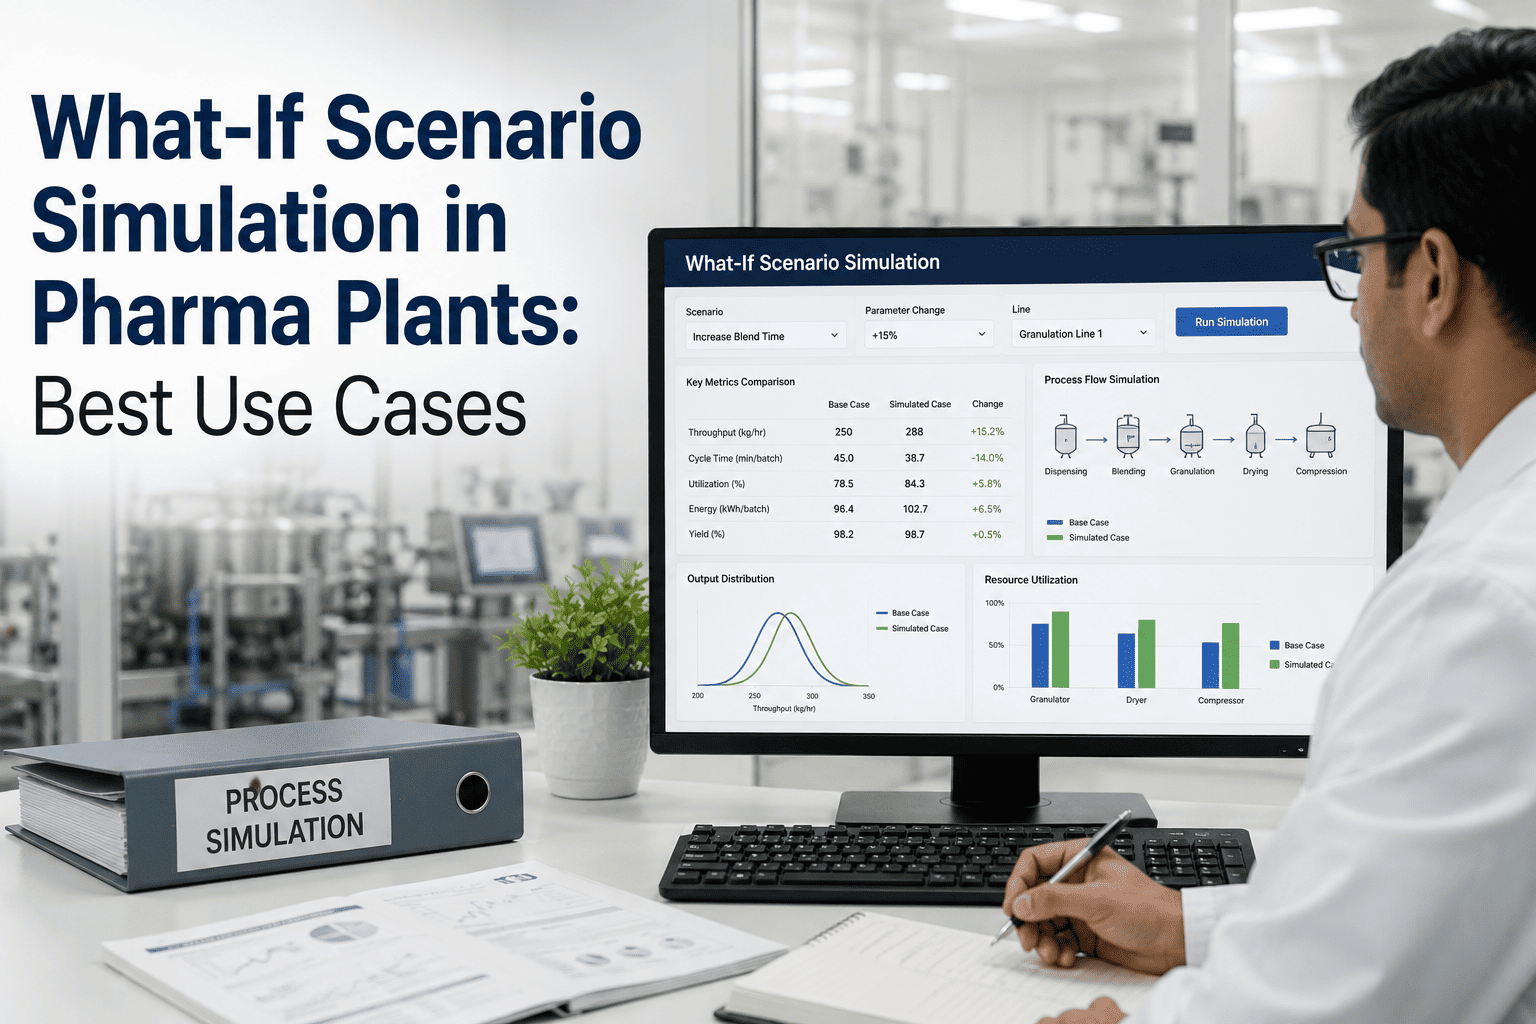
The most expensive way to find out whether a change works is to make it on the live line. Reformulate a recipe and discover it fouls the heat exchanger faster; push the filler 8 percent faster and watch the capper become the new bottleneck; re-sequence the day's SKUs and lose two hours to changeovers you didn't see coming. Every one of those answers exists in a model before it exists on the floor. What-if scenario simulation lets a process engineer run the change virtually — recipe, line speed, layout, schedule, or capex — measure the result within a few percent of reality, and commit only the version that actually wins. This guide walks through the highest-value what-if simulations food and beverage plants run today, the data each one needs, and the tools behind them. To see one modeled on your line, book a demo.
PROCESS & ENGINEERING · FOOD & BEVERAGE · SCENARIO SIMULATION
Run the Change Virtually First — Then Commit Only What Wins
Recipe, line speed, layout, scheduling, capex: every high-stakes food and beverage decision can be tested as a what-if scenario before a single machine moves. See the simulations that pay back fastest, the data they need, and how to start.
WHY SIMULATE INSTEAD OF JUST TRYING IT
Manipulating a Model Is Far Cheaper Than Manipulating the Plant
The core logic of scenario simulation is simple: changing a virtual model costs a re-run, while changing the real line costs material, runtime, and sometimes a whole production window. That gap is where the return comes from — and documented food-plant simulation projects show how large it can be.
$3.8M
Annual savings from one food-plant simulation study — 50% changeover-time cut and 20% packaging-waste reduction without added staff
25–40%
Changeover-time reduction typically found at the constraint when simulation guides an SMED program
5–15%
OEE improvement plants report once simulation identifies the true bottleneck rather than the assumed one
3–5%
How close a well-calibrated model predicts actual throughput, when built on real cycle and downtime data
THE SIX HIGHEST-VALUE WHAT-IF SIMULATIONS
The Scenarios Food and Beverage Plants Run Most
Not every question is worth a model, but these six recur across dairy, beverage, and packaged-goods plants because each one is expensive to get wrong on the real line and cheap to answer in simulation. Each answers a specific decision a process or engineering team faces.
01
Recipe & Formulation Change
"If we change this formula, what breaks downstream?"
A new recipe changes viscosity, fill behavior, thermal load, and fouling rate. Simulation shows how the change ripples into fill accuracy, pasteurizer duty, and CIP frequency before a single batch is run, so a reformulation is validated against the whole line rather than tested at the tank and hoped through the rest.
02
Line-Speed Increase
"If we speed up the filler, does throughput actually rise?"
Pushing one station faster often just relocates the constraint to a more expensive place. A model tests whether the capper, labeller, and accumulator can absorb the increase, or whether the extra speed is lost to downstream starvation and blocking — the difference between real output gain and wasted energy.
03
Layout & De-Bottlenecking
"Which constraint do we fix, and where does it move next?"
The instinct when demand rises is to buy capacity, but a buffer used only 20% of the time can throttle a whole line simply because everything waits on it at the wrong moment. Simulation finds the true constraint, tests an accumulator placement or conveyor addition, and shows where the bottleneck jumps once the first one is relieved.
04
SKU Sequencing & Scheduling
"What's the lot order that loses the least time to changeovers?"
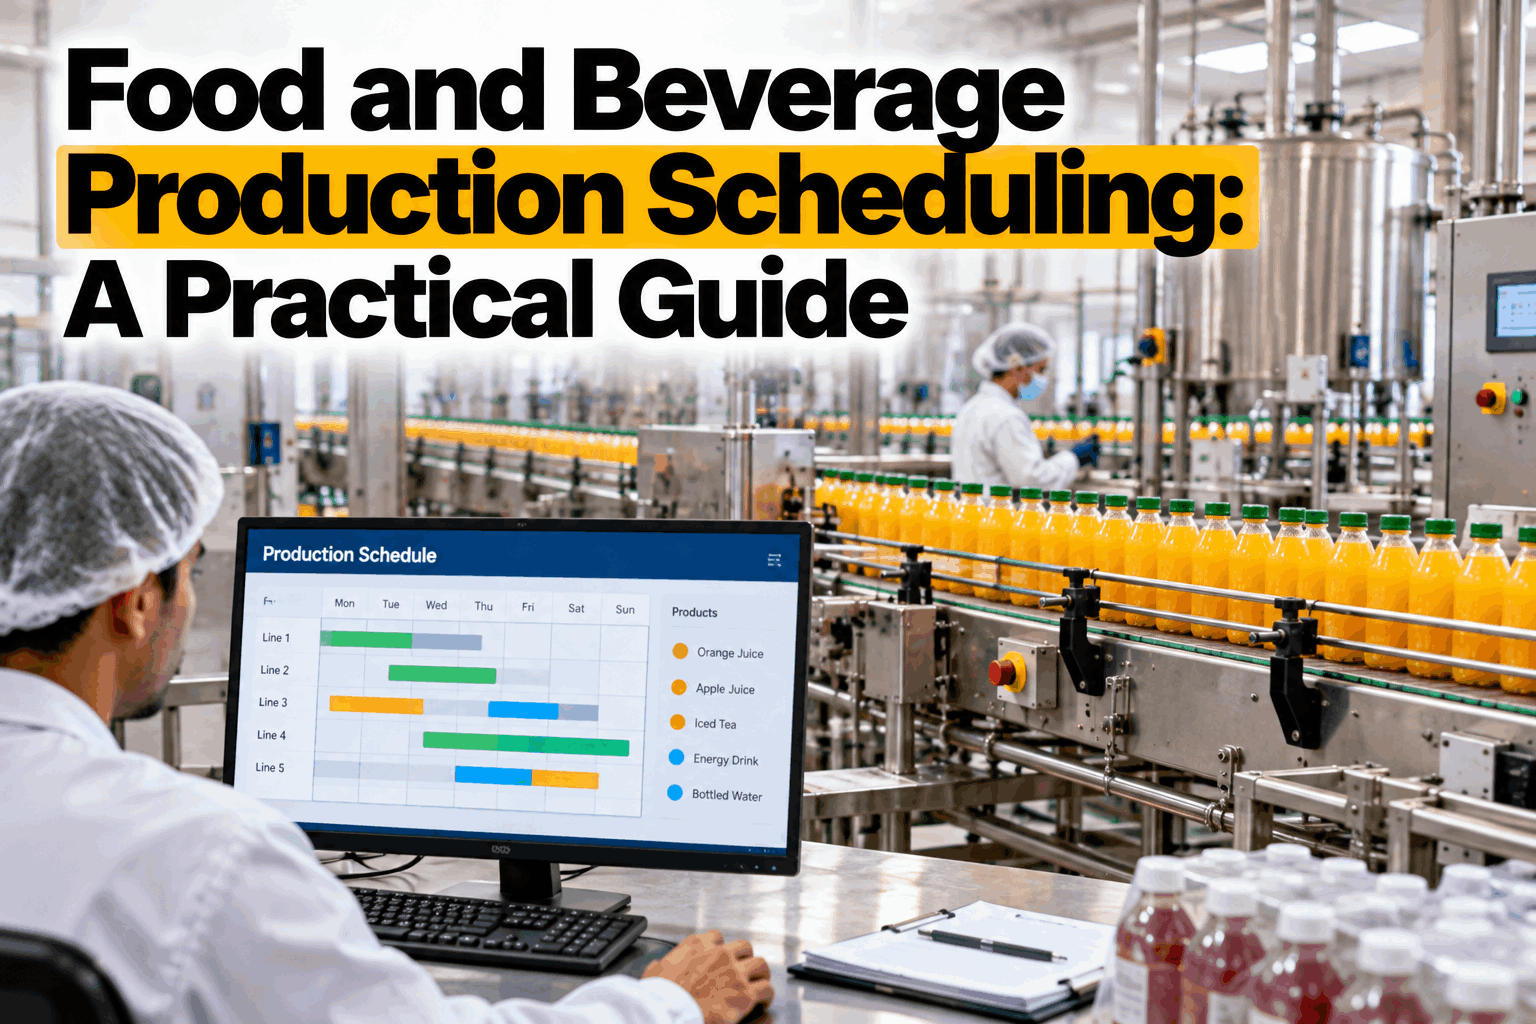
With sequence-dependent changeovers and cleaning constraints, the order products run in decides how much of the shift is lost to setup. A model tests lot sizing and sequencing against filling-line capacity and CIP rules, generating a near-optimal schedule that captures the planning team's know-how in minutes rather than a person's day.
05
Capex & New-Line Sizing
"Do we actually need to buy the bigger machine?"
Before scoping a capital project, simulation quantifies the throughput gain from cheaper tactics first, so the improvement team can find the minimum intervention that hits the target — and decide whether new equipment is even necessary. When it is, the model sizes and validates it, and one documented case used exactly this to support a plant expansion.
06
Demand & Shift Scenarios
"What happens if demand spikes or we add a third shift?"
Consumer volatility and retailer OEE penalties make rapid reconfiguration a competitive necessity. A model stress-tests a demand surge, a new shift pattern, or a seasonal SKU mix against asset utilization and failure risk, so the plant plans the response before the pressure arrives rather than reacting mid-crisis.
See which of these would pay back first on your line
iFactory scopes a what-if model around your highest-stakes decision — usually a changeover, speed, or capex question — and proves the answer against your own numbers before you commit.
WHAT MAKES A SIMULATION TRUSTWORTHY
The Data a What-If Model Needs to Match Reality
A scenario is only as good as the data behind it — and the single most common way simulations mislead is running on engineering-standard times or averages instead of what actually happens on the floor. A model built on these inputs predicts throughput within a few percent of reality.
Actual Cycle Times
Real per-station, per-product cycle times pulled from PLC or MES records — not engineering standards, which rarely match what the line does under load.
Downtime Logs
Event duration and cause codes over at least 90 days, so the model reflects the stoppages that actually erode output rather than an idealized run.
Changeover & CIP Times
Setup times by product-changeover type and real cleaning regimes, since these often decide more of the shift than the run itself.
Process Variability
Realistic variation, not just average times — because a model run on averages frequently points to the wrong bottleneck than the same model run with real spread.
Turn your next big decision into a tested one
Stop committing recipe, speed, layout, and capex changes on judgment alone. iFactory builds the model from your real data so the answer is measured, not guessed.
HOW TO START
Model One Line, Answer One Real Decision
The mistake is trying to model the whole plant at once. The pragmatic path proves value on a single question, then reuses and extends the model as the case for wider simulation builds itself.
1
Pick One Recurring Decision
Choose a single line, packaging area, or scheduling problem that comes up repeatedly and carries real cost — not the most complex question, the most frequently expensive one.
2
Pull the Real Data
Gather actual cycle times, downtime logs, changeover and CIP times, and the current schedule structure, so the model reflects the plant as it runs, not as the spec sheet describes it.
3
Validate Against a Known Baseline
Run the model against a period you already have results for and confirm it lands within a few percent, so its recommendations can be trusted before any real change rides on them.
4
Run the What-If and Act on It
Test the real decision, compare the scenarios, and implement the winning option — then measure the actual result against the model to keep it honest and improving.
5
Reuse and Extend
Keep the model live so it answers the next question too, and extend it to adjacent lines once the first decision has proven the approach on your own numbers.
FREQUENTLY ASKED QUESTIONS
What Process and Engineering Teams Ask About Scenario Simulation
How accurate is a what-if simulation really — can we bet a decision on it?
A model built on real cycle times and downtime data, rather than engineering standards, typically predicts throughput within 3–5% of actual results. The key is validation: before any decision rides on it, the model is run against a period you already have results for to confirm it matches reality. Accuracy comes from the input data and from modeling real process variability, not from the tool alone — a model run on averages can point to the wrong bottleneck entirely.
Do we need a data scientist to run scenarios, or can our planners use it?
Building the underlying model is an engineering job, but running scenarios on it does not require simulation expertise. Low-code scenario layers sit on top of the model so planners and operations teams can run what-ifs daily — testing a schedule or a speed change without touching the model's internals. The split matters: engineering builds and validates the model once, and the wider team reuses it for everyday decisions.
Can simulation handle continuous processes like milk or liquid lines, or only discrete units?
Both. Discrete-event simulation handles unit-by-unit flows like bottles and cases, while discrete-rate simulation extends the same approach to continuous flows using mass-balance logic — which is how dairy and liquid-beverage lines are modeled. A single model can combine continuous process elements and discrete packaging events, so a plant that pasteurizes in bulk and fills into units is represented end to end rather than split across two incompatible tools.
Why does simulation so often find a different bottleneck than we expected?
Because the constraint in a food plant shifts with product mix and only appears under realistic variability. A line configured for one pack size can run near full utilization while another format runs far below it, so aggregate line utilization hides the real SKU-dependent constraint. Running the model on average times alone frequently points to the wrong step; modeling the true variability reveals the one that actually limits the plant in practice, which is often not where the team assumed.
Is this worth it for a single decision, or only as a long-term platform?
Both models work. A one-time scenario study can justify itself on a single high-stakes decision — a capex avoidance or a changeover redesign — where the savings dwarf the modeling cost. But the larger return comes when the model stays live and keeps answering new questions as your product mix and demand change, so the same asset that settled one decision goes on de-risking the next. The right scope depends on how often you face expensive what-ifs.
TEST IT VIRTUALLY, COMMIT IT CONFIDENTLY
Answer Your Next What-If Before It Reaches the Floor
Recipe, line speed, layout, schedule, capex — every one of them is a question a model can answer first. iFactory builds the what-if simulation from your real data, so the change you make is the one the numbers already proved.