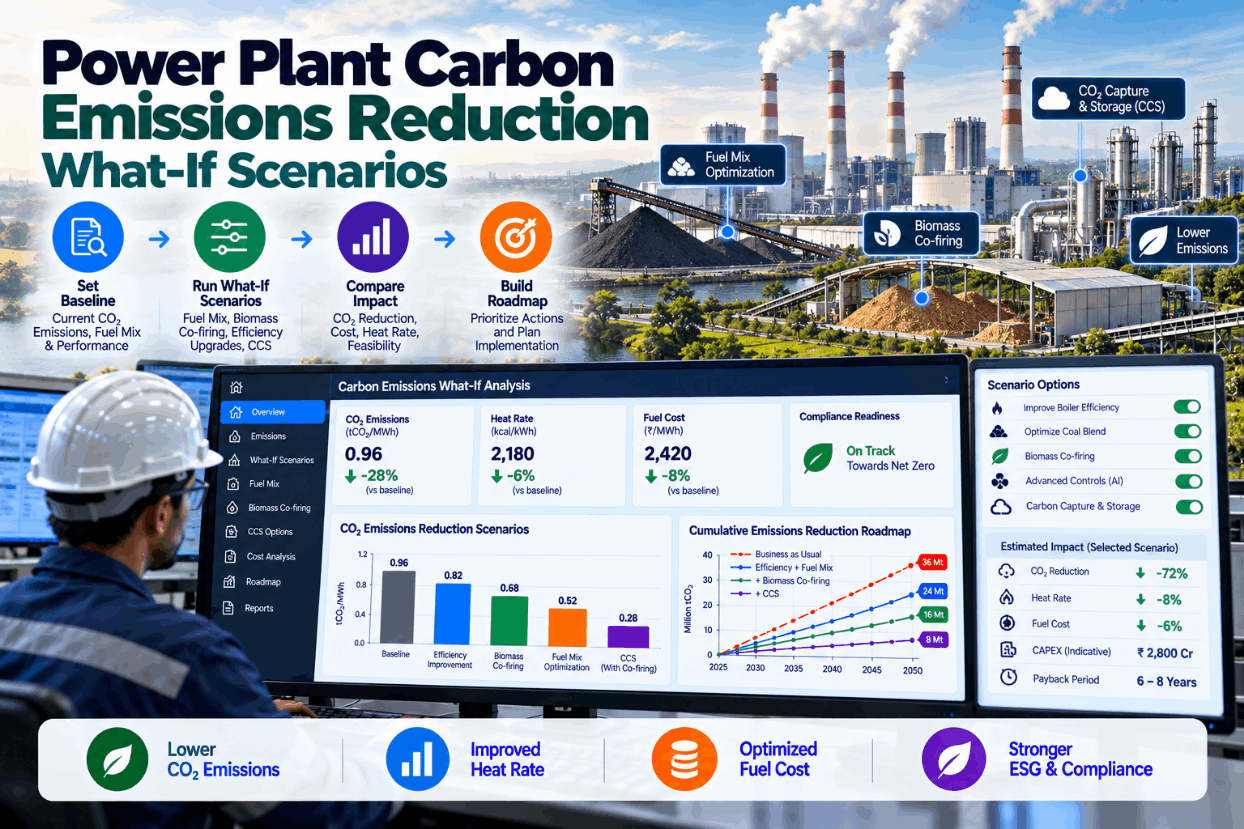
Coal plants face growing pressure to cut carbon, from national targets, lenders, customers and ESG reporting. The options are well known: run more efficiently, co-fire biomass, change the fuel mix, operate more flexibly alongside renewables, capture CO2 or retire units. What is hard is knowing which combination is credible for a particular plant, what each costs in money and output, and in what order to do them. What-if scenarios answer that by modelling each option against the plant’s own performance and constraints before anything is committed. This guide covers the levers, how scenario modelling works, the realities of biomass co-firing and carbon capture, and how to turn scenarios into a roadmap. To see a carbon scenario model, book a short walkthrough.
Power Plant Carbon Emissions Reduction: What-If Scenarios for a Credible CO2 Roadmap
Efficiency, biomass co-firing, fuel mix, flexible operation and carbon capture modelled against your plant’s real constraints, so the roadmap is built on numbers, not hopes.
Why Decarbonisation Plans Often Lack Credibility
Many coal plant decarbonisation plans list options without testing them. Biomass co-firing at a certain percentage, efficiency improvements, perhaps capture later. What is missing is the plant-specific view: can the mills handle biomass at that share, what happens to boiler efficiency and slagging, where does the biomass come from, what does capture do to net output and auxiliary power, and how do the options interact?
Policy is moving regardless. India’s Ministry of Power revised its biomass policy in June 2023, requiring 5% co-firing in thermal plants from FY 2024-25, rising to 7% from FY 2025-26, according to the Press Information Bureau. Elsewhere, lenders and investors increasingly ask for credible transition plans. A plan that has not been tested against the plant’s real constraints will not hold up to that scrutiny.
What-if scenarios turn a list of options into a tested roadmap. We can discuss your plant’s options on a call.
The Levers Available to a Coal Plant
Each lever reduces CO2 in a different way, at a different cost, on a different timescale.
Every percent of heat rate recovered cuts CO2 per MWh by roughly the same percent, at low cost.
Replaces part of the coal heat input with biomass pellets or residues, subject to supply and boiler limits.
Higher quality or washed coal improves efficiency; gas conversion changes the emissions profile entirely.
Supporting renewables changes running hours and load profile, and with it emissions and efficiency.
Captures most CO2 from flue gas but consumes significant energy and capital.
Older units may be retired or repurposed, for example as synchronous condensers or storage sites.
Efficiency is the cheapest lever and makes every other lever more effective, because each MWh then needs less fuel of any kind. It belongs in every scenario. See an efficiency-first roadmap in a demo.
How What-If Carbon Modelling Works
A useful scenario model is built on the plant’s own performance, not generic factors.
Current generation, heat rate, fuel mix and CO2 from plant data.
Calibrated performance model of boilers, turbines and auxiliaries.
Combinations of levers with timing and assumptions.
Effects on output, efficiency, auxiliary power, fuel and CO2.
Capital, operating cost and cost per tonne of CO2 avoided.
Scenarios ranked on CO2, cost, risk and feasibility.
The plant model is what separates credible scenarios from spreadsheets. It captures interactions such as the efficiency change when biomass is co-fired, the auxiliary load of a capture plant, or the heat rate penalty of running at low load to support renewables.
Assumptions should be explicit and easy to change, so the model can be rerun as prices, policy or technology move. Our engineers document every assumption in the model.
What Scenario Results Look Like
Here is an illustrative comparison for a coal station. The numbers are examples; real results depend on your plant.
| Scenario | Levers | CO2 intensity | Main constraint |
|---|---|---|---|
| Baseline | Current operation | 0.95 t/MWh | — |
| A | Heat rate recovery of about 3% | 0.92 t/MWh | Outage time for repairs |
| B | A plus 7% biomass by heat input | 0.86 t/MWh | Mill capacity and biomass supply |
| C | B plus capture on one of three units | 0.66 t/MWh | Capital, steam extraction, net output loss |
| D | B plus reduced running hours on the oldest unit | 0.84 t/MWh | Grid demand and contracts |
Two patterns are common in results like these. Efficiency and co-firing deliver modest cuts at low cost and should come first. Deep cuts need capture or major portfolio change, which bring large capital needs and output penalties. A credible roadmap usually sequences them in that order.
Each scenario can be costed per tonne of CO2 avoided, which makes comparisons with other investments straightforward. That view is part of every scenario study.
Biomass Co-Firing: What Has to Be True
Co-firing is the most common near-term lever for coal plants in India and elsewhere. It works, but only when several practical conditions are met.
The PIB release noted that 47 plants had already co-fired biomass by mid-2023, with around 165,000 tonnes used, which shows both progress and the scale still needed to reach 5–7% across the fleet.
Trial data from your own units is the best guide to the realistic share. We help plan and analyse co-firing trials.
Carbon Capture: Lessons From Boundary Dam
Carbon capture on coal is technically proven but demanding. SaskPower’s Boundary Dam unit 3 in Canada, which started capture operations in October 2014, is the best-known example.
- Designed to capture about one million tonnes of CO2 a year
- Removes most CO2 from treated flue gas
- Enables deep cuts from existing units
- Captured CO2 can be sold or stored
- Proven at commercial scale
- Extends the life of existing assets
- Net output fell from 139 MW to 110 MW, about 21%
- Total project cost around C$1.5 billion
- Early reliability problems reduced capture
- Large steam and power demand for the capture plant
- Complex integration with the host unit
- Needs transport and storage or a CO2 buyer
These figures, drawn from public project data, show why capture sits at the end of most roadmaps and needs detailed modelling of steam extraction, auxiliary load and net output before commitment.
A scenario model can show the net output and heat rate effect of capture on your unit before any feasibility study is commissioned. Our specialists can outline it.
Turning Scenarios Into a Roadmap
Scenarios become useful when they are sequenced into a plan with decision points.
Recover heat rate through combustion, condenser and auxiliary improvements.
Test biomass on one unit, measure effects, then scale to the mandated share.
Plan flexible operation and running hours with grid and market needs.
Assess capture, fuel switching or repurposing with detailed modelling.
Set dates and triggers, such as carbon price or policy changes, for each major step.
Measure CO2 intensity monthly against the roadmap and reporting requirements.
Revisit the roadmap at least yearly with fresh plant data, prices and policy, and record what changed.
Decision gates matter because the future is uncertain. A roadmap that says what would change the plan is more credible to boards and lenders than one that pretends to know.
The same model supports ESG and regulatory reporting, so numbers stay consistent. Ask our team how reporting is linked.
Carbon Scenario Checklist
Use this checklist to make scenarios credible.
The most common gap is assuming efficiency and co-firing effects instead of measuring them. Both can be measured on your units within months. See how in a session.
How iFactory Supports Carbon Reduction Scenarios
Boilers, turbines and auxiliaries from your own data.
Levers combined and compared on CO2, cost and output.
Trial data turned into realistic shares and effects.
Steam, power and output effects estimated early.
Scenarios ranked on cost of CO2 avoided.
Monthly CO2 intensity against the plan.
It works with your plant data and reporting tools. Bring your current decarbonisation plan and we will test it in a workshop.
Test Your Decarbonisation Plan Against Your Real Plant
We calibrate a model of your station, run your chosen levers as what-if scenarios and show CO2, output and cost for each, with the constraints that matter.
Co-firing at 7% by heat input cuts fossil CO2 by roughly the same share, but mill capacity limits full-load operation on two units without pellet torrefaction.
A Co-Firing Scenario Checked Before Commitment
This exchange shows how a strategy engineer might use iFactory’s scenario model.
iFactory ships as a pre-configured NVIDIA AI server, racked and ready with the carbon scenario modelling models loaded. Rack it, plug in power and Ethernet, and the AI is live on your network. Our scope covers sensors and data connections across boilers, turbines, fuel handling and emissions systems, DCS, PLC/SCADA, historian and ERP integration, cabling and network setup, operator and quality team training, and 24×7 remote monitoring.
Server installed, DCS and historian links live, historical operating, performance and maintenance data loaded.
Models calibrated on your own unit data, then run in advisory mode on one unit with your operations and performance engineers reviewing every output.
Rollout to the agreed units under your change management, operator and engineer training, and 24×7 remote monitoring in place.
Software, server and integration come as one package. For pricing on your station, contact our sales team.
Frequently Asked Questions
Through efficiency improvements, biomass co-firing, fuel quality or fuel switching, changes in operating strategy, carbon capture and, ultimately, retirement or repurposing of units.
The revised policy of June 2023 requires 5% biomass co-firing in thermal plants from FY 2024-25, rising to 7% from FY 2025-26, according to the Press Information Bureau.
Biomass supply and quality, mill capacity, handling and storage, combustion and ash behaviour, and effects on boiler efficiency. Torrefied pellets can ease milling limits.
It varies by design. At Boundary Dam unit 3, net output fell from 139 MW to 110 MW, about 21%, after the capture retrofit.
A modelled combination of reduction levers, applied to a calibrated plant model, showing effects on CO2, output, efficiency and cost before decisions are made.
A first scenario study typically takes weeks once plant data is available, with the model kept current afterward. Plan it with our engineers.
Build a Carbon Roadmap That Survives Scrutiny
iFactory tests every decarbonisation lever against your real plant, ranks them on CO2, cost and feasibility and tracks progress, so your roadmap is credible to boards, lenders and regulators.
Illustrative station figures. Real values depend on coal, efficiency and capture performance.