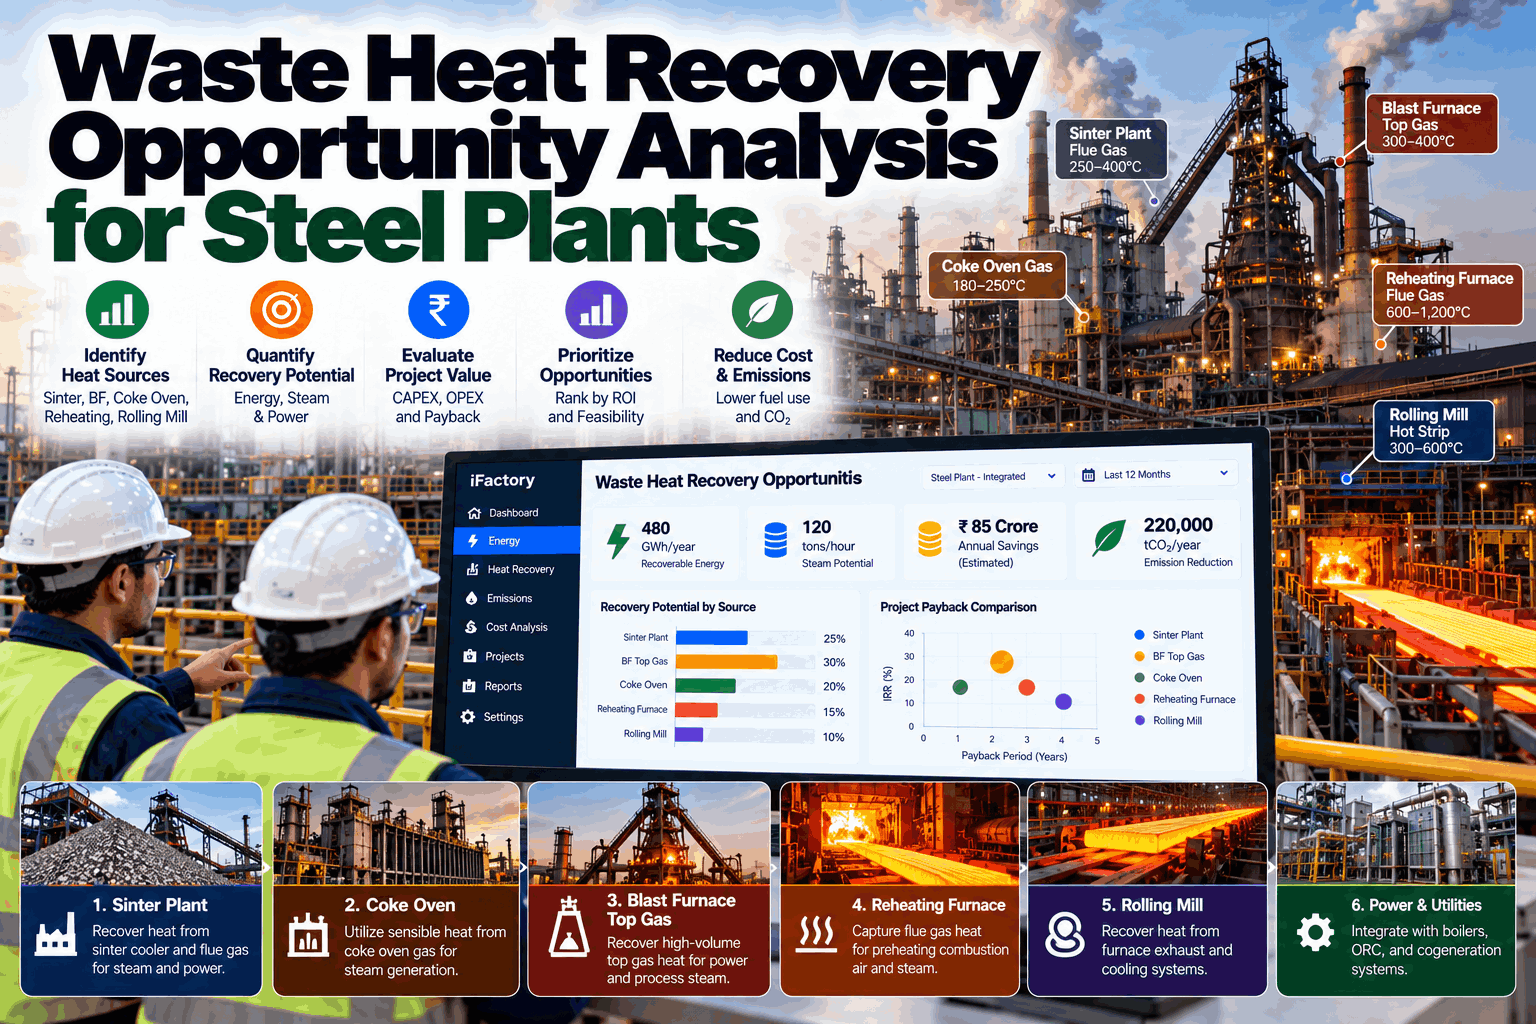
Walk through any integrated steel plant and you can feel the losses: hot air from the sinter cooler, flue gas leaving the reheating furnaces, top gas throttled across a valve at the blast furnace, cooling water carrying heat away from the mills. Most plants already know these sources exist. What they often lack is an analysis that ranks the projects on measured data and matches each source to a real user of the energy. This guide shows how to build that ranking, from heat inventory to payback, so the right projects get funded first. Book a 30-minute waste heat screening of your plant’s largest sources.
Sinter plant, top gas, coke ovens, reheating furnaces and mills, measured, matched to real sinks and ranked on one basis.
At a Glance
Why Waste Heat Studies Stall
Most integrated plants have had a waste heat recovery study. Many of those studies are still in a drawer. The pattern is familiar: the study lists every hot stream in the plant, estimates recoverable megawatts from design data, and ranks projects by temperature. Then the projects meet reality. The heat is there only when the unit runs at full rate, there is no nearby user for low-pressure steam, the flue gas is dusty enough to foul a boiler in months, or the tie-in needs a shutdown the plant cannot schedule.
A useful opportunity analysis starts from the other end. It measures what heat is actually available, hour by hour, and matches it against demand that exists at the same time. It prices recovered energy at what it would displace, whether purchased electricity, natural gas or boiler fuel, and it ranks projects on value per unit of capex with integration risk stated openly.
The Heat Source Inventory
| Source | Energy available | Typical recovery route | Data you need first |
|---|---|---|---|
| Blast furnace top gas | Pressure and flow of top gas leaving the furnace | Top-gas recovery turbine (TRT), dry or wet type; typically 15–60 kWh/t hot metal | Top pressure, gas flow, gas cleaning type |
| Coke ovens | Sensible heat of red-hot coke, around 1,000°C at discharge | Coke dry quenching (CDQ) raising steam for power or process | Coke output, current quench method, steam demand |
| Sinter plant | Hot cooler air and strand off-gas | Waste heat boiler, or recirculation to ignition and strand | Cooler exhaust temperature and flow by section |
| Hot blast stoves | Stove flue gas | Preheating combustion air and fuel gas | Flue temperature across the stove cycle |
| Reheating furnaces | Flue gas after the recuperator | Better recuperation, regenerative burners, or a waste heat boiler | Flue temperature, excess O₂, throughput |
| BOF converter | Chemical and sensible energy of converter gas | Gas recovery to holder, waste heat boiler | Recovery rate, flaring hours |
| Mills and utilities | Low-grade heat in cooling water and compressors | Heat pumps, organic Rankine cycle, compressor heat reuse | Flows, temperatures, location of possible users |
Estimating Recoverable Energy
Before any vendor quotation, each source needs a first-pass estimate based on measured data. The core calculation is simple. The discipline lies in using real flows and temperatures across a full production cycle, not the design point.
The capture factor is where honesty matters. It covers heat-exchanger effectiveness, hours when the source runs but the sink does not, and downtime for cleaning. Hourly historian data turns it from a guess into a measured number.
How Projects Get Ranked
List every source with its energy form and grade.
Pull a year of hourly flow and temperature data.
Find users that need the energy when it is available.
Price energy at what it displaces; estimate capex and tie-in.
Order by value per unit capex and integration risk.
Priced at the purchased power, gas or boiler fuel it displaces, not at an average energy price.
High-grade heat with proven technology, such as TRT or CDQ, usually carries less risk than low-grade heat.
The share of source hours when a user can take the energy decides real savings.
Tie-ins that need a major outage should be timed to planned relines and rebuilds.
Include ducting, civil work and controls, not only the recovery equipment.
Dust, corrosion and fouling can cut availability. Price cleaning and redundancy into the case.
What iFactory Delivers
Every source with measured hourly flow, temperature and pressure from your historian and meters.
Hour-by-hour overlap between available heat and real demand for steam, power or preheat.
Value per unit capex, heat grade, sink coverage and integration risk on one basis.
The instruments needed to firm up each estimate before feasibility spending.
Recovered energy of installed systems tracked against design, with fouling and availability alerts.
Delivered energy measured against a normalized baseline for business-case close-out.
Five Mistakes That Sink Waste Heat Business Cases
Sizing on nameplate flows and temperatures instead of a year of measured data inflates savings and undersizes fouling margins.
Recovered steam that would be vented at weekends or during rate cuts is not a saving. Model the overlap hour by hour.
Price recovered energy at what it actually displaces at the margin, not at the plant’s average cost of energy.
A sinter cooler boiler, a new turbine and a gas balance change can all claim the same steam. Stack them in order.
Projects that need a long outage should be timed to blast furnace relines, battery rebuilds or mill shutdowns already on the plan.
Share historian access or a year of flow and temperature data. We build the source inventory, match each source to its sinks and show which projects hold up.
How Deployment Works
Server racked on site, historian, meter and production data connected, and metering gaps listed against the units that matter most.
Baselines and expected-energy models built per unit, then piloted with your energy and process engineers reviewing every finding.
Dashboards, alerts and reports rolled out plant-wide, teams trained, and 24×7 remote monitoring of the system in place.
Waste heat screening usually starts with the largest sources, the sinter cooler, stoves and reheating furnaces, where historian coverage is good. Missing measurements are added before any project goes to feasibility.
Frequently Asked Questions
In integrated plants the largest sources are usually top-gas pressure at the blast furnace, coke sensible heat at the coke ovens, sinter cooler exhaust and reheating furnace flue gas. The best project depends on measured availability and sink demand at your site.
Published figures put typical TRT output at around 15–60 kWh per tonne of hot metal, depending on top pressure, gas flow and whether dry or wet gas cleaning is used. Dry systems generally recover more.
Temperature shows how much heat is available, not how much money it can save. Value depends on what the recovered energy displaces and on how many hours a sink can use it.
A sink is a user that can take the recovered energy, such as a steam header, a power turbine or a preheater. Heat with no sink at the time it is available produces no savings.
At least a year of hourly flows, temperatures and pressures for each source, operating hours, and demand data for candidate sinks. Where instruments are missing, a temporary measurement campaign fills the gap.
Recovered energy is metered and compared with a baseline normalized for production, following IPMVP-style measurement and verification so finance can close out the business case.
iFactory ranks waste heat projects on measured data, matches every source to a sink and verifies what each installed system delivers.