Energy is the largest controllable cost in a cement plant, and ISO 50001 is the framework that turns it into a managed system. In practice, most plants run the framework by hand. An energy engineer exports meter readings into spreadsheets at month end, rebuilds the specific energy consumption figure for each area, explains the variance after the fact, and assembles audit evidence in the weeks before the surveillance visit. The system exists on paper, but the improvement cycle moves at the speed of one person's calendar. iFactory AI Optimization with Energy Analytics automates the measurement, baselining and reporting layers of the EnMS, so SEC per tonne, EnPI performance and improvement actions stay current without adding headcount.
iFactory AI Optimization + Energy Analytics - Cement Energy Management
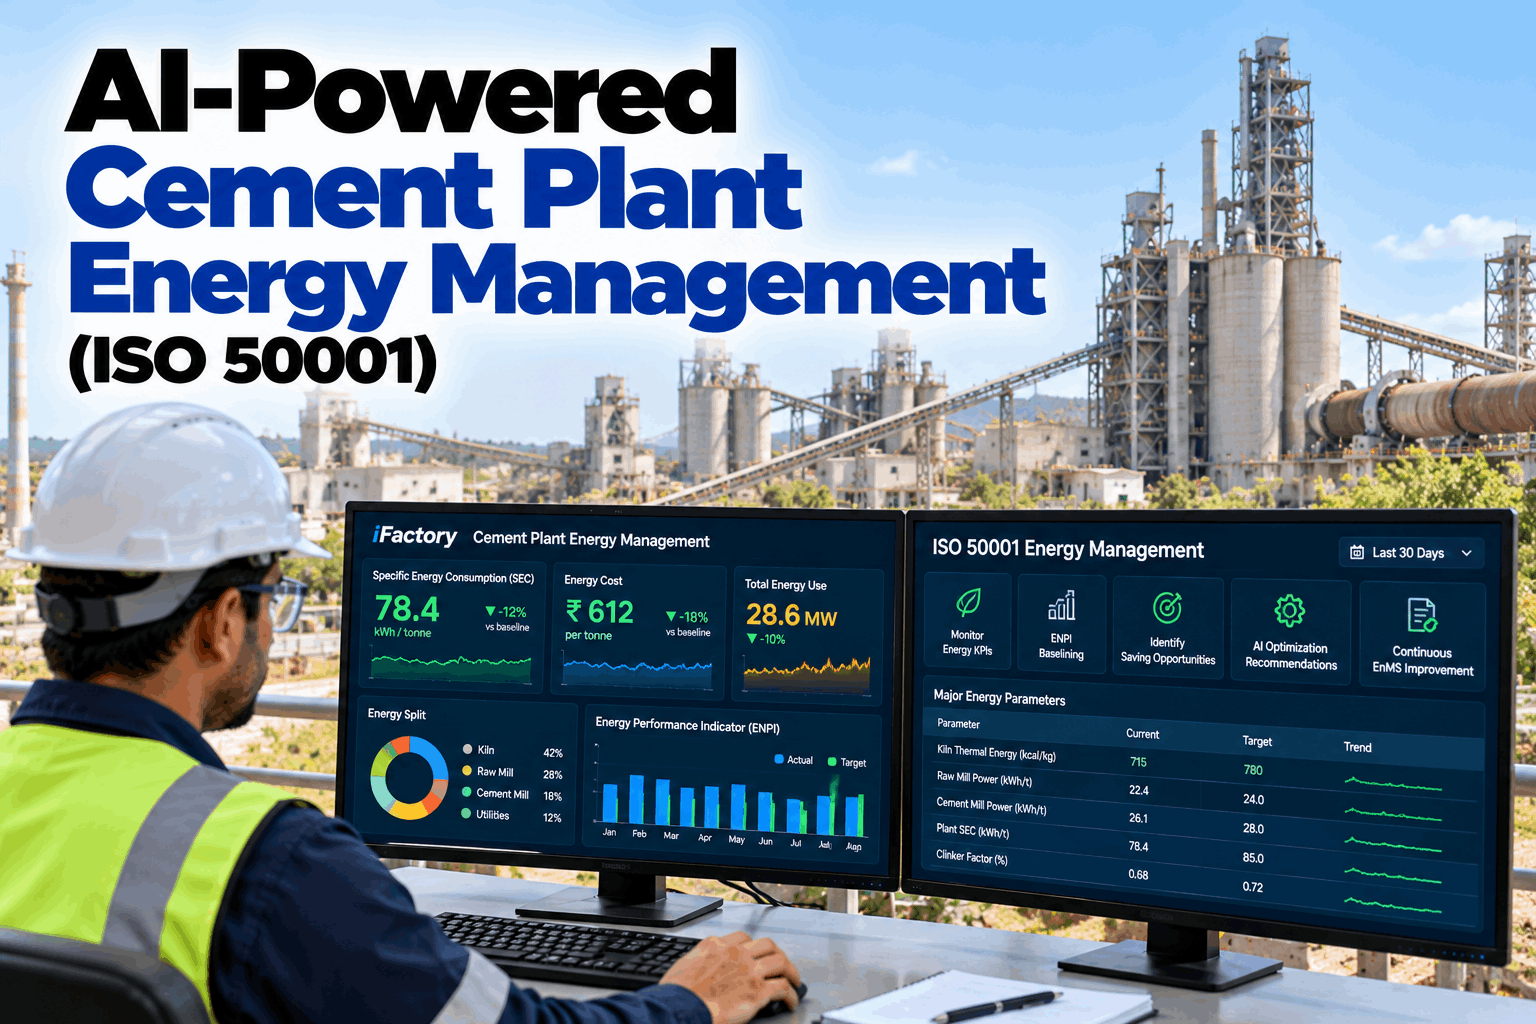
AI-Powered Cement Plant Energy Management for ISO 50001
SEC per tonne by process area, EnPI baselining against normalised conditions, and a continuous improvement loop that runs on live plant data instead of month-end spreadsheets.
SEC per tonne
thermal and electrical, by area, updated continuously
EnPI baseline
normalised for clinker factor, product mix and load
EnMS loop
review, objectives, actions and monitoring in one place
Audit-ready
evidence generated as the work happens, not rebuilt afterwards
Why ISO 50001 Programs Stall in Cement Plants
Cement plants have the data and the commitment. What they lack is the time to turn readings into decisions. These are the six reasons an EnMS slows down after certification.
01
Manual data collection
Meter readings gathered from the historian, energy meters and shift logs by hand take days each month, and the report arrives after the opportunity to act has passed.
02
Plant-wide SEC hides the cause
One kWh per tonne figure for the plant blends raw mill, kiln and cement mill performance, so a drift in one area is lost in the average of the others.
03
Baselines that ignore operating conditions
Comparing this month with last year without adjusting for clinker factor, product mix and utilisation rewards a lucky month and penalises a hard one.
04
Audit preparation is a project
Review evidence, action status and objectives are gathered from several files in the weeks before an audit, pulling the energy team away from improvement work.
05
Energy review sits apart from operations
The EnMS is reviewed in a monthly meeting, while the mill and kiln are tuned every shift. The people who control consumption never see the energy view.
06
Improvement depends on headcount
Every extra area, KPI or report needs more of an engineer's time. Programs plateau because the effort to keep them current grows faster than the team.
SEC by Process Area - The View a Plant-Wide Figure Hides
The energy performance table compares actual SEC for each area with its normalised baseline, so the planner can see which area is driving the variance and by how much. The figures below are an illustrative example of the output.
Process area
Actual SEC
Baseline
Variance
Status
Likely driver
Crushing
1.4 kWh/t
1.4 kWh/t
0%
On baseline
No action needed
Raw mill
18.2 kWh/t
16.9 kWh/t
+8%
Watch
Harder feed and low mill loading
Kiln and preheater
742 kcal/kg
725 kcal/kg
+2%
Watch
Unstable feed and false air
Cement mill
34.7 kWh/t
31.0 kWh/t
+12%
Act
Separator setting and fineness over target
Packing and utilities
4.1 kWh/t
4.2 kWh/t
-2%
Better
Compressed air leak fix holding
Plant summary
3 areas above baseline
-
12% peak
1 to act on
A plant-wide figure would not show the cement mill
How iFactory Supports the ISO 50001 Cycle
ISO 50001 follows a plan, do, check, act cycle. iFactory does not replace the standard or the certification body. It automates the data-heavy parts of the cycle so your energy team spends its time on decisions.
Energy review and baseline
Significant energy uses
Consumption ranked by area and equipment, so the biggest uses are identified from data
Normalised baseline
Baseline adjusted for relevant variables such as clinker factor, product type and production rate
Opportunity list
Gaps between actual and baseline turned into ranked improvement opportunities
Optimisation and action
AI recommendations
Setpoint and operating suggestions for mills and kiln that reduce SEC within process limits
Shift-level visibility
Operators see energy performance during the shift, when they can still change it
Action tracker
Objectives, targets and action plans linked to the energy data they depend on
Monitoring and review
EnPI tracking
Performance against baseline calculated continuously, with trend and variance
Management review pack
Review inputs assembled automatically from live data and action status
Audit evidence
Records retained with timestamps, ready for internal and external audit
What an iFactory Energy Report Contains
A report that lists total consumption starts a discussion. A report that names the area, the baseline, the driver and the owner starts an action. These are the five elements in every iFactory energy review.
1
SEC per tonne by process area
Thermal and electrical SEC for each area, calculated against the correct product, not divided across the whole plant.
Example: Cement mill 34.7 kWh/t against 31.0 baseline
2
EnPI against a normalised baseline
Performance shown after adjusting for the variables that legitimately change consumption, so variance reflects efficiency and not conditions.
Example: Adjusted for clinker factor and mill throughput
3
Top deviations with likely driver
The largest variances ranked by energy and cost impact, each with the operating condition most associated with it.
Example: Separator speed change, fineness above target
4
Action status against objectives
Open energy actions with owner, target saving and measured result so far, linked to the EnMS objectives they support.
Example: Separator retune - owner assigned - result under review
5
Audit and regulatory evidence
Data and records organised for internal audit, certification surveillance and regulatory energy reporting such as PAT submissions to BEE.
Example: Monthly SEC record with source and timestamp
Want to see your SEC and EnPI on live data? Book a demo - bring your meter list and last year's energy reports and we will show where the variance sits by area.
How iFactory Runs the Energy Loop - Five Stages
The path from meter to management review is five steps. Each replaces a manual task that normally consumes an energy engineer's month.
01
Meter
Energy meters, historian tags and production data connected automatically.
02
Normalise
Consumption adjusted for product, clinker factor and load.
03
Baseline
EnPIs compared with a reference that reflects real operating conditions.
04
Optimise
AI identifies the operating changes most likely to reduce SEC.
05
Report
Reviews, action status and audit evidence generated from the same data.
What Automated Energy Management Delivers
The return is a program that stays current. Energy teams spend less time collecting and reconciling data, operators see consumption while they can still act, and audits draw on records that already exist.
By area
SEC visibility
variance traced to the process area, not averaged away
Normalised
Fair EnPI baselines
conditions adjusted so results reflect efficiency
Continuous
Improvement loop
actions tracked against measured results
No extra hires
Same team, wider scope
reporting automated, analysis left to your engineers
Frequently Asked Questions
Does iFactory certify us to ISO 50001?
No. Certification is issued by an accredited certification body after it audits your EnMS. iFactory supports the system by automating measurement, baselining, monitoring and reporting, and by keeping the records an auditor will ask for. Your organisation still owns its energy policy, objectives and management review.
How does this work without adding headcount?
The tasks that consume time are data collection, calculation and report assembly. Those are automated, so the existing energy engineer or team spends its time interpreting variances and managing actions. A plant can widen the number of areas and KPIs it tracks without the effort growing in proportion.
What metering and data do we need?
The starting point is what you already have, typically a plant historian or DCS, energy meters on major drives, fuel flow and production records. iFactory reviews these at scoping and identifies any gaps for significant energy uses. Missing sub-metering can be added in stages, so the program does not wait for complete coverage.
Is this reporting only, or does the AI help reduce consumption?
Both. Energy Analytics gives the visibility, and AI Optimization suggests operating changes for areas such as mills and kiln that are likely to reduce SEC while staying within process and quality limits. Your operators and process engineers decide what to apply, and the result is measured against the baseline.
Stop rebuilding your SEC report every month.
See ISO 50001 Energy Management on Your Cement Plant Data
Bring your meter list, last year's energy reports and your current baseline. We will show SEC by area, EnPI against a normalised baseline and where the largest variance sits.