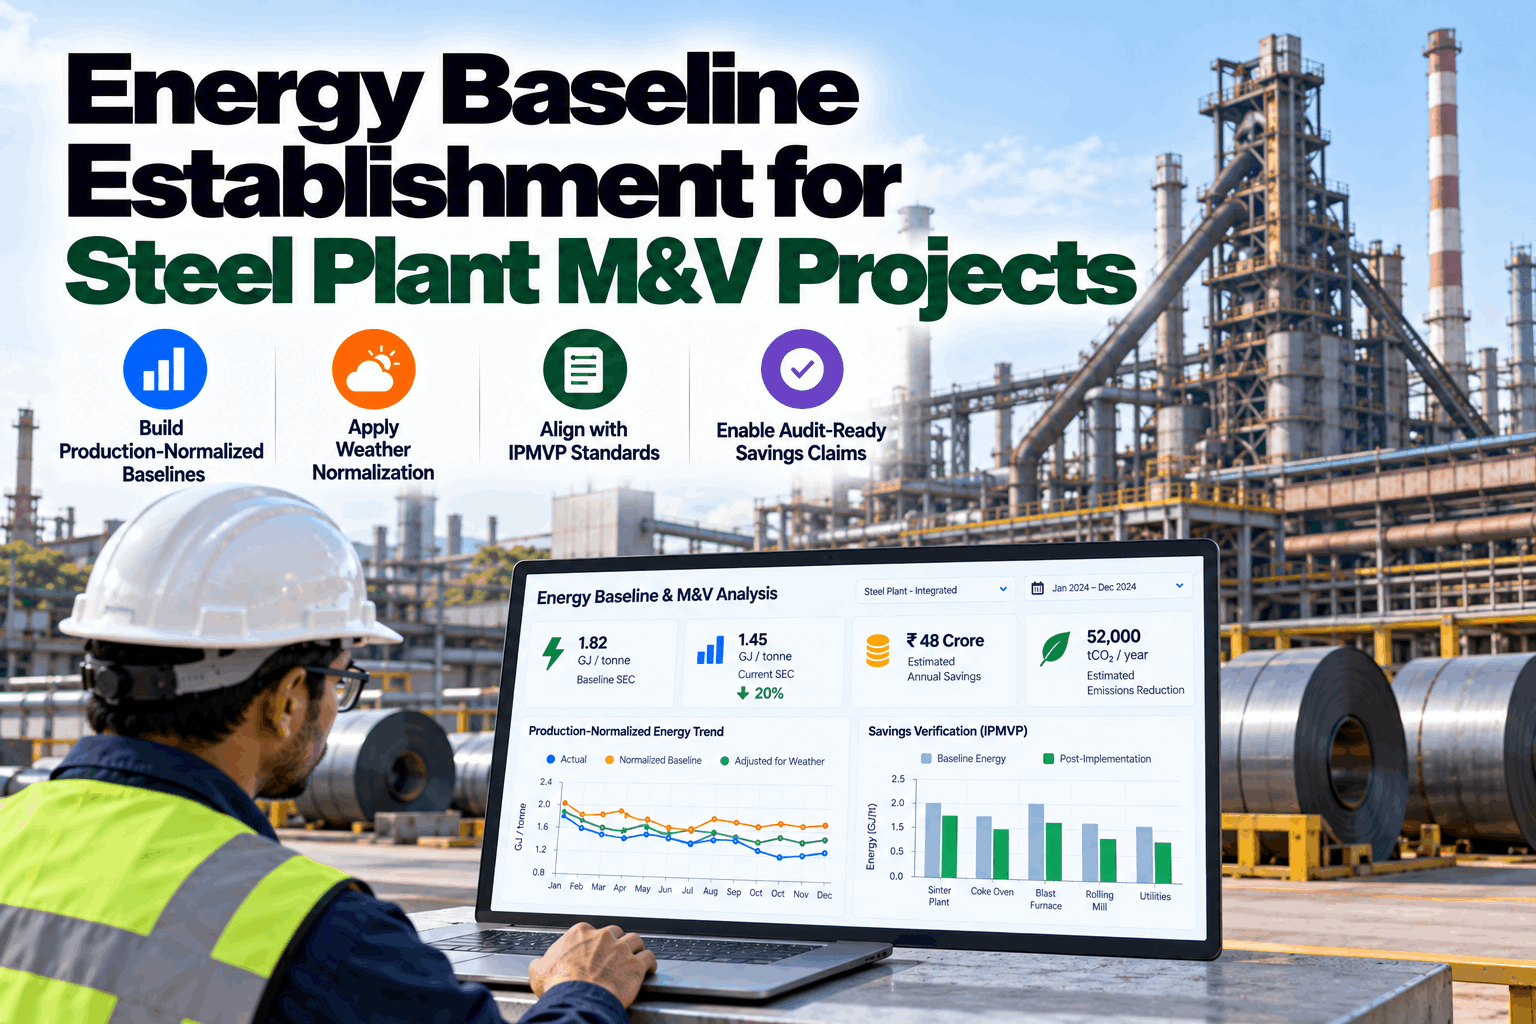
Every energy project in a steel plant eventually faces the same question from finance: how much did it really save? A simple before-and-after comparison rarely answers it, because production volume, grade mix and charge conditions swing energy use as much as most projects do. A defensible answer needs a production-normalized baseline, weather normalization where it applies, and an IPMVP-aligned method that an auditor can reproduce. Book a 30-minute review of a baseline built on your own data.
Production-normalized baselines, weather normalization where it matters and IPMVP-aligned methods, so every savings number can be defended.
At a Glance
Why Before-and-After Comparisons Fail in Steel
An energy project goes live in March, and April’s bill is 8% lower. Was it the project? In a steel plant, probably not only the project. Production may have dropped, the product mix may have shifted to lighter sections, the hot-charge ratio may have risen after a caster improvement, or a blast furnace may have been on reduced blast. Any of these can move energy use more than the measure itself, in either direction.
Measurement and verification (M&V) solves this by comparing actual energy with what the plant would have used in the same conditions without the measure. That counterfactual is the adjusted baseline, and the quality of the whole savings claim depends on how well it is built.
Choosing the Independent Variables
| Variable | Why it matters | Typical source |
|---|---|---|
| Production by product family | Energy scales with tonnage, but not equally for every product | MES, production reports |
| Grade and alloy mix | Heavier reductions, alloys and heat treatments change energy per tonne | MES, order book |
| Hot-charge ratio | Hot-charged slabs and billets need far less reheating fuel | Caster and furnace tracking |
| Operating hours and uptime | Fixed loads run whether or not steel is produced | Historian, shift logs |
| Ambient temperature and humidity | Affects compressors, cooling towers, chillers and HVAC | Site weather station or nearby station |
| Raw material quality | Coal moisture, ore grade or scrap mix shift energy in ironmaking and EAF shops | Lab and receiving data |
Candidate variables are tested statistically, not chosen by intuition. A variable that does not improve the model is left out, and one that clearly drives energy but is missing from the data becomes a metering priority.
Building and Testing the Baseline Model
At least 12 months of energy and driver data covering the normal operating range.
Remove meter faults and document outages and abnormal periods.
Fit a regression of energy against the candidate variables at a suitable interval.
Check fit and uncertainty against acceptance criteria agreed in advance.
Record the model, data sources and adjustment rules in the M&V plan.
Acceptance criteria should be agreed before the model is built, not after. Many practitioners use goodness-of-fit and uncertainty measures such as R², CV(RMSE) and net bias, with thresholds such as those in ASHRAE Guideline 14, and check that each coefficient is statistically significant and physically sensible. A model that says energy falls as production rises is fitting noise, whatever its R².
Daily or hourly models capture production swings better than monthly ones, but need cleaner data.
The reporting period should stay within the conditions the baseline covered. Extrapolation weakens the claim.
Savings are reported with their uncertainty, so small claims are not lost in the noise.
Every change to the model or data is logged, so an auditor can reproduce the result.
Weather Normalization: Where It Matters
Compressed air intake temperature, cooling towers, chillers, HVAC, space heating and some water pumping. Use degree days or hourly temperature as variables.
Reheating furnaces, EAFs and mill drives are dominated by production, grade and charge conditions. Weather adds little once those are modeled.
Add weather as a candidate variable and let the statistics decide. Seasonal effects sometimes show up through cooling water or humidity.
Picking the Right IPMVP Option
| Option | Boundary | Steel plant example | When it fits |
|---|---|---|---|
| A — Retrofit isolation, key parameter | The equipment; one key parameter measured, others estimated | VFD on a cooling water pump: power measured, operating hours stipulated | Low-risk measures where the estimated parameter is well known |
| B — Retrofit isolation, all parameters | The equipment; all parameters measured | New compressor with continuous kW and flow metering | When measure performance varies and must be measured fully |
| C — Whole facility | The whole site or a large metered area | Plant-wide energy program measured at utility meters | When savings are large compared with normal variation in the meter |
| D — Calibrated simulation | Part or all of the facility, modeled | Reheating furnace or gas network model calibrated to measured data | When baseline or reporting data are missing or unreliable |
In steel, many plants combine options: B for compressors and drives, C for the overall program, and D where a process model is the only way to separate interacting measures.
Non-Routine Adjustments and the Standards Behind Them
Some changes are not caused by the measure and are not captured by the model’s variables: a new line starts up, a furnace is rebuilt, a product is discontinued, a meter is replaced. These need non-routine adjustments, calculated and documented as they happen. ISO 50006 provides the framework for energy baselines and energy performance indicators within an ISO 50001 energy management system, and ISO 50015 sets out principles for measuring and verifying energy performance.
What iFactory Delivers
Baselines, models and adjustments built and documented the same way for every project and every site.
Regression models on the variables that really drive energy at each unit.
Fit, uncertainty and coefficient tests reported with every model.
Degree-day and temperature variables tested where they matter.
IPMVP option recommended per measure, with metering needs listed.
Non-routine adjustments calculated and documented as they happen.
Verified savings with uncertainty, ready for controllers and auditors.
A Defensible Savings Checklist
The baseline period, variables, model, option and reporting schedule are agreed before the measure is installed.
Parameters with real uncertainty are measured; only well-known values are stipulated.
Fit and uncertainty meet thresholds agreed in advance, and coefficients make physical sense.
Every non-routine adjustment has a calculation, a date and an approver.
An independent reviewer can rerun the calculation from the stored data and get the same answer.
Share 12 months of energy and production data for one project or unit. We build and test the baseline, recommend the IPMVP option and show the savings calculation.
How Deployment Works
Server racked on site, historian, meter and production data connected, and metering gaps listed against the units that matter most.
Baselines and expected-energy models built per unit, then piloted with your energy and process engineers reviewing every finding.
Dashboards, alerts and reports rolled out plant-wide, teams trained, and 24×7 remote monitoring of the system in place.
Frequently Asked Questions
It is a model of the energy a plant or system would have used without the efficiency measure, built from a baseline period and the variables that drive energy use.
By modeling energy against tonnage by product family, grade mix, hot-charge ratio and operating hours, then applying the model to reporting-period conditions to get the adjusted baseline.
Mainly for utilities such as compressed air, cooling towers, chillers and HVAC. Furnaces and mills are dominated by production variables, so weather should be tested rather than assumed.
Option A or B for isolated equipment such as drives and compressors, C for whole-facility programs with large savings, and D when a calibrated process model is needed.
Corrections for changes not caused by the measure and not captured by the model, such as new lines, rebuilds, discontinued products or meter changes.
IPMVP (2022 Core Concepts), ISO 50006 for baselines and energy performance indicators, and ISO 50015 for measurement and verification of energy performance.
iFactory builds production-normalized, IPMVP-aligned baselines and documents every adjustment, so verified savings stand up to review.