Best SAP xMII Alternative for Energy & Utilities Manufacturing in 2026
By Josh Brook on May 25, 2026
Inside the control room of a 1,000 MW combined-cycle plant, the operator on shift can see hundreds of tags scrolling across the DCS — turbine inlet temperature, condenser back-pressure, feedwater pH, boiler drum level, generator stator winding temperature. The plant is running. The numbers look fine. But buried inside that scroll is a heat-rate drift of 12 Btu/kWh that started 18 hours ago — too gradual to trip an alarm, too small to notice on a shift handover, expensive enough to cost the utility roughly $4,800 per day at current fuel prices on a plant that scale. Multiply that across a 14-plant generation fleet, across a year, across all the small drifts that the existing SAP MII reporting layer was never designed to catch in time, and the number gets uncomfortable. For the manufacturing executive running operations across an Energy & Utilities portfolio, 2026 is the year that "uncomfortable" turns into "decision required" — because the SAP MII platform that's been the reporting backbone for two decades is being sunset, and the replacement choices in front of you are not equal. This page is a head-to-head read of where iFactory fits against SAP MII and SAP DM for Energy & Utilities — written for the executive who has to make the call.
Energy & Utilities · SAP MII Alternative · 2026
The AI-Native Successor to SAP MII for Energy & Utilities.
SAP MII is sunsetting. The replacement question isn't binary. For Energy & Utilities executives running multi-plant generation, T&D, and process operations — here's how iFactory's on-premise AI-native intelligence layer compares to SAP MII, SAP DM, and the do-nothing path. With the ROI math, side-by-side capability map, and decision framework.
Availability target for utility-grade generation assets
6–12 wk
iFactory turnkey on-prem deployment per plant
The Executive Decision Window Is Closing
SAP MII reaches end of mainstream maintenance on December 31, 2027. Premium extended support runs through roughly December 2030 — at premium pricing, with no new features and a shrinking pool of qualified MII engineers. For an Energy & Utilities executive, three options are on the table. Each has a different cost, timeline, and operational ceiling. The least-decided option — keep running MII and revisit later — is the one that gets more expensive every quarter from here.
Option A
Migrate to SAP Digital Manufacturing
SAP-recommended path. Cloud-first, BTP-hosted, ProdCon at the edge.
Best when SAP-centric IT mandate, S/4HANA migration in flight, cloud-first corporate strategy
Strength Native SAP integration, ERP alignment, cloud-managed configuration
Gap AI-native vision, predictive SPC, heat-rate analytics, condition monitoring not deeply native
On-premise NVIDIA appliance or managed cloud. Reads from existing PI / OSIsoft / SAP MII / DCS.
Best when AI-native capability is the priority, on-prem data sovereignty matters, fast time-to-value is needed
Strength Predictive SPC, heat-rate analytics, condition monitoring, vision inspection — natively in the platform
Gap Not a replacement for ERP-side workflows — works alongside, not instead
Timeline 6–12 weeks per plant
Cost Hardware + license + managed service — typically pays back in months
Option C
Stay on SAP MII / Extended Support
Continue running MII through extended maintenance to ~2030.
Best when No internal capacity for migration, MII handles only basic reporting
Strength No migration cost in current budget cycle
Gap Premium pricing, no new features, technical debt accumulates, shrinking engineering pool
Timeline 4-year deferral
Cost Premium extended support fees + growing operational risk
Most Energy & Utilities executives we work with end up running Option A and Option B in parallel — SAP DM for ERP-side workflows, iFactory for AI-native operations intelligence. Walk an executive briefing with our team and we'll map your specific fleet, current MII footprint, and 24-month roadmap.
The Capability Map — iFactory vs SAP MII, Head to Head
SAP MII was designed in the early 2000s as an integration-and-intelligence layer that bridged SAP business processes to plant-floor data. It does that job well. What it was not designed to do is real-time predictive SPC, AI vision inspection, heat-rate analytics, condition-based monitoring, or operator AI guidance — capabilities that today's Energy & Utilities operations require to hit availability and heat-rate targets. Below is the head-to-head, by capability.
Capability
SAP MII
SAP Digital Manufacturing
iFactory AI
Predictive SPC with adaptive limits
Basic control charts
Configurable, manual tuning
Native · LSTM forecasting · 24-hr lookahead
Heat-rate & efficiency analytics
Reporting only
Reporting only
Live drift detection · Btu/kWh attribution
Vibration / condition monitoring
Not native — integration only
Not native — integration only
Native · 1-sec sampling · anomaly scoring
AI vision inspection
Not supported
Not deeply native
Native · NVIDIA-accelerated · on-prem
Operator AI assistant
None
None
Native · suggested-action overlays
Multi-plant rollup
Manual configuration
Cloud-native
Hybrid · on-prem nodes + corporate dashboard
OSIsoft PI / historian integration
OLE DB / OPC
OPC UA via ProdCon
Native · plus 12 other historian adapters
Edge AI processing
No
Cloud-only by design
NVIDIA on-prem appliance · sub-second decisions
Time to value
3–6 months reporting
12–24 months fleet-wide
6–12 weeks per plant
Data sovereignty (on-premise)
On-prem available
Cloud-first architecture
On-prem standard · cloud optional
NERC CIP / IEC 62443 alignment
Customer-implemented
Customer-implemented
On-prem + air-gap option · documented controls
Roadmap status
EOL Dec 2027 / ~2030
Active
Active · AI-native roadmap
Where the Money Actually Is — The Energy & Utilities Loss Math
The capability map is one way to look at the decision. The other is to look at where money actually leaks out of a generation or utility plant today — and which of those losses the existing SAP MII reporting layer can catch in time to act. The answer, for most plants, is: not enough of them. Below is the loss-cost stack that executives actually see in board reports, mapped against what the data layer needs to do to surface each one.
Where the Lost Revenue Sits in a Typical Generation Plant
Heat-Rate Drift
Every 1% heat-rate deterioration on a 1,000 MW plant costs roughly $1.5–2M annually in additional fuel burn. EPRI studies show 0.10–2.50% recoverable through targeted maintenance and tuning — if the drift is caught in real time.
$1.5–2M / 1%
Forced Outages
Unplanned outages on a CCGT plant cost $100K–$500K per day in lost generation, replacement power, and start-up fuel. Condition monitoring with predictive SPC typically reduces forced outage rate by 20–40% on aging assets.
$100K–$500K / day
Availability Gap
Utility-grade availability targets sit at 95–99%. Every percentage point below target on a 500 MW plant is roughly $4–6M in lost annual revenue at current wholesale prices. Most plants run 2–5 points below technical achievable.
$4–6M / 1 pt
Auxiliary Power
Pumps, fans, compressors, FGD systems consume 6–10% of gross generation as auxiliary load. A 0.5-point reduction in auxiliary load on a 1,000 MW plant is worth roughly $800K–$1M annually — and is achievable through live load optimization.
$800K–$1M / 0.5 pt
Emissions Penalties
NOx, SO2, mercury excursions during start-up, load swings, and equipment degradation can drive compliance penalties and CEMS event reporting. Predictive SPC on the emissions monitoring tags catches drift before exceedance.
Variable
Maintenance Inefficiency
Calendar-based preventive maintenance on aging assets wastes 30–40% of maintenance spend on parts replaced before end-of-useful-life. Condition-based maintenance driven by live SPC moves the budget toward the assets that actually need it.
30–40% recoverable
The MII Migration Is Real. The AI-Native Upgrade Is Optional. Choose Both.
SAP MII is leaving. SAP DM handles the ERP-side workflows well. iFactory delivers the AI-native production intelligence that neither was designed to deliver — predictive SPC, heat-rate analytics, condition monitoring, vision inspection. On-prem NVIDIA appliance, 6 to 12 weeks per plant, pays back inside the budget cycle.
What Predictive SPC Looks Like on a Generation Asset
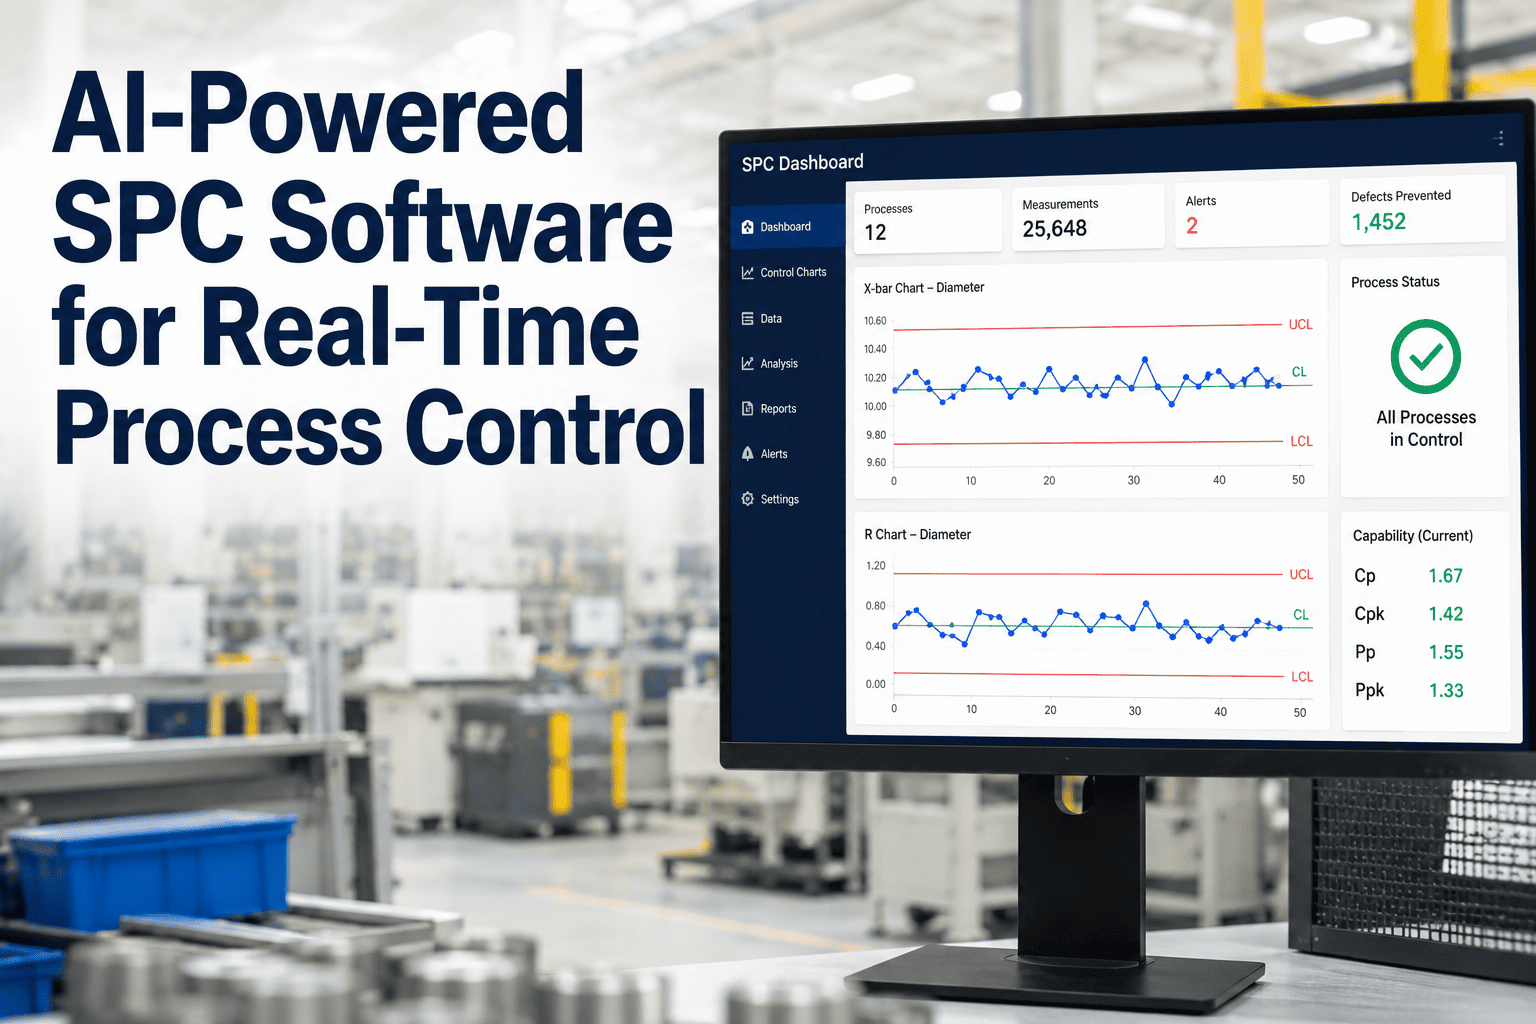
The single biggest capability gap between MII and an AI-native platform is what happens on the SPC chart. MII shows you a Shewhart chart after the parameter has already breached its control limit. Predictive SPC catches the same parameter 24 hours earlier — by forecasting the trajectory, applying Western Electric rule patterns, and zoning the chart into Safe, Warning, and Critical regions before the breach. The math is the same. The intelligence layer on top is what changes.
What MII shows: The current point. If it's inside the control limits, no alarm. If it breaches, an alarm — but you're already in the excursion.
What iFactory adds: A 24-hour forward forecast with confidence bands. SPC zoning (Safe / Warning / Critical). Western Electric rule pattern detection (1-of-1, 2-of-3, 4-of-5, 8-in-a-row). Cross-parameter correlation that catches the upstream cause before the downstream effect breaches.
What the operator sees: The chart above, with a suggested action — "Drum level trending up over last 6 hours · feedwater control valve response delayed · check valve actuator before next shift change." Andon overlay. One-tap acknowledge. Maintenance work order auto-generated if not actioned in 30 minutes.
The Six Energy & Utilities Use Cases iFactory Solves Day One
01
Heat-Rate Drift Detection
Live Btu/kWh tracking against design heat rate, attributing deviation to boiler efficiency, turbine cycle, condenser back-pressure, or auxiliary load. Drift caught at 5–15 Btu/kWh, not after a quarterly thermal performance test.
02
Condition-Based Monitoring
Vibration, bearing temperature, lube oil, stator winding temperature continuously SPC-charted with adaptive limits. Predictive alarms 24–72 hours before traditional thresholds trip — moving maintenance from calendar to condition.
03
Boiler & Turbine Performance
Steam pressure, temperature, flow, drum level, feedwater chemistry — all on live SPC with Western Electric rule detection. Catches developing tube leaks, soot-blower inefficiency, and excess oxygen drift before they hit heat rate.
04
Emissions & CEMS Compliance
NOx, SO2, CO, opacity, mercury continuously monitored with SPC overlays. Drift toward limits flagged early. CEMS event audit trail automatically generated. Compliance reporting alongside live operations data, not separately.
05
Auxiliary Load Optimization
Live tracking of FD/ID fan power, boiler feed pump consumption, FGD blower load, condenser cooling water pump power. SPC catches drift; AI overlay suggests setpoint adjustments. 0.3–0.8 pt auxiliary load reduction typical.
06
Outage Planning Optimization
Fleet-wide condition data feeds outage scoping. Components flagged Yellow (watch), Amber (plan), Red (intervene) by current SPC state and degradation trajectory. Outage scope right-sized before the planning cycle locks.
The 30-60-90 Executive Timeline
For an Energy & Utilities executive evaluating where iFactory fits in the next budget cycle, the realistic timeline runs 30-60-90 days from first conversation to first plant live. Below is what each window looks like in practice.
Days 1–30
Executive Briefing & Scope
Architecture walkthrough with operations and IT leadership. Current SAP MII footprint inventory. Pilot plant selection. Tag library review against existing PI / OSIsoft historian. Commercial proposal with capex, opex, and ROI model tied to your specific fleet baseline.
Days 31–60
Pilot Plant Deployment
NVIDIA on-prem appliance shipped pre-loaded. Field techs connect to plant network, integrate with DCS, PI, MII as parallel data sources. SPC models trained on 90 days of historical data. Heat-rate baseline established. Andon screens deployed in control room.
Days 61–90
Pilot Validation & Fleet Rollout Plan
Pilot plant goes live with predictive SPC on critical loops, condition monitoring on major rotating assets, heat-rate live tracking. First 30-day post-go-live review with quantified capacity, heat-rate, and availability gains. Fleet rollout schedule locked — typically 3 plants per quarter.
Where the ROI Comes From — Built for Energy & Utilities Economics
Heat-rate recovery
$1.5–3M
Per 1,000 MW plant, per year, from 1–1.5% heat-rate improvement through live drift detection and targeted tuning
Forced outage reduction
$2–5M
Per 1,000 MW plant, per year, from 20–40% forced outage rate reduction through condition-based monitoring
Availability improvement
$4–6M
Per 500 MW plant, per year, per percentage point of availability recovered through reduced unplanned downtime
Auxiliary load optimization
$800K–$1M
Per 1,000 MW plant, per year, from 0.5-point auxiliary load reduction through live optimization
Maintenance efficiency
30–40%
Of preventive maintenance budget reallocatable from calendar-based to condition-based intervention
Time to value
6–12 wk
Per plant from order to live floor — payback typically inside the first 12 months of operation
Why Manufacturing Executives Choose iFactory Over SAP MII
A
Built AI-native, not retrofitted
SAP MII was designed as an integration layer in the early 2000s. SAP DM adds cloud modernization. Neither was built ground-up for predictive SPC, vision inspection, condition monitoring, or operator AI guidance. iFactory was.
B
On-premise NVIDIA edge — your data stays on plant
Critical for NERC CIP and IEC 62443 alignment, data sovereignty, IP-sensitive operations, and air-gap-capable environments. All AI processing happens on-site. No cloud round-trip. No data egress.
C
Layers above your existing stack
Reads from PI / OSIsoft, SAP MII, DCS, SCADA, plant historians as parallel data sources. No rip-and-replace. No conflict with your existing automation vendors. The migration path stays under your control.
D
6 to 12 weeks per plant — not 18 months
Turnkey hardware-plus-software appliance ships pre-loaded. Field integration handled by our team. Pilot in 30 days, plant live in 90. Fleet rollout at 3 plants per quarter after first pilot stabilizes.
E
Operator-first UI, not engineer-first
Control room operators see the loop, the loss, the suggested action — in two taps. Continuous-improvement engineers get the full analytical layer. Both layers built from the same data spine.
F
24×7 managed service included
Remote monitoring, monthly model retraining, quarterly performance review with your plant manager, 99.9% uptime SLA. We handle cabling, network setup, DCS tap-in, training. Your team runs production.
Frequently Asked Questions
Is iFactory a replacement for SAP MII or a complement to it?
It's a complement, not a replacement. SAP MII (and its successor SAP DM) handles the ERP-side workflows — work orders, batch records, production declaration, integration with SAP S/4HANA, ERP-linked dashboards. iFactory handles the AI-native production intelligence layer — predictive SPC, condition monitoring, heat-rate analytics, vision inspection, operator AI guidance — that neither MII nor DM was designed to deliver natively. Most Energy & Utilities customers run them side by side, with iFactory reading from MII/DM as a parallel data source and adding the analytical layer on top. As MII sunsets through 2027–2030, customers either migrate the ERP-side workflows to SAP DM or move them elsewhere, while iFactory stays in place as the operations intelligence layer.
Does iFactory work with our OSIsoft PI Historian and DCS?
Yes. PI / OSIsoft integration is native through PI Web API and AF SDK. We also support GE Proficy Historian, Wonderware Historian, Aveva PI, Honeywell PHD, ABB Operations Management, and most utility-sector historians. On the DCS side, we connect to Emerson Ovation, Honeywell Experion, ABB 800xA, Siemens SPPA-T3000, GE Mark VI, and Yokogawa Centum via OPC UA, OPC DA, and direct vendor APIs where available. Existing automation vendors stay in place — iFactory reads from them, doesn't replace them.
How does iFactory handle NERC CIP and IEC 62443 requirements?
The on-premise NVIDIA appliance is designed for OT-network deployment with documented controls aligned to NERC CIP-002 through CIP-014 and IEC 62443-3-3 system requirements. All AI processing happens on the appliance — no cloud round-trip, no data egress, no outbound dependencies during normal operation. The architecture supports air-gap deployment for ESP-segmented networks and DMZ deployment for less-restricted zones. We provide documented evidence packages, configuration baselines, and patch management procedures for your compliance audits. For utility customers in regulated jurisdictions, this is typically the deciding factor over cloud-only alternatives.
What's the realistic ROI for a 1,000 MW combined-cycle plant?
The conservative case combines four buckets. Heat-rate recovery of 1% on a 1,000 MW plant is roughly $1.5–2M annually at current fuel prices. Forced outage rate reduction of 20–30% through condition monitoring is typically $2–4M annually on aging assets. Auxiliary load optimization of 0.5 point is $800K–$1M annually. Maintenance efficiency reallocation moves 30–40% of preventive maintenance spend from calendar to condition. Total addressable value sits in the $4–8M range per 1,000 MW plant in year one, with payback typically inside the first 12 months. The exact number depends on your current heat-rate baseline, forced outage history, and maintenance program — we model this against your actuals in the Days 1–30 scoping phase.
Can we deploy iFactory across a multi-plant generation fleet?
Yes, and the architecture is built for it. Each plant gets its own on-premise NVIDIA appliance for local data sovereignty and edge AI processing. Plants in the same fleet roll up to a corporate dashboard for the executive team — fleet-wide heat-rate comparison, forced outage rate benchmarking, availability rolling, SPC alert summary across all plants. Standard loss codes, SPC zones, and asset categories are pre-tuned so cross-plant comparison is meaningful from day one. Fleet rollouts typically proceed at 3 plants per quarter after the first pilot stabilizes. Multi-plant deployments unlock the additional value of best-practice transfer — typically 3–5 points of availability recovery at lower-performing plants when leading-plant practices are systematically applied.
What happens if we stay on SAP MII through extended maintenance?
Operationally, the platform keeps running until roughly December 2030. The risks are economic and capability-based. Premium extended support is priced significantly above standard maintenance. The pool of qualified MII engineers continues to shrink as customers migrate. No new features ship — the AI-native capabilities that competitors are deploying on their plant floors are not coming to MII. Security patching slows. Integration with newer systems (S/4HANA, BTP, cloud historians) gets harder. By 2029–2030, customers still on MII are typically running it as a frozen reporting layer with iFactory or a similar AI-native platform doing the actual operations intelligence work alongside it. The decision becomes about timing, not direction.
How does iFactory pricing compare to SAP MII and SAP DM?
The models are different and not directly comparable line-for-line. SAP MII and SAP DM are licensed as enterprise software with subscription, named-user, or capacity-based pricing typical of enterprise SaaS — implementation is separate. iFactory is delivered as a turnkey appliance with hardware, software license, integration, training, and 24×7 managed service bundled into a single per-plant per-year cost. For most 1,000 MW plants, the iFactory total cost runs significantly below the value recovered in year one alone. We provide plant-specific commercial proposals during the Days 1–30 scoping phase, modeled against your actual fleet baseline and current MII spend.
The MII Migration Window Is Your AI-Native Opportunity. Don't Spend It On a Connector Swap.
Every Energy & Utilities executive running SAP MII has the same deadline approaching. Most fleets will spend the budget on a like-for-like replacement and end up with the same reporting capability they had in 2010. The fleets pulling ahead will use the same migration window to put a real AI-native intelligence layer on the plant — predictive SPC, heat-rate analytics, condition monitoring, vision inspection, operator AI guidance — once, while the stack is open anyway. iFactory ships as a turnkey on-prem appliance, layers above your existing PI, MII, and DCS, and pays back inside the first budget cycle. Let's walk through your specific fleet together.