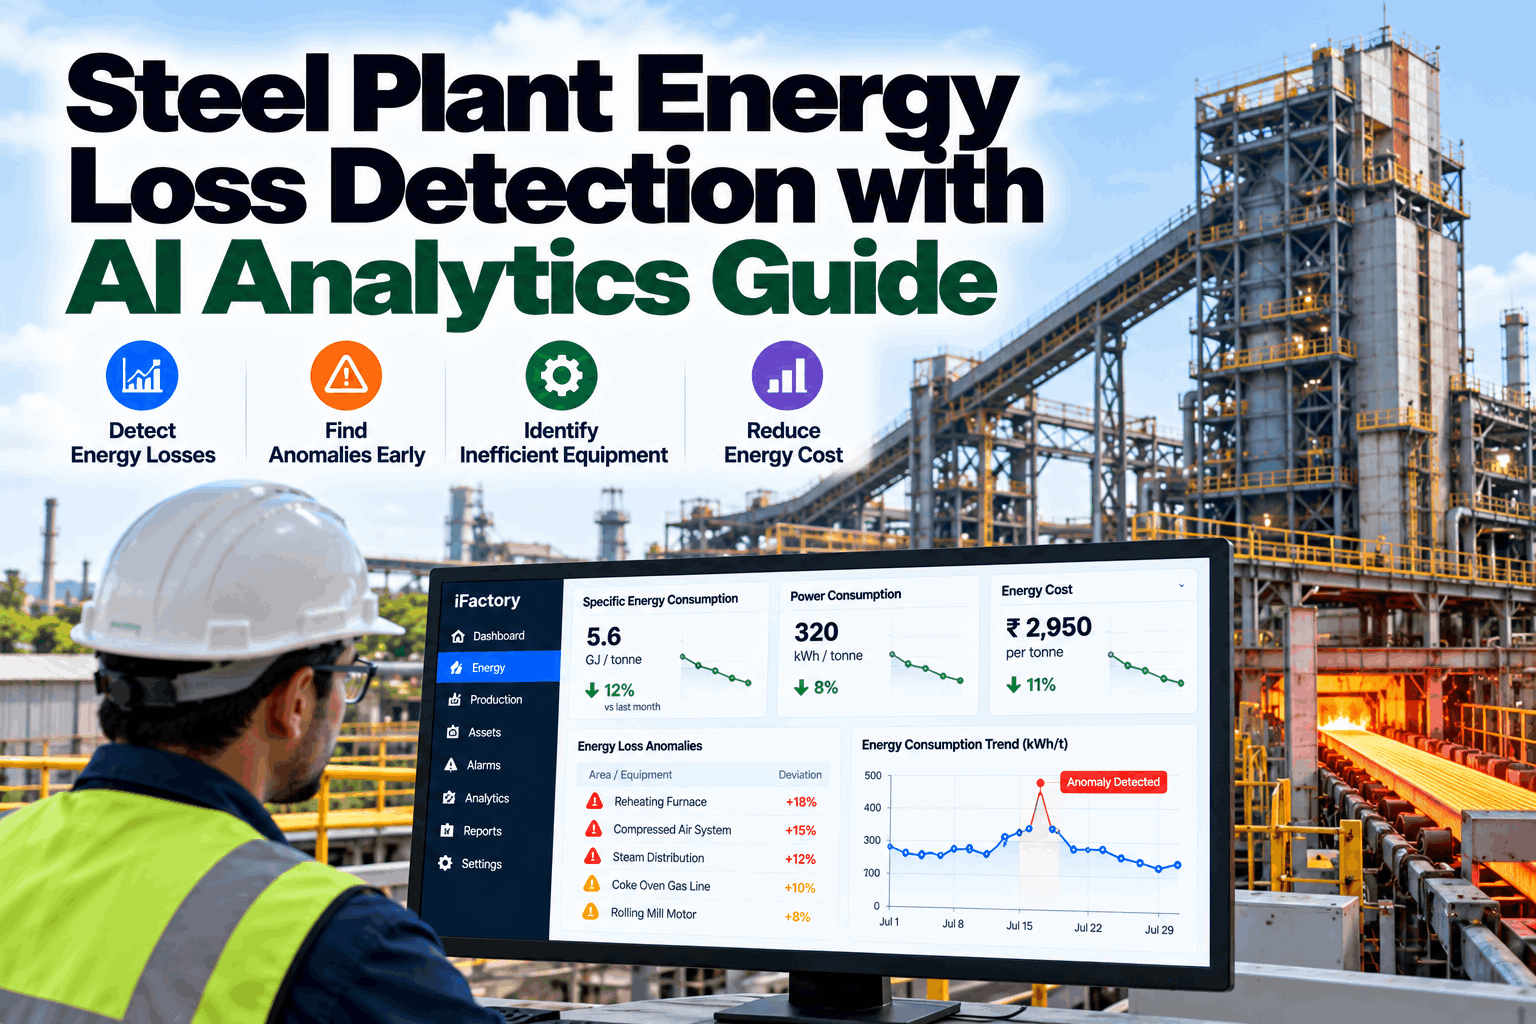
The most expensive energy losses in a steel plant are the quiet ones: a burner drifting to high excess air, a pump left at full speed after a mill change, a compressed air leak that grows a little every week. They never trip an alarm, and by the time they show up in the month-end energy report, the money is gone. AI anomaly detection learns what each unit’s kWh/t and GJ/t should be under current conditions, and it flags the gap within hours. Book a 30-minute review of the energy losses hiding in your historian data.
Expected-versus-actual energy for every unit, every hour, so drift, idle loads and leaks are caught while they are still cheap to fix.
At a Glance
Why Month-End Reports Find Losses Too Late
Energy losses in a steel plant rarely arrive as a failure. They creep in. A burner drifts to high excess air, a cooling water pump stays at full speed after a mill change, a compressed air header loses pressure through a growing leak, an exhaust fan runs through a planned stop. None of these trips an alarm. The only place they show up is the monthly energy report, averaged across a whole plant and weeks of production, by which time the loss has already been paid for.
Simple kWh/t tracking does not solve this either, because energy per tonne moves for legitimate reasons: product mix, rolling schedule, hot-charge ratio, ambient temperature. A figure that is 5% higher might be a loss or might be a heavier product mix. AI-based detection separates the two by learning what energy each unit should use under the conditions it is actually running.
How the Model Learns What Normal Looks Like
Meters, historian tags, production, grade and schedule data per unit.
Learn expected energy per unit from the drivers that legitimately move it.
Calculate the residual: actual minus expected, every hour.
Raise an alert only when the residual stays outside the band.
Show which signals changed when the drift began.
Persistence rules keep the alert stream useful. One odd hour is noise, and six hours outside the band is a finding. Each unit has its own band, learned from its own history and reviewed with the engineers who run it.
Loss Signatures and What They Usually Mean
| Signature | What it looks like | Usual causes in steel plants |
|---|---|---|
| Step change | Energy per tonne jumps and stays at a new level | Setpoint change, damper or valve left in manual, a new product route, instrument recalibration |
| Slow drift | Residual grows a little every day | Burner or heat-exchanger fouling, refractory wear, bearing and gearbox degradation, growing air leaks |
| High idle load | Consumption during stops is higher than it used to be | Fans, pumps, hydraulic units and compressors left running between campaigns |
| Off-shift base load | Night and weekend energy does not fall with production | Compressed air leaks, lighting, HVAC, auxiliary drives without interlocks |
| Start-up spikes | Unusually long or energy-heavy restarts | Heating practice after delays, cold charging, inefficient start sequences |
| Flaring | Byproduct gas flared while fuel is being bought | Gas holder limits, power plant dispatch, poor gas balance scheduling |
Losses AI Commonly Surfaces in Steel Plants
Base load that stays high when production stops is the classic leak signature, often worth fixing within days.
Furnace fuel per tonne drifts up as flue O₂ rises, so every extra percent of excess air carries heat up the stack.
Cooling water pumps and exhaust fans at fixed speed on light load are strong VFD candidates.
Hydraulic power units, lube systems and descaling pumps running through long delays.
Fan kWh per tonne of sinter rising with bed permeability or air in-leakage.
Byproduct gas flared while the same plant buys natural gas or grid power.
From Alert to Verified Fix
The unit’s residual stays outside its band long enough to count as a finding, and an alert is raised with the time drift began.
The energy engineer reviews likely causes, the related tags and cost per day, then accepts or dismisses it.
Accepted findings become actions in your CMMS or action tracker with an owner and due date.
Maintenance or operations corrects the cause, whether a damper, a setpoint, a leak or a schedule.
The alert closes only when energy returns inside the expected band, and the avoided cost is logged.
What iFactory Delivers
Normalized for production, grade mix, hot-charge ratio and ambient, for every metered unit.
Sustained deviations flagged with the start time and cost per day.
The tags and conditions that changed when drift began, ready for engineering review.
Findings pushed to CMMS or your action tracker with owners and due dates.
Alerts close only when energy returns to band, with avoided cost logged.
Open and resolved losses ranked by value for weekly energy reviews.
Metering: Where to Start
Anomaly detection is only as specific as the meters behind it. A single incoming meter can show that the plant is using more energy than expected, but not where. Most plants already have more signals than they use: historian tags for fuel flow, drive power, fan and pump current, and compressor load often serve as virtual sub-meters.
Reheating furnaces, the sinter main fan, blast furnace blowers, compressors and large pumps usually account for most controllable energy.
Drive power, motor current and fuel flow tags can model a unit before any new meter is installed.
Once a unit shows repeated findings, a dedicated meter sharpens detection and verification.
Energy and tonnage must share timestamps and unit boundaries, or the residuals are meaningless.
Share 90 days of historian and meter data for two or three units. We build expected-energy models and show the losses that monthly reports missed.
How Deployment Works
Server racked on site, historian, meter and production data connected, and metering gaps listed against the units that matter most.
Baselines and expected-energy models built per unit, then piloted with your energy and process engineers reviewing every finding.
Dashboards, alerts and reports rolled out plant-wide, teams trained, and 24×7 remote monitoring of the system in place.
Detection accuracy depends on metering. Where a unit lacks a meter, the first weeks produce a short list of sub-meters worth installing, ranked by the energy they would make visible.
Frequently Asked Questions
It learns each unit’s expected energy use from the drivers that legitimately change it, such as production, grade mix, hot-charge ratio and ambient conditions. It then flags sustained gaps between actual and expected energy.
Because kWh/t moves with product mix, schedules and conditions. Without normalization, you cannot tell a real loss from a heavier product mix.
Compressed air leaks, excess combustion air in furnaces, fans and pumps running at full speed on light load, idle auxiliaries during delays, sinter fan losses and byproduct gas flaring.
Alerts require the deviation to persist, each unit has its own learned band, and engineers’ dismissals are fed back to the model.
Energy meters or historian tags per unit, production and grade data, operating schedules and a few process signals. Gaps are listed with the sub-meters worth adding.
Most plants see their first confirmed findings during the pilot phase, weeks five to eight of a 6–12 week rollout, using historical data even before live alerts start.
iFactory learns what every unit should use, flags sustained deviations with likely causes and closes each finding only when energy is back in band.