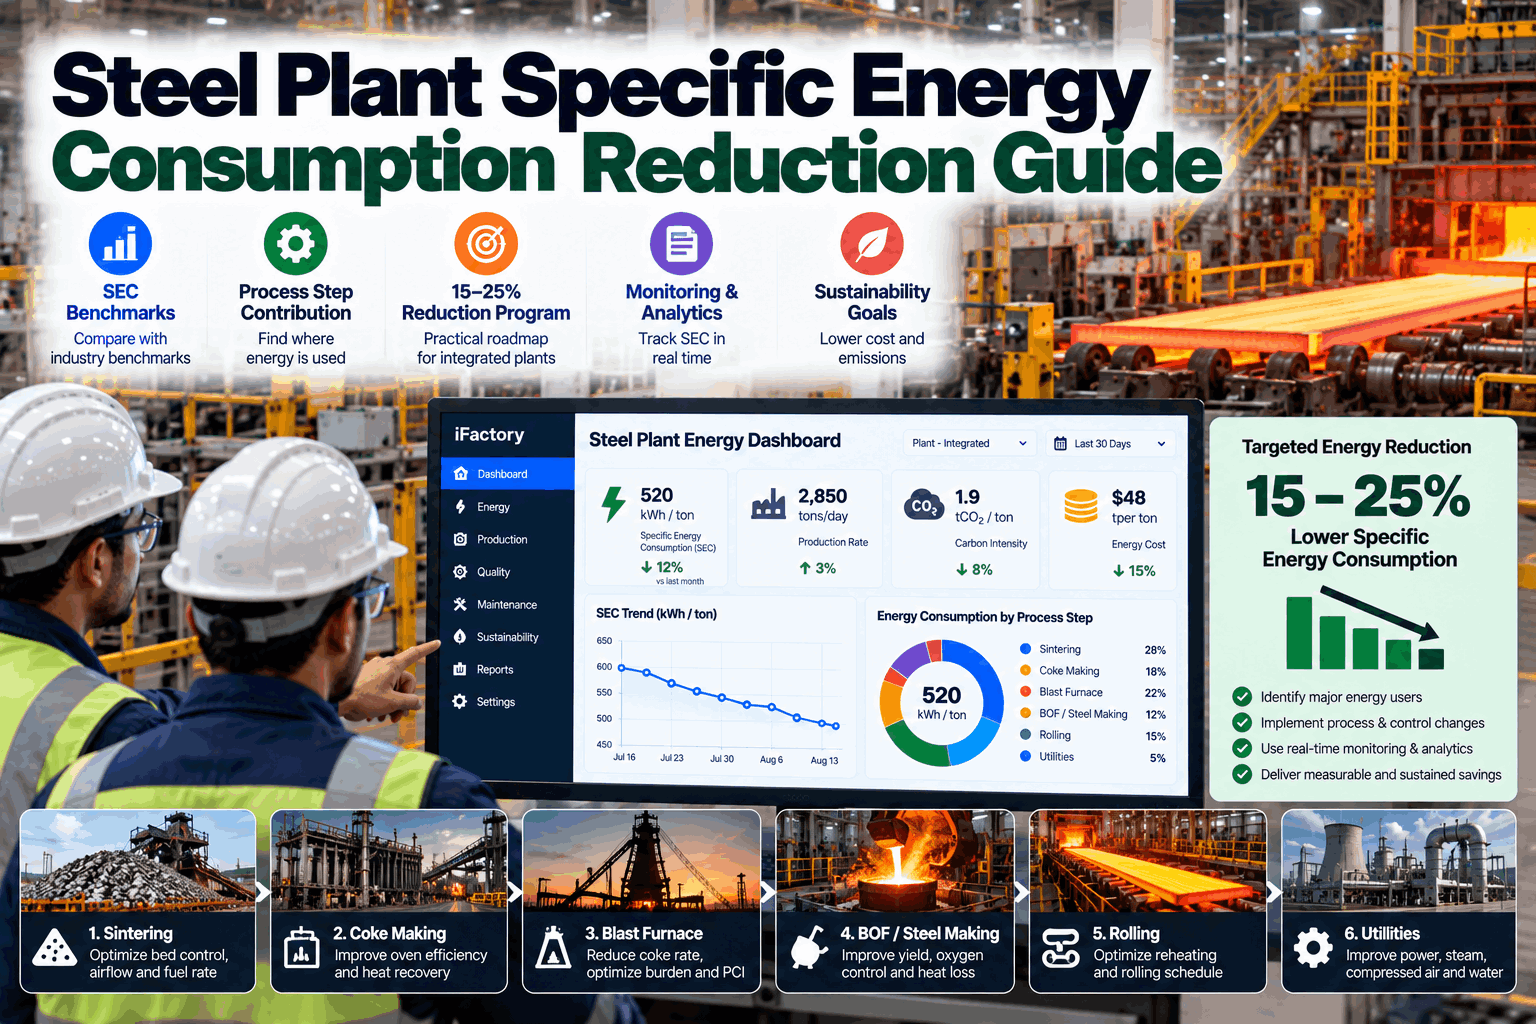
Most steel plants know their monthly energy bill to the dollar and their SEC only as a single plant-wide number that arrives weeks late. That number hides where energy is really going. It is the blast furnace’s reductant rate, the reheating furnace’s air ratio, the compressor running all night for a mill that is down. This guide explains how to measure specific energy consumption so it can be compared, how each process step contributes, and how to size a 15–25% reduction program that stands up to finance and auditors. Book a 30-minute SEC review of your plant’s energy and production data.
Measure SEC the same way everywhere, see which process steps drive it, and build a reduction plan measure by measure that finance will sign off.
At a Glance
What SEC Really Measures, and Why the Boundary Matters
Specific energy consumption is the net energy a plant, or a single process unit, uses to produce one tonne of output. At plant level it is usually expressed as gigajoules per tonne of crude steel (GJ/tcs). At unit level the denominator changes, for example GJ per tonne of sinter, of hot metal, or of slab reheated. The number looks simple, but three accounting choices decide whether it can be compared with anything.
Does the figure include the coke ovens, the captive power plant, oxygen plant and lime kilns? Two plants with identical operations can differ by several GJ/t on boundary alone.
Purchased power counted as delivered energy or converted to primary energy changes EAF and utility-heavy results sharply. Pick one convention and state it.
Byproduct gas, steam or power sent outside the boundary should be credited, while flared gas is a loss, not a credit.
Crude steel, liquid steel or finished product give different answers. Executives and engineers need to be using the same one.
Benchmarks: Where the Industry Stands
Averages hide the route. worldsteel’s data shows why a blast furnace plant and a scrap-based electric arc furnace plant should never be benchmarked against each other on raw GJ/t:
| Route | Coal | Electricity | Natural gas | What that means for SEC work |
|---|---|---|---|---|
| BF-BOF (integrated) | 70–80% | 10–15% | 5–15% | Ironmaking dominates; gas recovery and heat recovery matter most |
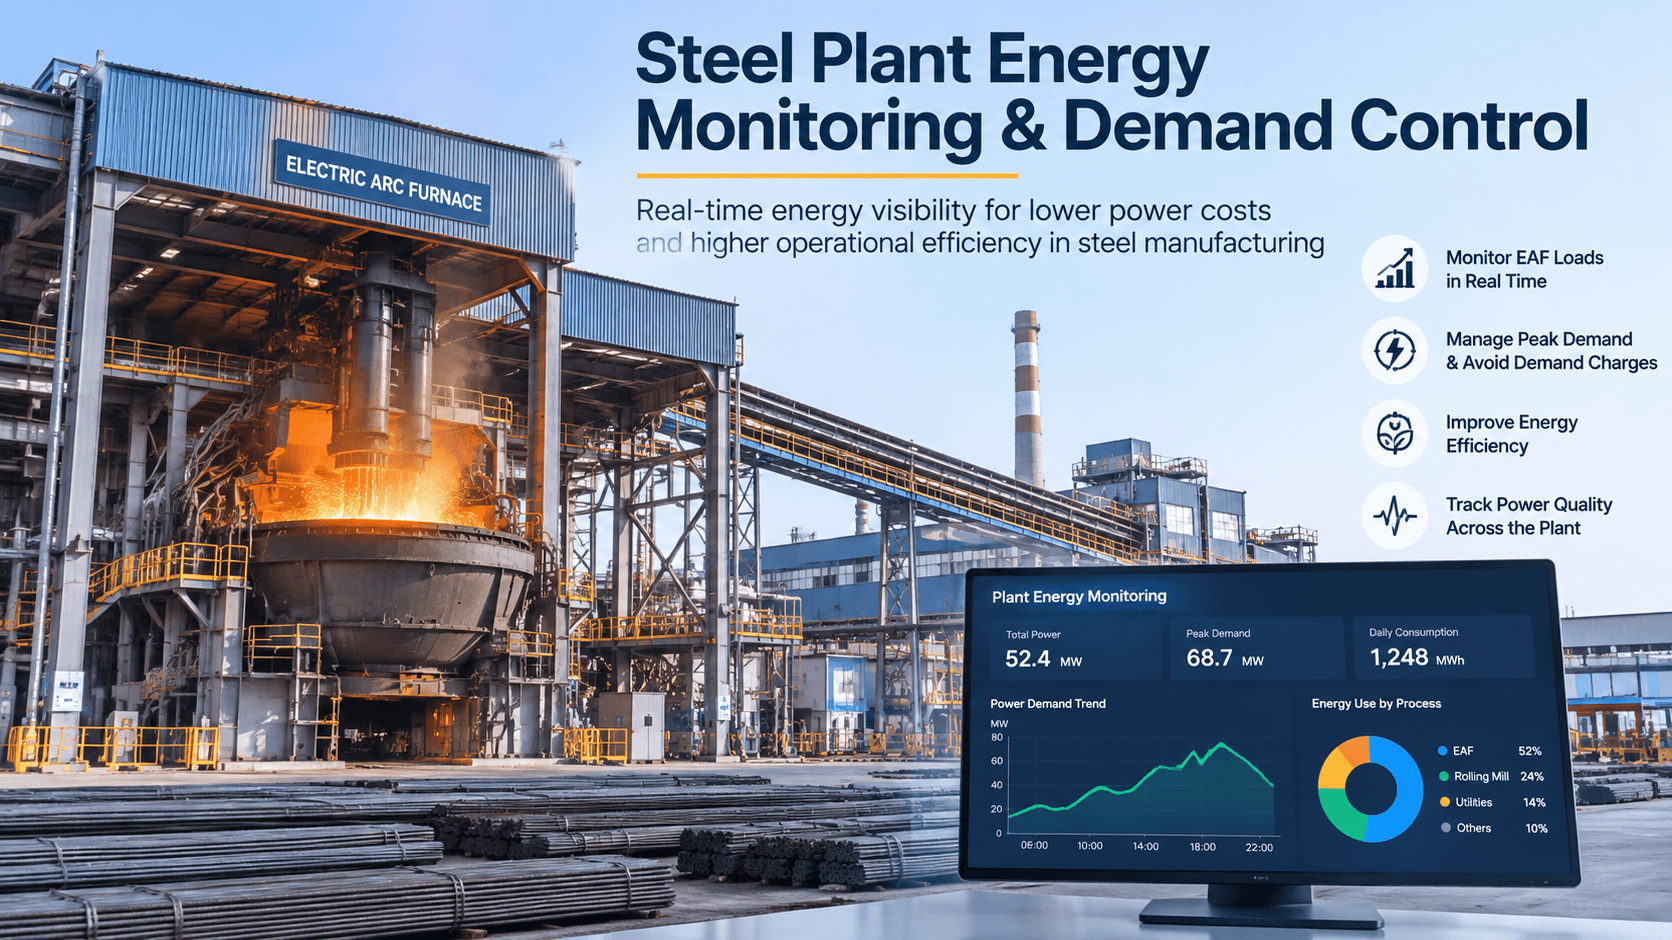
| EAF, 100% scrap | 5–15% | 50–70% | 10–25% | Electrical efficiency, power-on time and tariff strategy dominate |
Share of energy input by source, per worldsteel. Compare like with like: route, product mix and boundary first, then GJ/t.
Where the Energy Goes: Process Step Contribution
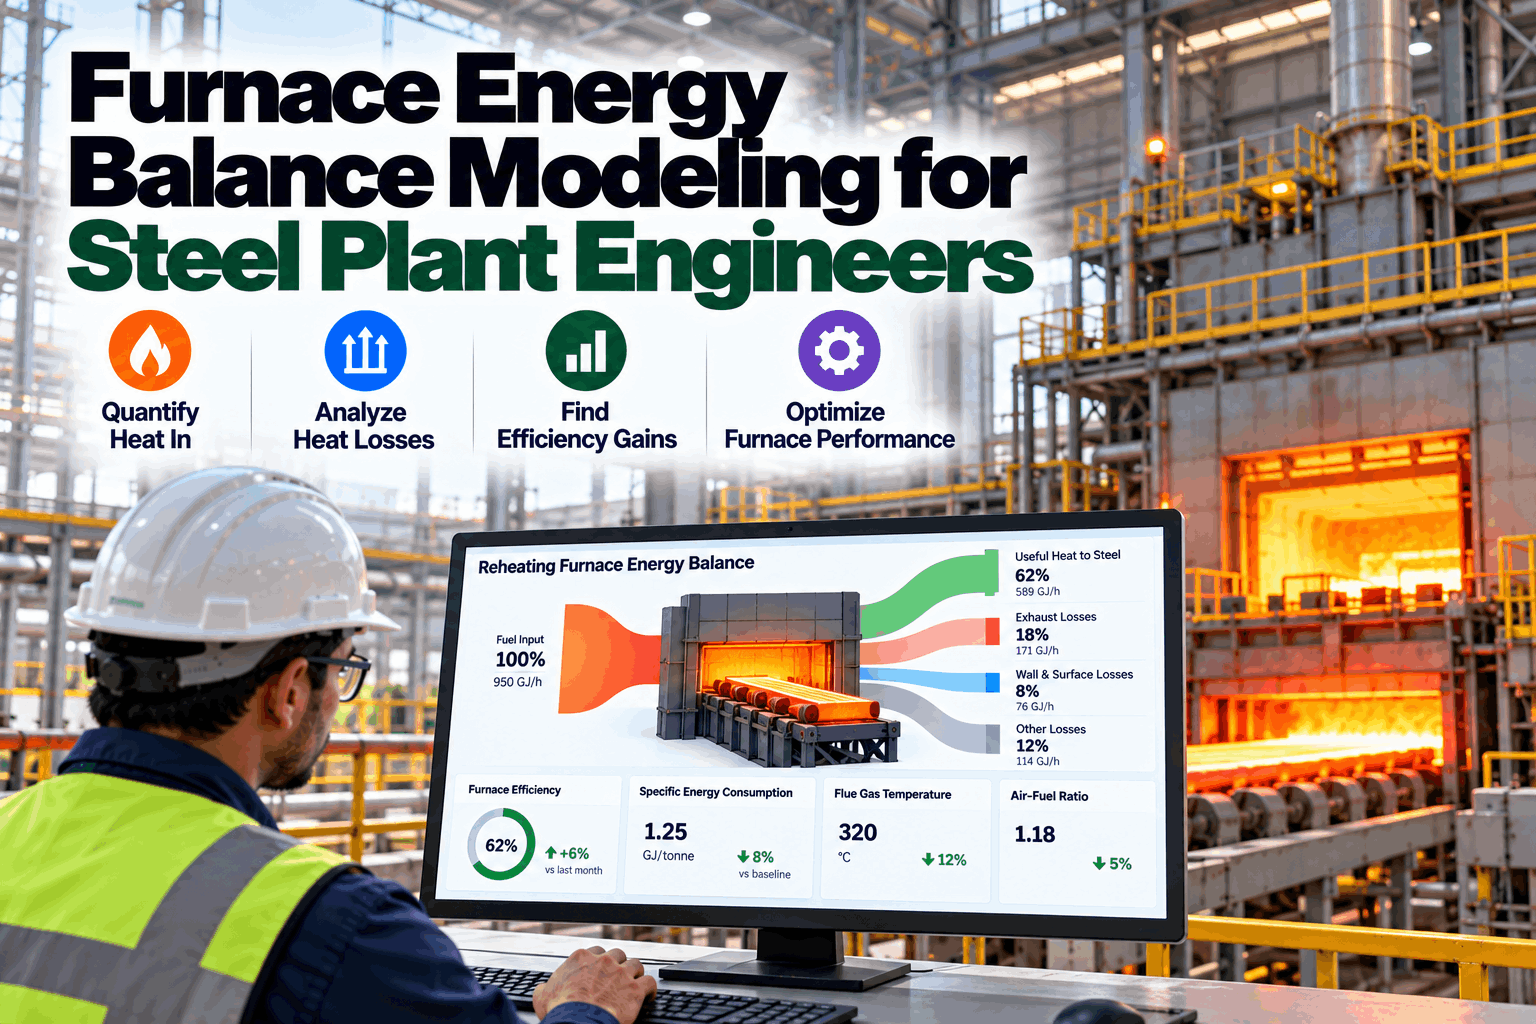
In an integrated plant the blast furnace, together with the coke ovens and sinter plant that feed it, is the largest energy consumer by a wide margin. Downstream, reheating furnaces are the biggest single fuel user. The table maps each step to what drives its SEC and the levers most plants examine first.
| Process step | What drives its SEC | Levers usually examined first |
|---|---|---|
| Coke ovens | Heating gas use, coking time, moisture of coal charge | Battery heating control, coke dry quenching, coal moisture control |
| Sinter plant | Solid fuel rate, ignition gas, fan power, cooler losses | Fuel rate optimization, ignition hood control, cooler heat recovery, main fan speed |
| Blast furnace | Reductant rate (coke plus injectants), hot blast temperature, stove efficiency | Reductant rate control, stove combustion, top-gas recovery turbine |
| BOF shop | Converter gas recovery rate, ladle heating | Gas recovery and holder management, ladle cover and preheat practice |
| Casting | Tundish and ladle preheating | Preheater burner tuning, hot transfer of slabs |
| Reheating and rolling | Furnace fuel rate, charge temperature, delays, mill motor load | Combustion air ratio, hot charging, delay strategies, drive efficiency |
| Utilities | Compressed air, pumps, fans, steam and oxygen generation | Leaks and pressure, VFDs, pump and fan right-sizing |
| Byproduct gas system | Balance between gas generated and used; flaring | Gas holder scheduling and power plant dispatch |
Sizing the 15–25% Opportunity Honestly
Many integrated plants that compare themselves with best-available-technology benchmarks find double-digit reduction potential. This guide uses 15–25% as a planning range: large enough to justify a program, but a figure your own audit has to confirm unit by unit. The discipline that makes the number credible is building it bottom-up.
Combustion air ratio tuning, idle-load shutdowns, compressed air leak repair and furnace delay strategies. Usually the first savings to land.
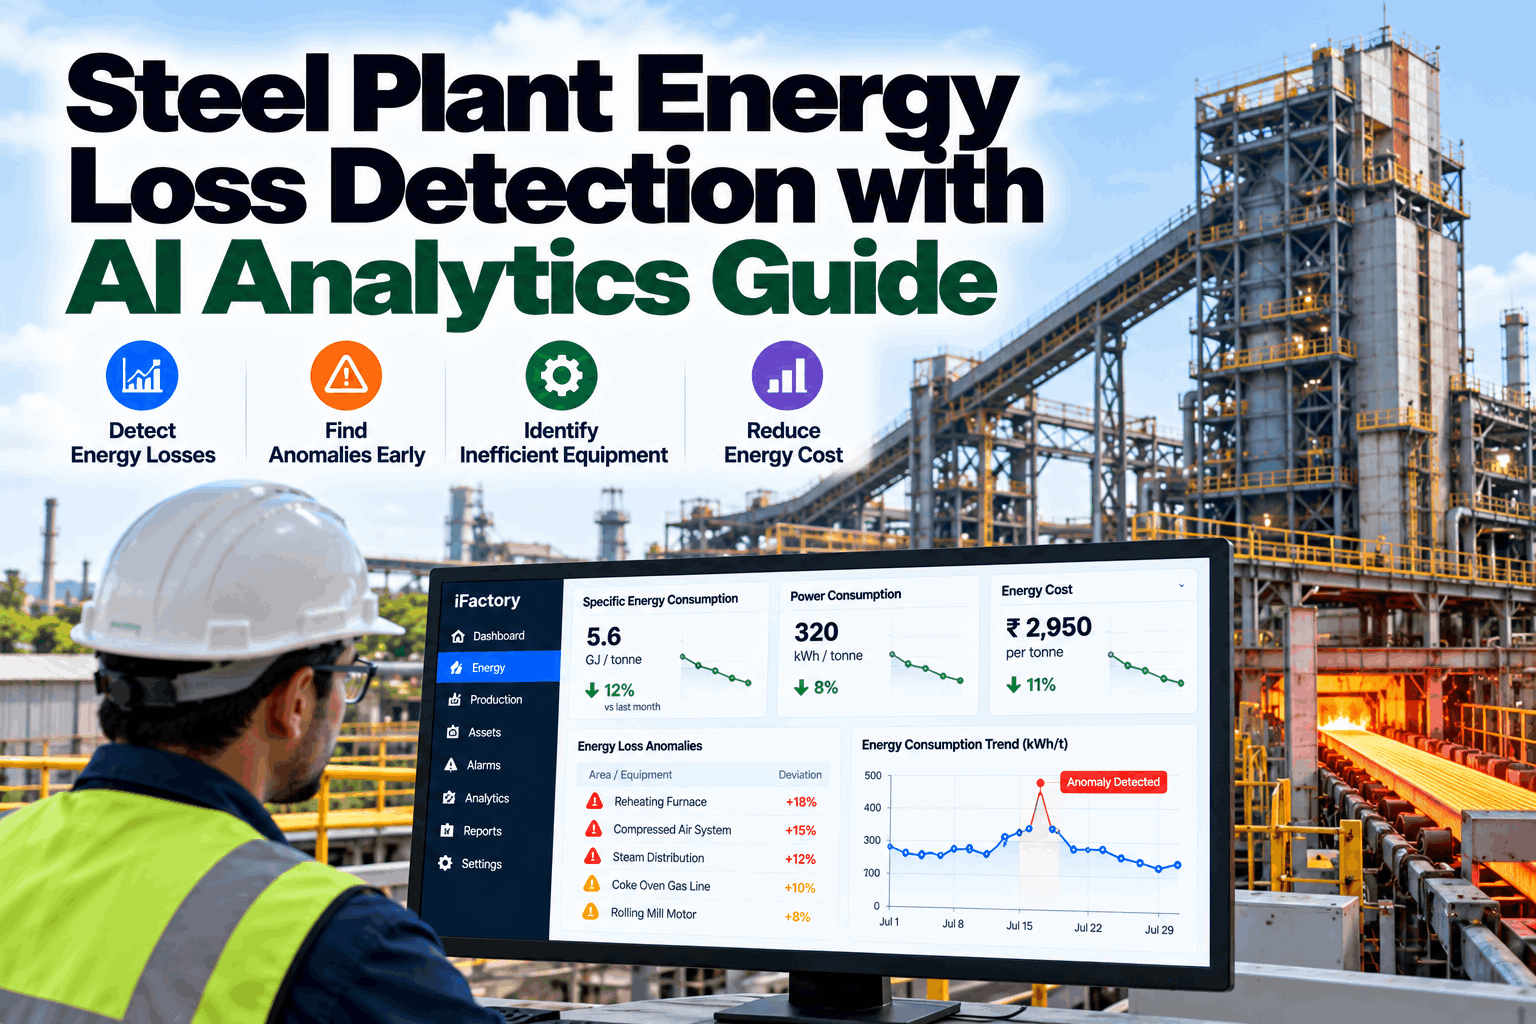
Advanced process control, byproduct gas balance optimization and anomaly detection on unit SEC.
Top-gas recovery turbines, coke dry quenching, sinter cooler and furnace flue heat recovery.
Variable speed drives, IE4/IE5 motors, regenerative burners and more efficient compressors.
Why SEC Now Carries Regulatory Weight
Under the recast Energy Efficiency Directive, companies using more than 10 TJ a year face energy audits, with the first due by October 11, 2026. Those above 85 TJ need a certified energy management system by October 11, 2027.
The definitive CBAM regime began on January 1, 2026. Iron and steel importers declare embedded emissions, with the first annual declaration due by September 30, 2027.
Greenhouse gas intensity targets for 255 iron and steel entities were notified in June 2026, with reductions of 2.1–9.3% by entity type and compliance starting in FY 2026–27.
Energy intensity is the largest lever on carbon intensity in most plants, so an SEC program is also a compliance program.
What iFactory Delivers
Energy per tonne for every process unit, updated hourly from historian, meters and production data.
One documented accounting convention for boundary, electricity and byproduct gas credits across sites.
Normalized for production, grade mix and hot-charge ratio, so drift is visible within a shift.
Measures ranked by value per unit capex, stacked without double counting.
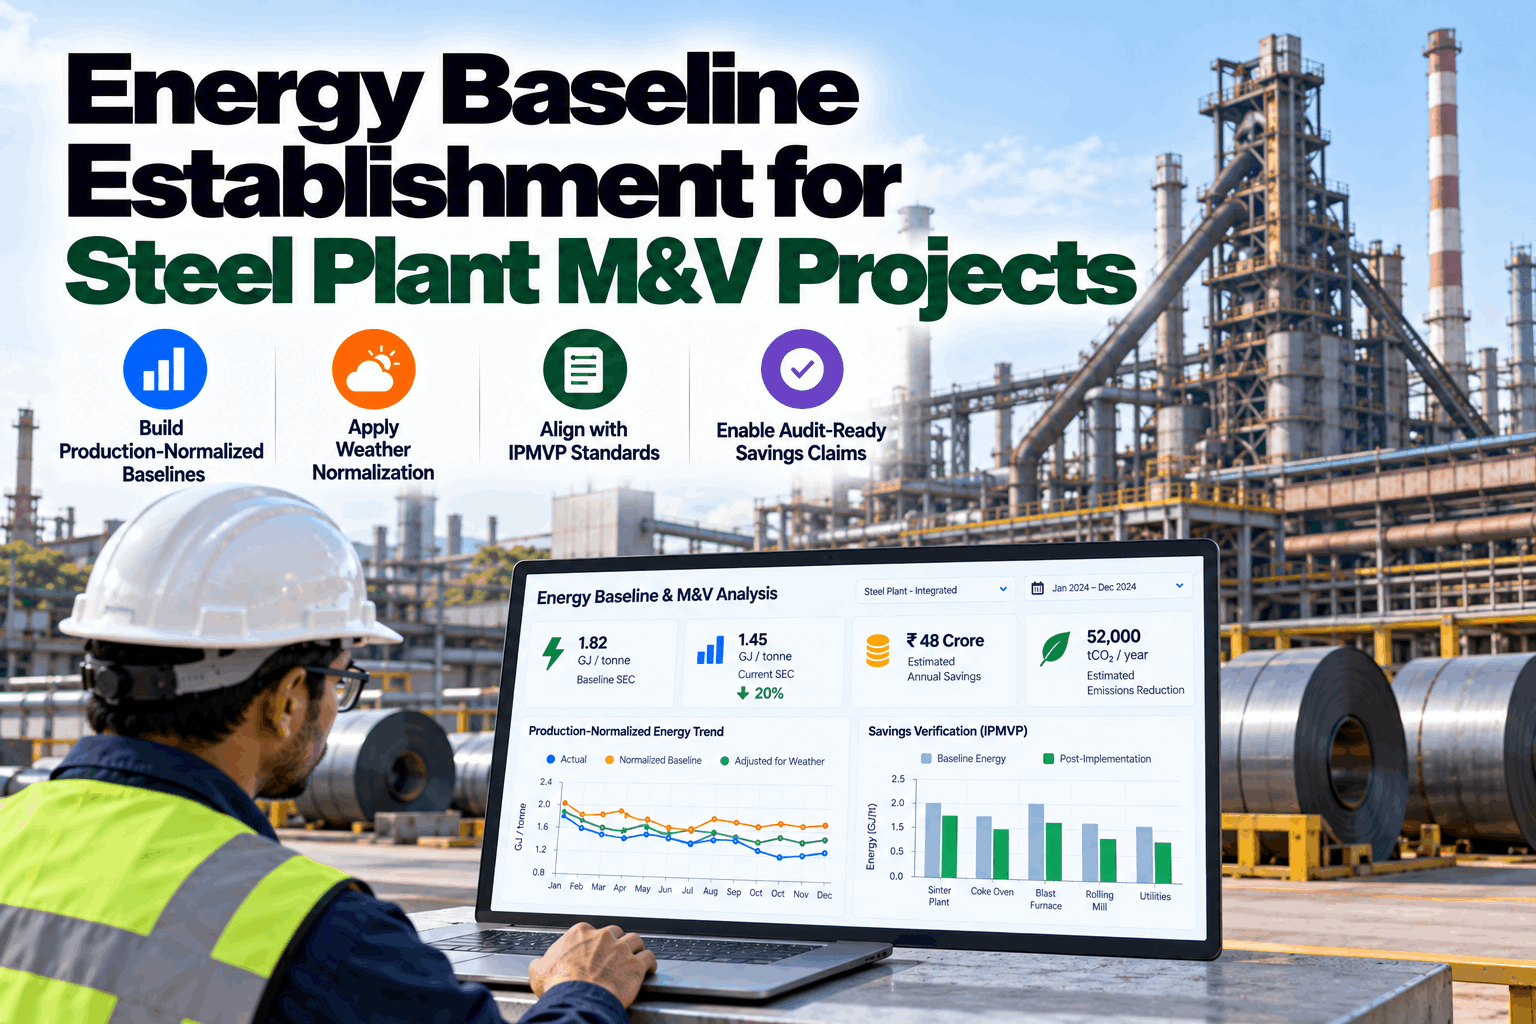
Delivered savings measured against production-normalized baselines, ready for finance and auditors.
Ask why SEC moved and get the drivers with the evidence attached.
Share a year of energy and production data. We map your boundary, calculate unit SEC and show where the 15–25% planning range looks realistic for your plant.
How Deployment Works
Server racked on site, historian, meter and production data connected, and metering gaps listed against the units that matter most.
Baselines and expected-energy models built per unit, then piloted with your energy and process engineers reviewing every finding.
Dashboards, alerts and reports rolled out plant-wide, teams trained, and 24×7 remote monitoring of the system in place.
Most plants start with two or three units, typically the reheating furnaces, the sinter plant and utilities, where metering is good enough and the savings show quickly, then extend to the full plant.
Frequently Asked Questions
It is the net energy used per tonne of output, expressed as GJ per tonne of crude steel at plant level or per tonne of unit output, such as sinter or hot metal, at process level.
worldsteel reported an average of 20.95 GJ per tonne of crude steel in 2024. Meaningful benchmarks must match route (BF-BOF or EAF), product mix and accounting boundary.
Ironmaking, with the blast furnace as the largest single consumer, followed by coke ovens and the sinter plant. Reheating furnaces are the largest fuel user downstream.
It is a planning range many integrated plants use when comparing against best-available technology. The real figure depends on your starting point and must be built measure by measure from an audit.
Stack measures in sequence and recalculate the base each time. For example, hot charging reduces the savings available from later furnace combustion tuning. Verify against production-normalized baselines.
Typical programs go live in 6–12 weeks. The first units usually show hourly SEC within the first month once historian and meter data are connected.
iFactory shows SEC by process unit in real time, sizes the reduction opportunity honestly and verifies what each measure delivers.