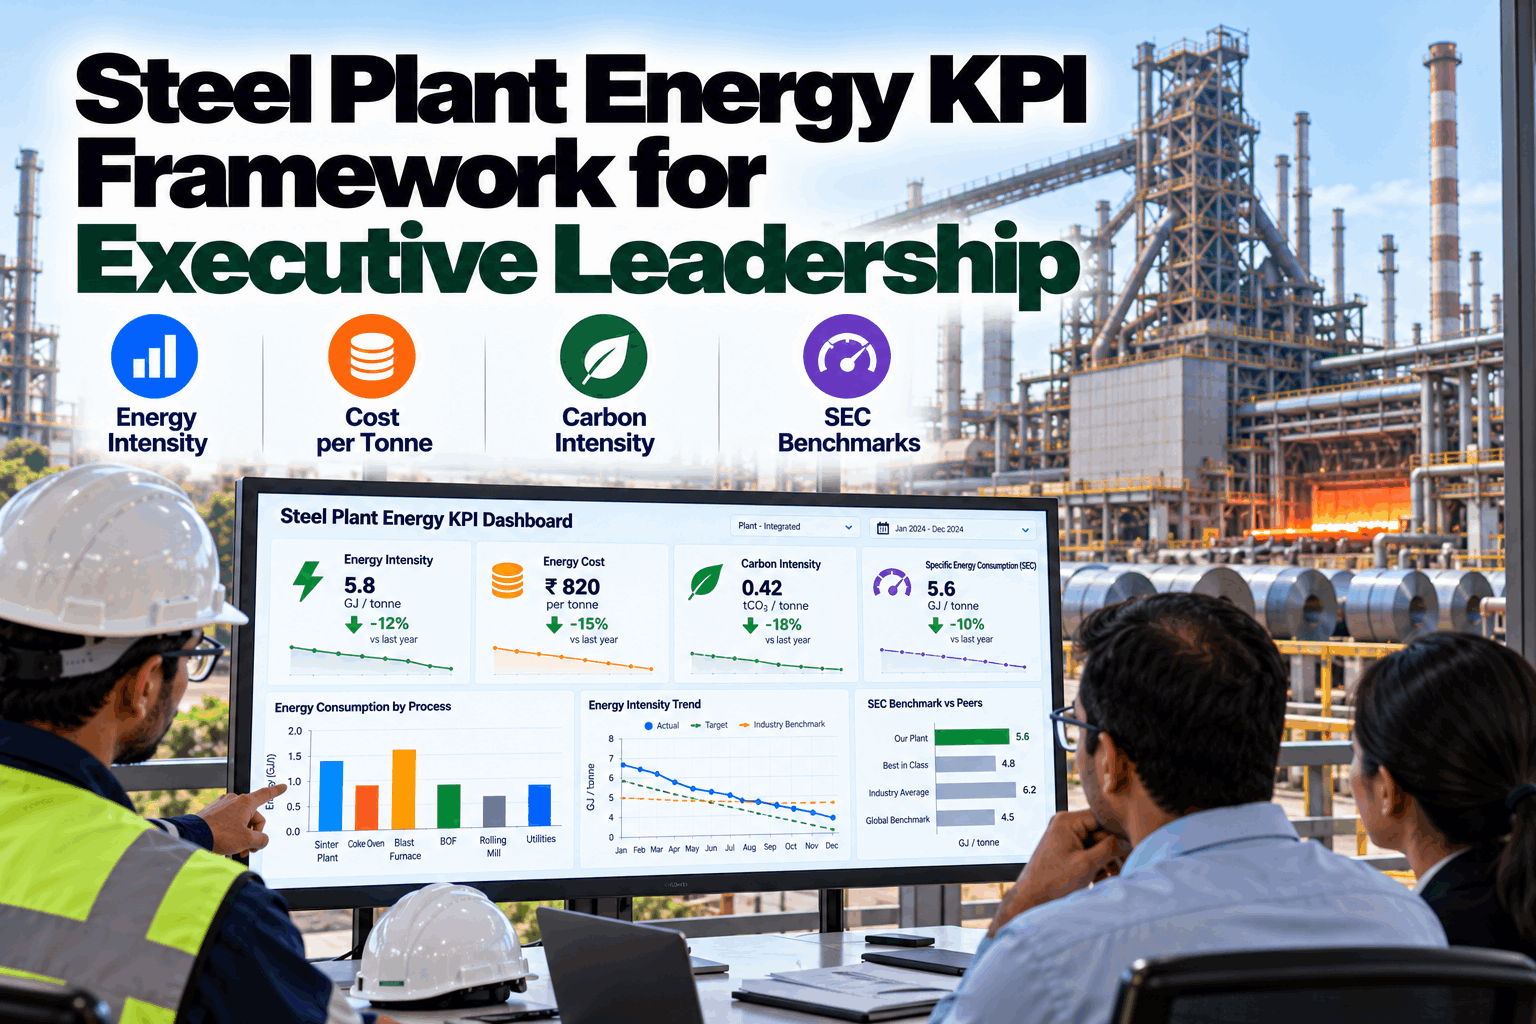
Steel leadership teams rarely lack energy data. They lack one version of it. Finance sees cost, operations sees gigajoules, sustainability sees carbon, and the three often tell different stories in the same month. This framework gives executives a small set of energy KPIs defined the same way at every site. It separates price from performance and links the board number to the process units behind it, so energy reviews end with decisions instead of reconciliation. Book a 30-minute review to build your executive energy scorecard.
Energy intensity, cost per tonne, carbon intensity and unit SEC on one scorecard, defined once and traceable from the board to the burner.
At a Glance
Why Executives Get Mixed Signals on Energy
In many steel companies the leadership team sees energy three different ways. Finance reports energy cost, operations reports GJ per tonne, and sustainability reports tonnes of CO₂. Each number is accurate, and they regularly point in different directions. Energy cost per tonne rises in a month when efficiency improved, because gas prices spiked. Carbon intensity falls while the plant wastes more energy, because more scrap went into the converter. Without a framework that ties them together, the leadership conversation becomes a debate about whose number is right.
A good executive framework does three things. It defines each KPI once, precisely. It separates what management controls, efficiency, from what it mostly does not, price. And it lets anyone drill from the board-level figure down to the process unit and equipment that moved it.
The Four-Level KPI Tree
Energy intensity (GJ/tcs), energy cost per tonne and carbon intensity (tCO₂/tcs), reported monthly to the executive team and quarterly to the board.
The same three KPIs by plant and by route (BF-BOF or EAF), so each site is compared with its own peers rather than with a different process.
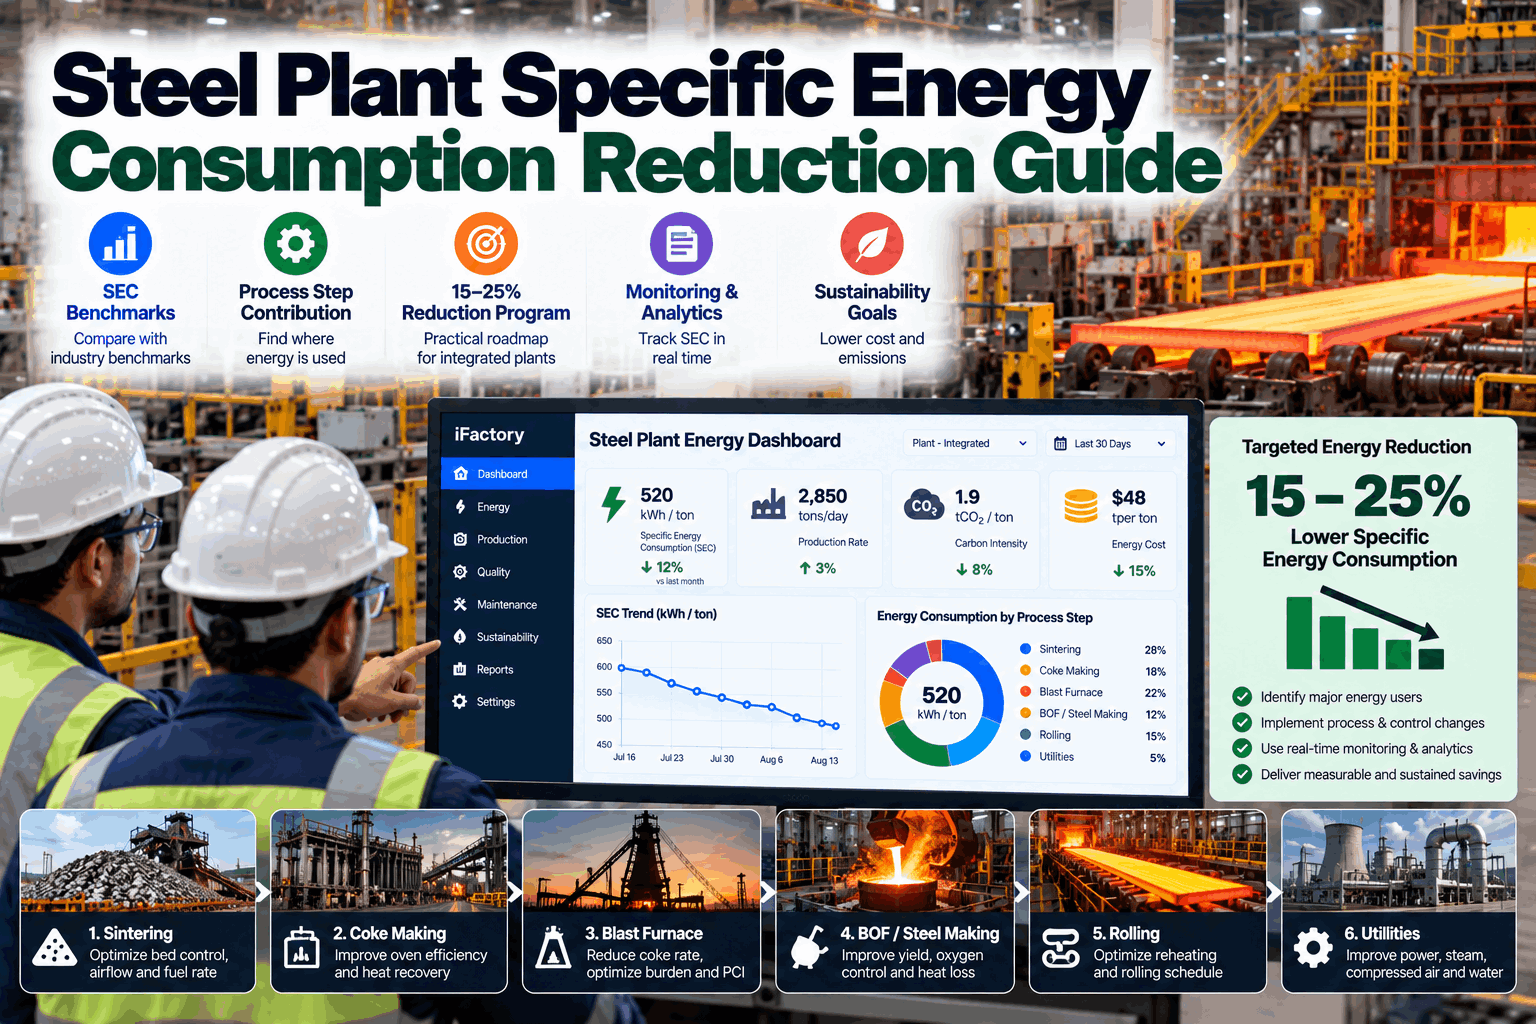
Specific energy consumption for each unit, such as sinter, hot metal, BOF, reheating and rolling, against a normalized target.
Energy signatures for furnaces, fans, pumps, compressors and drives, the level where engineers find and fix losses.
The tree works in both directions. When the board number moves, leaders can follow it down to the unit and the equipment behind it. When an engineer fixes a loss at level four, the saving rolls up through the unit and site figures to the company scorecard, so frontline work is visible where budgets are set.
KPI Definitions That Hold Up Across Sites
| KPI | Formula | Unit | Owner | Cadence |
|---|---|---|---|---|
| Energy intensity | Net energy within the boundary ÷ crude steel | GJ/tcs | COO / head of energy | Monthly |
| Energy cost per tonne | Total energy cost ÷ crude steel | $/t | CFO | Monthly |
| Carbon intensity | Scope 1 and 2 CO₂ ÷ crude steel | tCO₂/tcs | Chief sustainability officer | Monthly or quarterly |
| Unit SEC vs target | Unit net energy ÷ unit output, compared with its normalized target | GJ/t of unit output | Plant managers | Weekly |
| Byproduct gas utilization | Gas used ÷ gas generated; flared volume tracked separately | % | Energy manager | Daily and weekly |
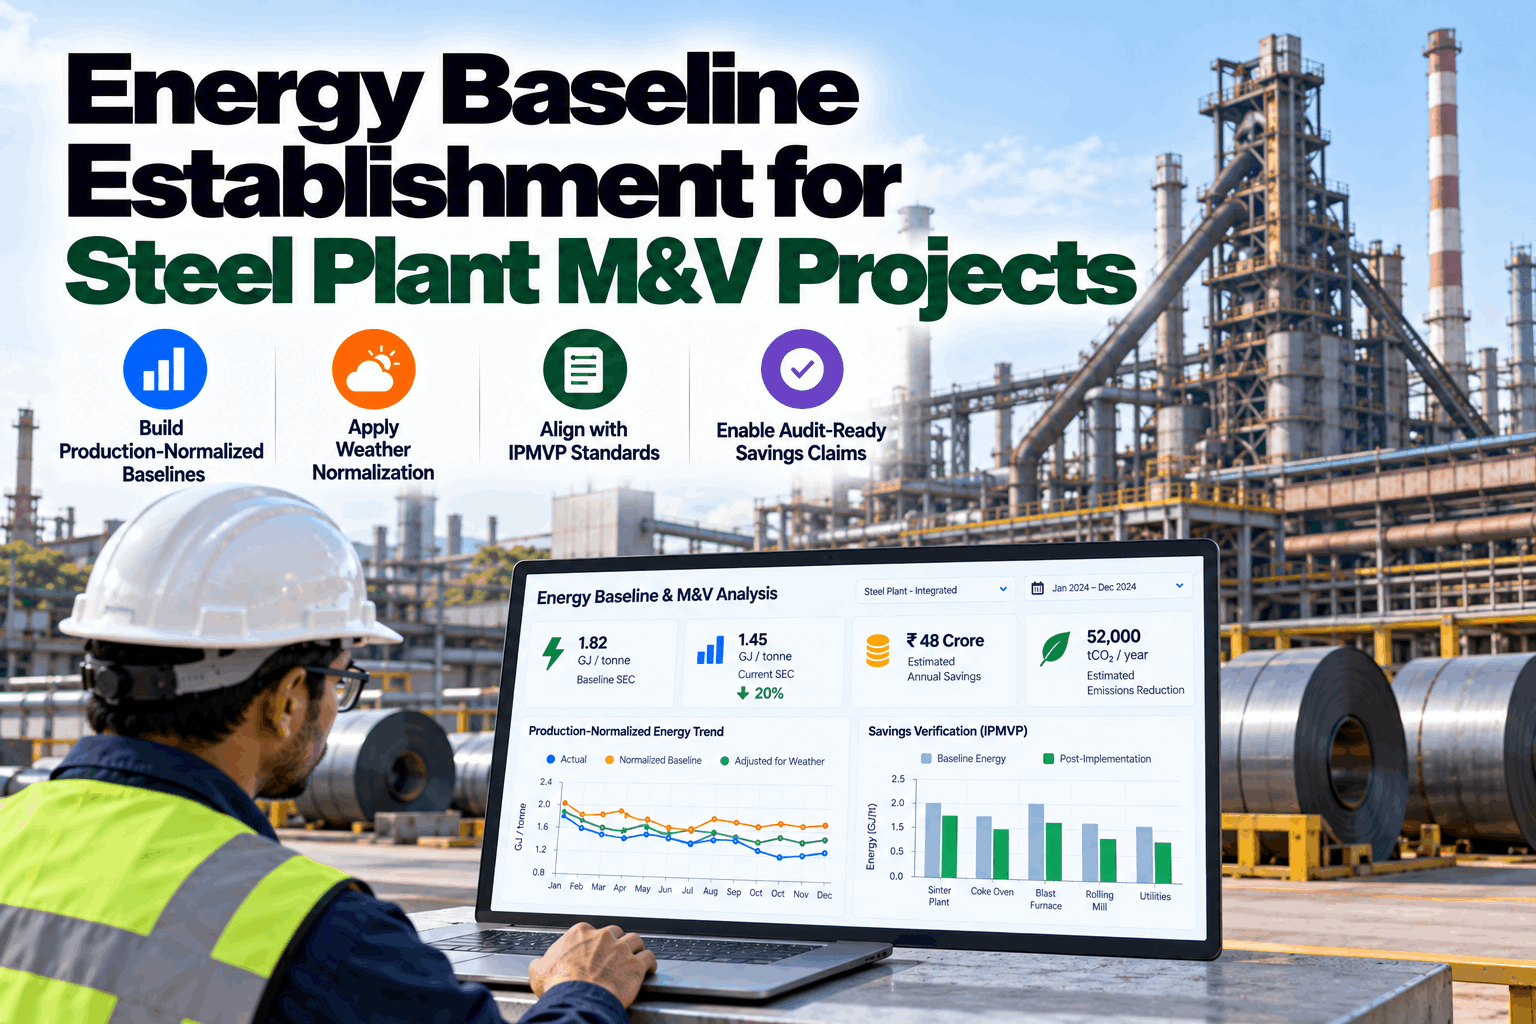
| Verified savings | Savings measured against production-normalized baselines | GJ and $ | Energy manager with finance | Quarterly |
Write down the boundary (are the coke ovens and captive power plant inside?), the denominator (crude, liquid or finished steel) and how purchased electricity is counted. Those three choices move results more than most efficiency projects do.
Separate Price, Efficiency and Mix
Energy cost per tonne is the number boards look at first, and the one most easily misread. The fix is a simple variance bridge that splits the change into what drove it.
Presented this way, the story is clear: the plant improved efficiency, but energy markets more than offset it. The operating team gets credit for the efficiency it controlled, and the board sees the exposure it needs to hedge or contract differently.
External Benchmarks and Regulatory Context
Definitive since January 1, 2026. Embedded emissions of steel imported into the EU are declared and paid for through CBAM certificates, which makes carbon intensity a commercial number for exporters.
Emission-intensity targets for 255 iron and steel entities were notified in June 2026, with 2.1–9.3% reductions and compliance from FY 2026–27.
Energy audits by October 11, 2026 for companies above 10 TJ a year, and a certified energy management system by October 11, 2027 above 85 TJ.
A Review Cadence That Drives Action
Plant managers review unit SEC against target and open actions.
The executive team reviews the scorecard and variance bridge.
The board sees intensity, cost and carbon trends with verified savings.
Targets are reset from audit results, benchmarks and regulation.
What iFactory Delivers
The same definitions, data and drill-down for the CFO, the COO, plant managers and energy engineers.
Intensity, cost and carbon on one page with trend and target.
Price, efficiency and mix effects calculated automatically every month.
Boundary, denominator and accounting rules documented and applied at every site.
From company to site, unit and equipment in a few clicks.
Measured against normalized baselines, ready for finance and assurance.
Carbon intensity prepared for CBAM and CCTS reporting.
Common KPI Mistakes to Avoid
One site reports per tonne of crude steel, another per tonne shipped. Compared side by side, both are wrong.
Cost moves with energy prices the plant does not control. Always show efficiency separately.
Comparing a BF-BOF site with an EAF site, or a long-products mill with a flat mill, on raw GJ/t rewards the wrong behavior.
Twenty energy indicators on a board slide means none of them gets discussed. Keep four at the top and push the rest down the tree.
Savings reported without a normalized baseline erode trust the first time finance checks them.
A scorecard that arrives three weeks after month-end describes history. Unit-level data should be live.
Bring last year’s energy cost, production and emissions data. We define the KPIs, build the variance bridge and show your leadership scorecard.
How Deployment Works
Server racked on site, historian, meter and production data connected, and metering gaps listed against the units that matter most.
Baselines and expected-energy models built per unit, then piloted with your energy and process engineers reviewing every finding.
Dashboards, alerts and reports rolled out plant-wide, teams trained, and 24×7 remote monitoring of the system in place.
Frequently Asked Questions
Energy intensity (GJ/tcs), energy cost per tonne, carbon intensity (tCO₂/tcs) and the share of process units meeting their SEC targets, supported by byproduct gas utilization and verified savings.
Because cost combines price and consumption. A variance bridge separates the price effect, the efficiency effect and the mix effect so each is visible.
Use the same boundary, denominator and electricity accounting at every site, and compare BF-BOF plants with BF-BOF plants and EAF plants with EAF plants.
worldsteel reports an average of 20.95 GJ per tonne of crude steel and 1.92 tonnes of CO₂ per tonne of crude steel for 2024.
CBAM’s definitive period started in 2026. Embedded emissions of steel exported to the EU carry a cost, so carbon intensity, which is driven mostly by energy use, becomes a commercial KPI.
Monthly at executive level with the variance bridge, and quarterly at board level with trends, verified savings and regulatory exposure.
iFactory gives steel leadership an energy scorecard that separates price from performance and traces every number to the unit that moved it.