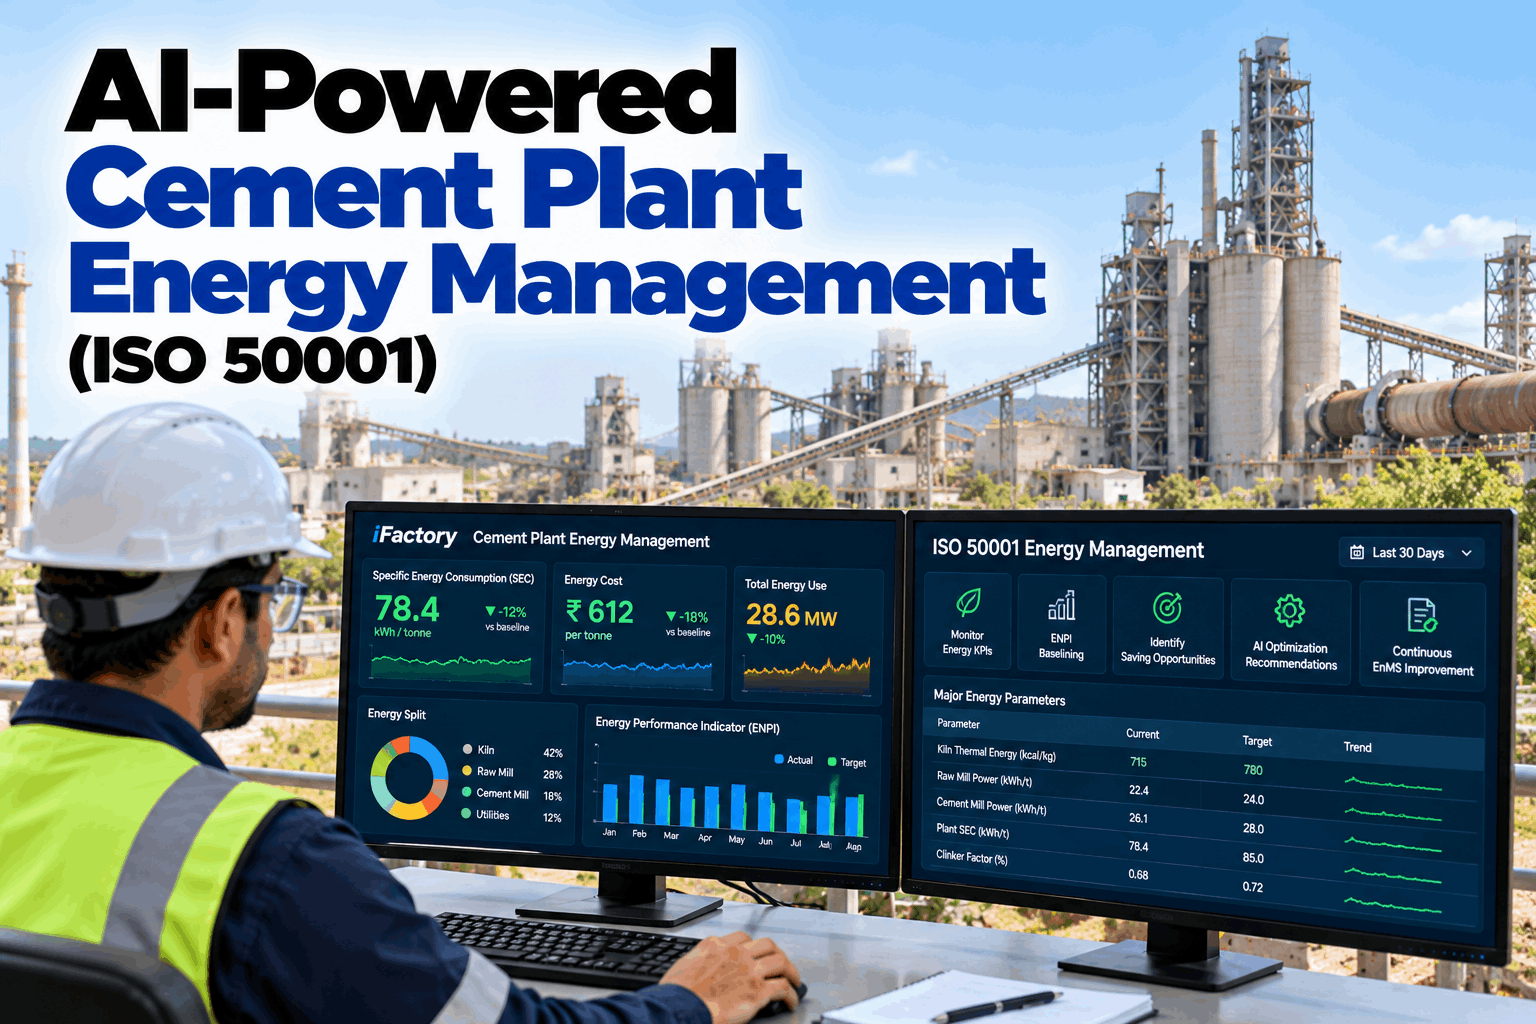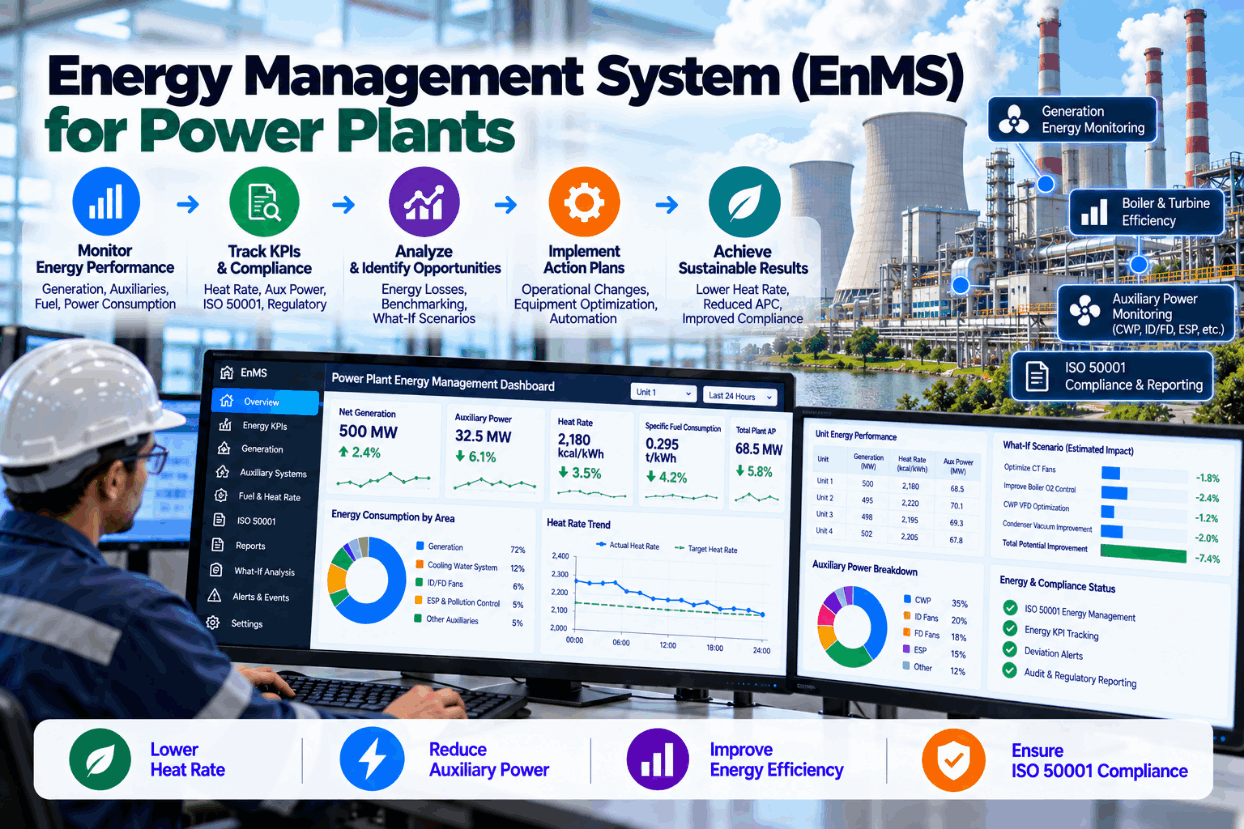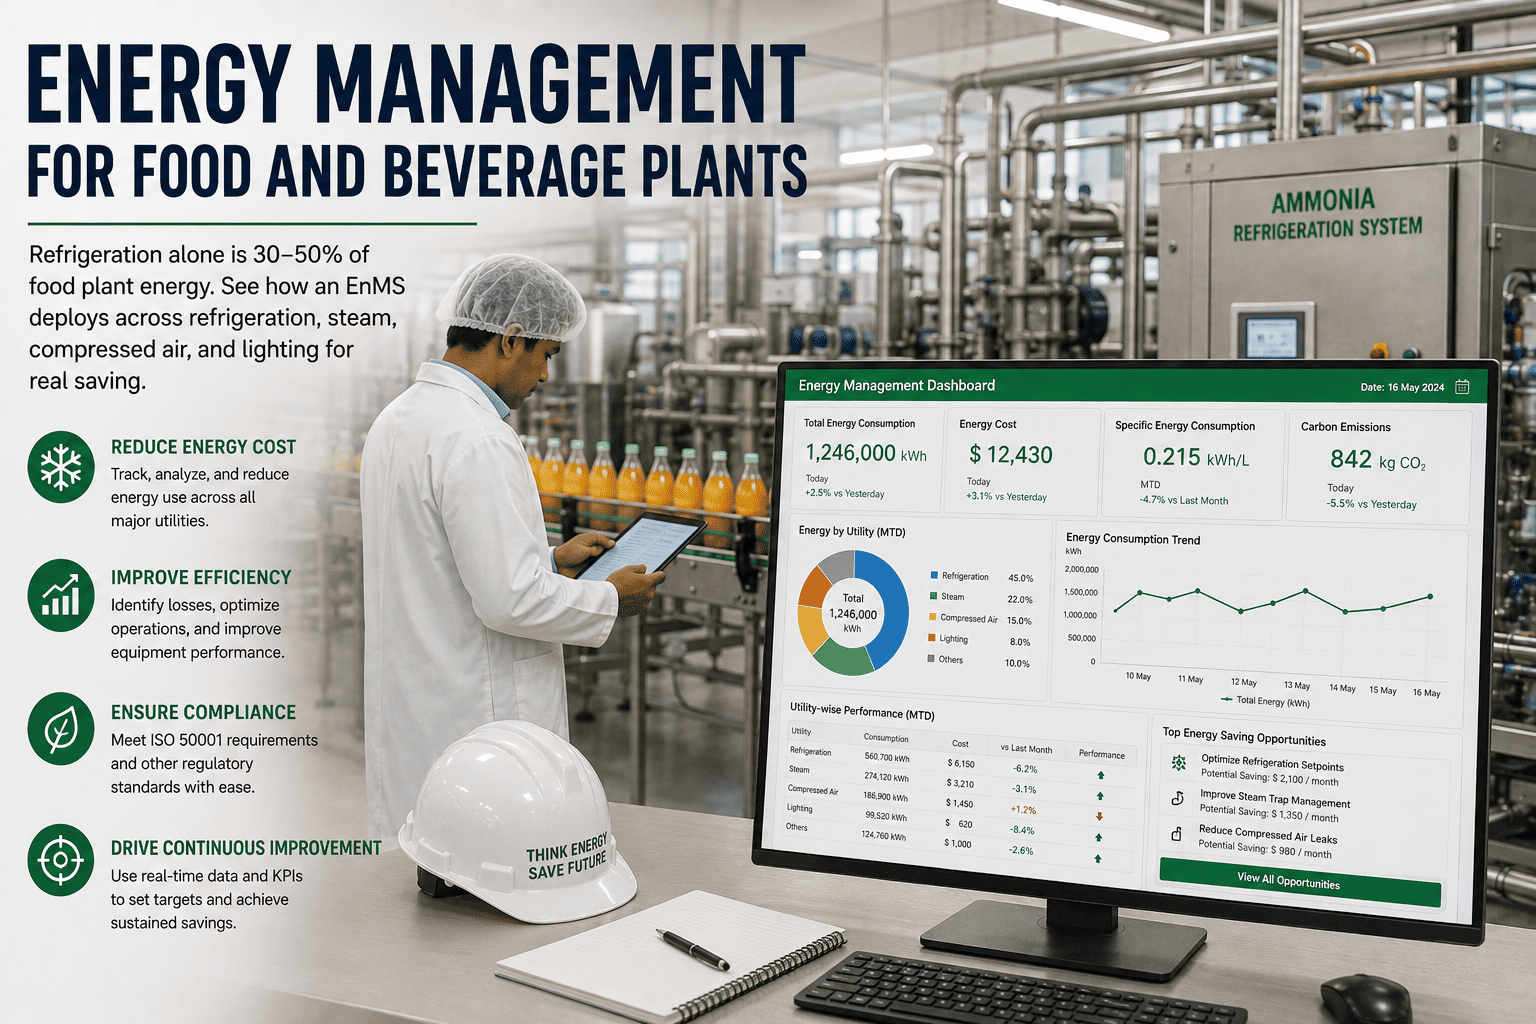
Energy is the second-largest controllable cost in a food or beverage plant — behind raw materials, but ahead of labor, packaging, and maintenance combined — and it is the one cost most plants systematically under-manage. The average facility spends between $1.2M and $4.8M a year on electricity, gas, steam, and compressed air, yet fewer than 28 percent track consumption at the equipment level where the waste actually happens. Refrigeration alone runs 30 to 50 percent of plant energy; steam, compressed air, and lighting account for most of the rest. The difference between a reactive annual audit and a live energy management system is the difference between walking past waste and eliminating it. This guide walks through how an EnMS deploys across all four systems. To see it mapped on your plant, book a demo.
Four Systems Drive Your Energy Bill — An EnMS Manages All of Them
Refrigeration, steam, compressed air, and lighting account for the overwhelming majority of food plant energy. A structured energy management system finds the waste in each, ranks it by payback, and holds the savings in place — the same data that satisfies an ISO 50001 auditor.
The Four Significant Energy Uses in a Food Plant
ISO 50001 calls them Significant Energy Uses — the handful of systems that together account for the large majority of consumption. In food and beverage, four dominate, and knowing their rough share is the first step to targeting the biggest recoverable waste first.
Shares vary by plant type — a frozen-food facility is refrigeration-heavy, a dairy is steam-heavy — which is exactly why an EnMS measures your actual split before targeting anything.
Refrigeration: The Biggest Load, and the Biggest Prize
Because refrigeration is the largest single consumer, small percentage gains here move the whole bill. The waste is rarely a failure — it is a compressor working harder than it needs to, hidden behind a temperature that still looks fine.
- Dirty condensers forcing compressors 15–25% harder
- Low refrigerant charge and degraded expansion valves
- Fixed-speed compressors running at partial load
- Time-based defrost cycles that run regardless of need
- Trends compressor kW draw to flag rising load early
- Floating head pressure — each 1°C drop cuts power ~1.5–3%
- Variable-speed drives cut compressor kWh 8–15%
- Demand-based defrost tied to actual ice build-up
Steam & Process Heat: Losses That Compound Every Hour
Steam-trap failures, insulation degradation, and condensate-return losses together can account for a large share of plant energy. A single stuck-open trap dumps live steam into the condensate return continuously, and a plant with 200 traps typically runs a 15–25% failure rate — dozens of traps wasting fuel unnoticed.
- Failed-open steam traps at $5,000–$15,000 each per year
- Bare or damaged insulation on hot and cold piping
- Flash steam and condensate never recovered
- Boiler combustion drifting off its efficiency curve
- Continuous trap-performance and recovery-rate monitoring
- Flags the 30–50 failed traps a big plant hides
- Tracks condensate return to recover flash steam
- Trends burner efficiency to hold the designed curve
Find the waste in your two biggest systems first
Steam and refrigeration together are 60–70% of a typical food plant's energy. iFactory maps both continuously and surfaces the recoverable losses within the first billing cycle.
Compressed Air: The Most Expensive Utility, Leaking Everywhere
Compressed air costs 7 to 8 times more than the electricity used to make it, and the average system loses 20 to 30 percent of its output to leaks. A single quarter-inch leak at 100 PSI costs about $2,500 a year, and most plants have dozens — collectively wasting more energy than entire production lines consume.
- 20–30% of output lost through undetected leaks
- System pressure set higher than any tool requires
- Compressors running loaded during idle shift states
- Artificial demand from unregulated open blows
- Pressure and flow tracking that pinpoints waste zones
- Idle-state monitoring that exposes passive leaks
- Specific energy (kW per m³/min) as the core KPI
- Leak backlog ranked by cost for planned repair
Lighting: The Fastest Low-Capital Win
Lighting runs continuously across production floors, warehouses, and cold stores, and many plants still operate legacy metal-halide or fluorescent fixtures. It rarely tops the consumption chart, but it offers one of the shortest paybacks in the plant with minimal disruption to production.
- Metal-halide and T8 fluorescent fixtures still in service
- Full illumination in zones running a single shift
- Warehouses and cold stores lit when unoccupied
- No daylight harvesting near skylights or windows
- LED retrofit cutting lighting energy 50–75%
- Occupancy sensors adding another 15–30% on top
- Zone scheduling matched to actual shift patterns
- Longer fixture life lowering maintenance load too
How an EnMS Turns One-Time Savings Into Permanent Ones
Finding waste once is an audit; keeping it gone is a management system. ISO 50001 structures that with a Plan-Do-Check-Act loop, and the monitoring infrastructure that satisfies the auditor is the same infrastructure that finds the savings in the first place.
Rank Every Opportunity Before Spending a Dollar
Not every energy loss has the same return. The discipline that separates a real program from a wish list is ranking each opportunity by savings, cost, and payback — then doing the no-cost and low-cost measures before any capital project.
| Measure | Capital Level | Typical Impact |
|---|---|---|
| Compressed air leak survey & repair | No / low cost | Recovers a large share of 20–30% leakage, fastest payback |
| Steam trap testing & replacement | Low cost | Eliminates $5K–$15K per failed-open trap in fuel |
| Lighting controls & scheduling | Low cost | 15–30% on top of any fixture savings |
| Refrigeration head-pressure & defrost tuning | Low cost | Single-digit percent off the largest load |
| LED lighting retrofit | Capital | Cuts lighting energy 50–75%, longer fixture life |
| Variable-speed drives on compressors | Capital | 8–15% off compressor kWh on variable loads |
Turn your energy bill into a ranked action list
iFactory connects to your meters and assets, measures your real system split, and hands operations a payback-ranked backlog — savings visible within the first billing cycle.
Common Questions About Food Plant Energy Management
Put All Four Energy Systems Under One EnMS
Refrigeration, steam, compressed air, and lighting — the four systems that drive your bill, managed continuously against an ISO 50001 baseline. iFactory finds the waste, ranks the fixes, and holds the savings in place.