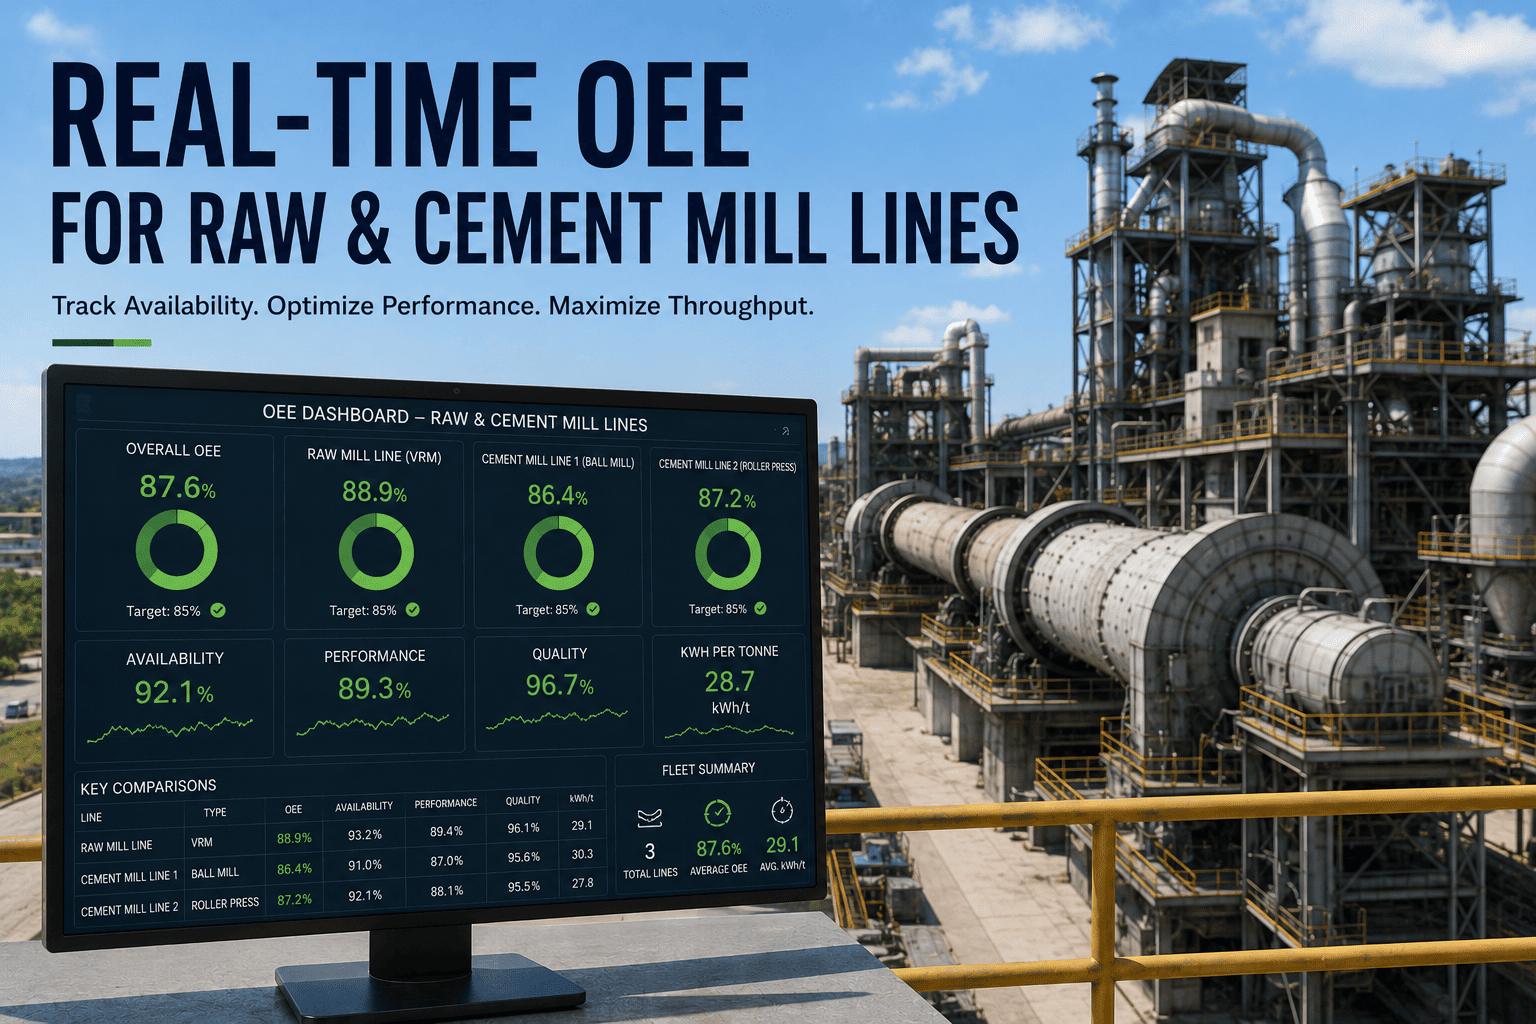
A cement plant can run a flawless kiln for 90 hours and still lose the sale in the last four. Dispatch — bag loading, palletizing, bulk truck loading — is the final link in a production cycle that took 72 to 96 hours to complete, and it's where the whole operation either makes its numbers or quietly bleeds them away. A roto packer running at 96 percent shot rate instead of its 99.7 percent design stops the line dozens of times a shift for misfeeds. A filling head that has drifted 200 grams overweight gives away a full bag of cement on every 24th fill. An unplanned packer stoppage during peak dispatch can cost more in lost throughput than that line's entire monthly maintenance budget. Most plants can't see any of it in time, because packing OEE gets calculated in a spreadsheet after the shift is already over. Real-time OEE analytics changes that — tracking packer availability, bags-per-minute performance, and reject rate live, so an end-of-line loss becomes an alert instead of a month-end surprise. If your dispatch numbers slip and no one can say exactly where, book a demo to see the whole silo-to-truck chain on one screen.
OEE & DISPATCH · OEE ANALYTICS SUITE
The Kiln Made the Cement. The Packing Line Decides If You Ship It On Time.
Packer availability, bags-per-minute, and reject rate are the three levers that set your dispatch performance — and on most plants they're tracked across a lab weight log, a loader's shift book, and a maintenance inbox that never talk to each other. iFactory's OEE Analytics Suite puts all three on one live score, per line and per shift, so the loss is an alert instead of a month-end mystery.
15–25%
Dispatch capacity lost to unplanned packer downtime on peak days
40 min
Typical dispatch delay per unplanned packer stoppage
$180K–$420K
Annual avoidable dispatch cost at a mid-size plant
71%
Reduction in packing-line stops documented with structured tracking
Why Packing OEE Is the Number That Hides in Plain Sight
Every cement plant obsesses over kiln availability, and rightly so — it's the most expensive asset on site. But the packing plant is the final link in the production chain and the most overlooked from a performance standpoint, and it's where dispatch throughput is actually decided. When a packing line underperforms, it doesn't announce itself with a red shell or an alarm. It leaks capacity quietly, one 90-second spout jam at a time, one overweight bag at a time, until the daily dispatch tonnage falls short and nobody can point to a single event that caused it. That's the nature of end-of-line loss: individually trivial, collectively devastating.
The economics make the neglect especially costly. Dispatch operations represent the last four to six hours of a production cycle that took 72 to 96 hours to complete, which means every bag that doesn't ship on time wastes days of upstream kiln, mill, and grinding effort that's already been paid for. A mid-size plant running dispatch inefficiently loses between $180,000 and $420,000 a year in avoidable costs — truck detention charges, product giveaway from uncalibrated weighbridges, rehandling labor from loading errors, and throughput constraints that quietly cap effective plant capacity below nameplate. None of those line items show up as a dramatic failure. They accumulate in the gaps between systems that don't talk to each other.
AVAILABILITY LOSS
Unplanned Packer Stoppages
A spout seal fails, an impeller throttles flow, a bag counter miscalibrates — and the line stops. Documented plants saw these stoppages hitting six to eight times per shift, averaging 40 minutes each, with no PM trigger tied to bag count or mechanical cycles to catch the wear before it broke. Worse, a worn impeller or stuck flap valve upstream throttles every roto packer downstream simultaneously, so one unnoticed component takes the whole line's output with it.
PERFORMANCE LOSS
Micro-Stops and Slow Shot Rate
A bag applicator running at 96 percent instead of its 99.7 percent design rate stops for a misfeed roughly a hundred times a shift — each one under the radar of a downtime log, none logged, all of them dragging bags-per-minute below what the machine is capable of.
QUALITY LOSS
Reject Rate and Weight Drift
A filling head drifting 30 grams a day trends steadily toward overweight rejects and metrology non-compliance. Every rejected bag is cement produced, filled, and then thrown back — a triple loss of material, throughput, and the spout time it took to make it. And a spout drifted 200 grams overweight quietly gives away a full bag's worth of cement on every 24th fill, a loss that never even registers as a reject.
DISPATCH LOSS
Truck Turnaround Cascade
When the packer stumbles, the cascade runs downstream: trucks queue at the gate, loading bays sit under-utilized, and turnaround time balloons 40 to 80 percent above the mechanical minimum — turning packing inefficiency directly into detention charges and late deliveries.
The published cost of a packing failure is never just the repair. On a 5,000 TPD plant running three lines, a single packer failure during peak dispatch hours costs more in lost throughput than the entire month's PM budget for that line — and the loss is unrecoverable, because the trucks that couldn't load today don't come back tomorrow.
OEE, Read the Way a Packing Line Actually Fails
OEE is one number — Availability times Performance times Quality — but on a packing line each factor fails in its own distinctive way, and the three multiply, so small losses compound fast. Three factors sitting at 90 percent each don't average to 90; they land at 72.9 percent OEE. Understanding which factor is dragging the score is the difference between fixing the real constraint and guessing. iFactory tracks all three live, per packer, so the weakest link is always visible.
A
Availability
Run Time ÷ Planned Time
Every stoppage above the micro-stop threshold — a spout failure, a valve replacement, a jammed bag magazine. This is where a single mechanical failure with no cycle-based PM trigger quietly erases hours of dispatch window.
×
P
Performance
Actual Rate ÷ Design Rate
The gap between current bags-per-minute and the packer's rated speed. Slow shot rate and the hundreds of sub-minute micro-stops that never make a downtime log live here — the single largest hidden loss on most packing lines.
×
Q
Quality
Good Bags ÷ Total Bags
First-pass good bags against total filled. Overweight rejects from fill-weight drift, torn bags, and startup rejects all pull Quality down — and each reject wastes the material and the spout time that produced it.
The trap most plants fall into: they log only stoppages over five minutes and treat the small stuff as normal operation. But a packing line's biggest loss category is almost always Performance — the micro-stops and slow cycles that never trip a downtime log. Measure only Availability and you'll optimize the wrong factor entirely.
What Real-Time Looks Like on the Dispatch Floor
The difference between real-time and end-of-shift OEE isn't precision — the spreadsheet math is correct. It's timing. A loss you see at month-end is a history lesson; a loss you see mid-shift is a work order. Real-time packing analytics puts every reading against a named station, so the dispatch supervisor sees the entire chain from silo to truck on one screen instead of chasing it across three disconnected systems. The status view below is what a live packing board actually shows mid-shift — every reading tied to a specific component, every threshold breach producing a work order automatically.
Packing Line A — 12-Spout Roto Packer
LIVE
4,420bags/hr vs 4,800 design
97.4%shot rate
1.8%reject rate
Fill weight drifting +30 g/day — load cell recalibration auto-queued before next shift, spout cone replacement flagged for next planned stop.
Bag Applicator — Magazine Feed
WATCH
97.4%shot rate vs 99.7 design
2 of 6grippers showing wear
4 mmmagazine alignment drift
Sub-design shot rate is generating micro-stops that suppress Performance — gripper pad replacement raised before the drift compounds into a full line stop.
Truck Loading & Dispatch
LIVE
Turnaroundtracked vs 30-min target
Bay useagainst 80% target
Tonnesdispatched vs daily target
Packing OEE feeds directly into dispatch KPIs, so a Performance dip on Line A shows up as a turnaround trend before it becomes a gate queue.
See Your Own Packing Lines on a Live OEE Board
Bring your packer specs, design bag rates, and last month's dispatch shortfall to the call. iFactory engineers will show how availability, bags-per-minute, and reject rate would map onto your lines — and where the recoverable throughput is hiding.
From Packer Signal to Dispatch KPI
The reason packing OEE matters isn't the score itself — it's that the score is the earliest visible signal of a dispatch problem still forming. A packing line's Performance dip today is tomorrow's truck queue, and a rising reject rate this week is next week's metrology non-compliance. Real-time analytics connects the packer-level signal to the dispatch-level outcome, so the intervention happens at the cause, not the symptom. The mapping below traces each common packer signal through the OEE factor it damages to the dispatch consequence it eventually produces if nothing intervenes.
This is why packing OEE deserves the same real-time treatment the kiln gets. The signals are cheaper to instrument, the payback is often faster, and the losses — unlike a kiln stop that at least announces itself — are the kind that stay invisible until the monthly dispatch report shows a shortfall no one can explain. Cycle-count-based PM triggers on spout wear, valve replacement, and bag-sensor calibration prevent the majority of unplanned packing stops, and structured tracking alone has documented packing-line stoppage reductions of 71 percent alongside dispatch throughput gains near 18 percent within six months.
What Changes When Packing OEE Goes Live
Moving packing OEE from a month-end spreadsheet to a live score changes who can act on it and when — turning the packing plant from a black box that either hits dispatch or doesn't into a monitored, tunable system.
01
Micro-Stops Stop Being Invisible
The hundreds of sub-minute stops that never reach a downtime log — the single biggest Performance drain on a packing line — become visible as a pattern. A gripper that misfeeds every fortieth cycle shows up as a trend, and the fix is scheduled before it compounds into a full line stop during peak dispatch. This is the loss category most plants don't even know they have, because it lives entirely below the five-minute threshold that most downtime logging starts at.
02
PM Triggers on Cycles, Not the Calendar
A spout has a wear life measured in bag count, not weeks. Real-time cycle tracking triggers a spout-cone or valve replacement at the right bag count, catching the wear before it fails mid-shift — the difference between a two-minute planned swap and a 40-minute unplanned stop during the busiest dispatch window.
03
Weight Drift Is Caught as a Trend
A filling head drifting 30 grams a day is invisible on any single bag but obvious on a trend line. Continuous fill-weight monitoring flags the drift while it's still within tolerance, so a recalibration is scheduled before it starts producing rejects — protecting both the reject rate and metrology compliance at once.
04
Dispatch Sees the Problem Before the Queue
Because packing OEE feeds dispatch KPIs on the same live board, a Performance dip on a line surfaces as a turnaround trend before it becomes a gate queue of idling trucks. The dispatch supervisor can rebalance bays or escalate a stoppage while there's still time to protect the day's tonnage target — instead of discovering the shortfall when eight to twenty trucks are already queued at the gate, each idling 45 to 75 minutes before loading even begins.
How the OEE Analytics Suite Deploys
The packing plant is one of the faster wins in a cement operation, because packing-line PM is simpler to instrument than a kiln circuit and much of the required data is cycle-based rather than sensor-heavy. The rollout below moves a plant from month-end spreadsheet OEE to an always-on dispatch board, and because it leans on data the machines already produce, the timeline is measured in weeks and the payback is often faster than the kiln-side projects that get all the attention.
1
Asset & Rate Baseline
Every packer, palletizer, conveyor, bag counter, and truck loader is registered with its design bag rate and shot-rate target, so the OEE calculation measures each line against its own real capacity rather than a generic benchmark.
2
Signal Integration
Bag counters, load cells, and existing line PLCs feed availability, bags-per-minute, and reject data into the OEE Analytics Suite, with the micro-stop threshold set once and applied consistently across every shift and line.
3
Threshold & Work-Order Wiring
Cycle-based PM triggers and OEE thresholds are configured so a breach — a spout nearing its bag-count limit, a fill-weight drift crossing tolerance — automatically raises a work order against the named component before it becomes a stop.
4
Live Dashboard Go-Live
The dispatch supervisor and reliability team get one live board showing per-line OEE, per-packer status, and the dispatch KPIs those feed — truck turnaround, bay utilization, and tonnage against target — updated throughout the shift.
Frequently Asked Questions
The questions dispatch managers and reliability engineers ask most often before putting packing OEE on a live board.
Do we need to install sensors on every packer, or can this use what we have?
Packing lines are one of the easier parts of a cement plant to instrument because much of the needed data is cycle-based — bag counts, shot rates, load-cell weights — that the machines already produce. The OEE Analytics Suite integrates bag counters, load cells, and existing line PLCs rather than requiring a fresh sensor deployment on every spout. In fact, a large share of documented packing improvement has come purely from structured tracking of data that was already available but never correlated. To scope exactly what your lines already expose,
book a demo with your packer specs on hand.
Our packing OEE looks fine in the monthly report. Why would real-time change anything?
A monthly report is correct math on stale timing — it tells you the loss happened, weeks after you could have stopped it. More importantly, most monthly reports capture only the big stoppages and miss the micro-stops and slow cycles that are usually a packing line's largest loss category. Real-time tracking surfaces the sub-minute events that never reach a downtime log, which is exactly where the recoverable throughput hides. Plants routinely find their true OEE is lower than the monthly number suggested, because the full shift is finally being measured rather than just the parts that were easy to write down. That initial drop isn't bad news — it's the first time the number reflects reality, and it's what makes the improvement plan that follows actually work.
How does packing OEE connect to our dispatch and truck turnaround numbers?
Packing OEE is the upstream cause of most dispatch outcomes, so the two are tracked together on one board rather than in separate systems. A Performance dip on a packing line reduces bags-per-minute, which slows loading, which extends truck turnaround and builds gate queues — a chain that a dispatch-only view sees only at the end. By connecting packer-level signals to dispatch KPIs like turnaround time, bay utilization, and daily tonnage, the platform lets a supervisor act on the packing cause while there's still time to protect the dispatch result, instead of reacting to a queue that's already formed. The most actionable dispatch KPIs — average truck turnaround by shift, bay utilization, tonnes against target, and packing-line OEE itself — all live on the same view, updated in real time throughout the shift.
Will this help with bag weight compliance and reject rate, not just throughput?
Yes — Quality is one of the three OEE factors tracked continuously, and fill weight is central to it. A filling head that drifts steadily overweight is invisible bag to bag but clear on a trend, so continuous fill-weight monitoring flags the drift while it's still within legal metrology tolerance and schedules a recalibration before rejects start accumulating. This protects the reject rate, prevents product giveaway from overfilling, and keeps weight compliance continuous rather than something discovered during an audit after the fact.
How quickly do plants typically see results on the packing line?
Packing is often one of the fastest payback areas in a cement plant because the PM is simpler to instrument and the fixes are frequently low-cost cycle-based adjustments rather than capital projects. Documented deployments have shown packing-line unplanned stoppages dropping by roughly 71 percent and dispatch throughput rising close to 18 percent within about six months, and some of that came from structured PM scheduling that required no new sensor infrastructure at all. Timelines vary by line count and starting condition, so contact
iFactory support to discuss what's realistic for your dispatch operation.
STOP LOSING THE LAST FOUR HOURS OF A 90-HOUR CYCLE
Put Packer Availability, Bags-Per-Minute, and Reject Rate on One Live Score.
Turn the packing plant from a black box into a monitored, tunable system — catch micro-stops, weight drift, and spout wear before they become dispatch delays, and lift on-time loading without adding a single machine. The last four hours of your production cycle deserve the same visibility as the first ninety.