A Cpk of 0.9 is not a quality problem — it is a financial problem. At 0.9, your process is generating approximately 2,700 defective parts per million. At Cpk 1.33, that number drops to 64 ppm. At 1.67, it falls below 1 ppm. The difference between those three numbers is not equipment — it is operating cadence, measurement discipline, and the analytical rigor applied to process variation in real time. For Continuous Improvement leads managing defect-reduction programs in U.S. discrete and process manufacturing, the gap between where a process is and where it needs to be is almost always traceable to three root causes: an inadequate baseline, SPC that runs on sampling instead of continuous data, and corrective actions that address symptoms rather than the process parameters driving variation. iFactory AI's 90-day Cpk uplift platform — combining live SPC, drift detection AI, recipe parameter auditing, and automated customer reporting — delivers a structured operating cadence that closes the capability gap from 0.9 to 1.67 with measurable, verifiable progress at each 30-day milestone. To understand how this cadence maps to your specific process, Book a Demo with our continuous improvement engineering team.
Cpk Uplift · Live SPC · Drift AI · Recipe Audit · Customer Reporting
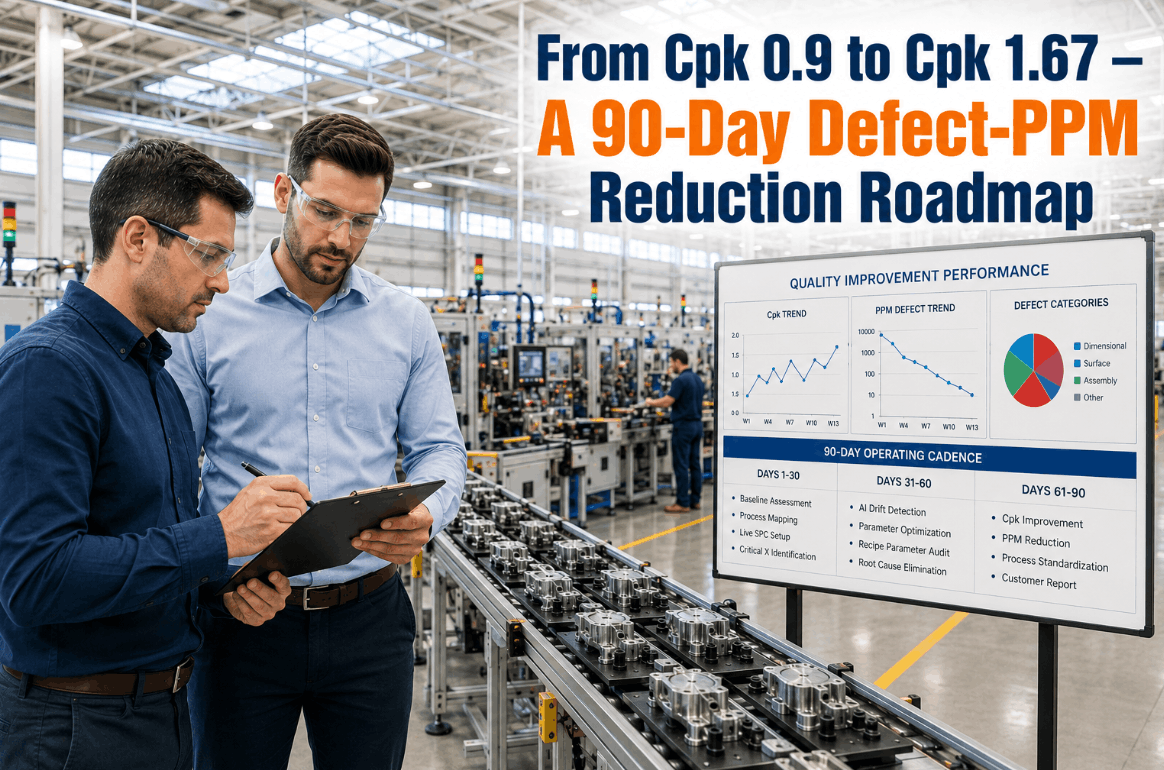
From Cpk 0.9 to Cpk 1.67 in 90 Days — A Structured Operating Cadence That Works.
iFactory delivers the baseline measurement, live SPC infrastructure, drift detection AI, and recipe parameter audit framework that converts a capability improvement goal into a 90-day execution plan with verifiable milestones.
2,700
PPM at Cpk 0.9 — the defect rate most plants consider "acceptable" until a customer audit disagrees
64
PPM at Cpk 1.33 — the minimum supplier quality threshold for most Tier 1 automotive and aerospace OEMs
0.6
PPM at Cpk 1.67 — near-zero defect rate achievable with closed-loop SPC and drift AI on critical parameters
90
Days to move from capability baseline to verified Cpk improvement using iFactory's structured uplift cadence
Why Most Cpk Improvement Programs Stall Before 60 Days
The Structural Failure Modes of Conventional Capability Programs
The majority of Cpk improvement initiatives launched by CI teams in U.S. manufacturing facilities follow a recognizable pattern: a capability study is commissioned, the results confirm what everyone already suspected, a corrective action plan is written, and within six weeks the program has lost momentum to competing priorities. The reason is not a lack of intent — it is a structural problem in how most improvement programs are designed. They are built around events (studies, reviews, audits) rather than continuous operating cadences. They rely on lagging data from QMS exports or monthly SPC reports rather than live process signals. And they have no mechanism for detecting whether corrective actions are actually shifting process variation — so the team learns at the next monthly review that last month's action didn't work, and the cycle repeats.
iFactory's approach to Cpk uplift is architecturally different. Rather than treating capability improvement as a project with a kickoff and a deliverable, the platform establishes a continuous operating cadence: a live process signal that updates Cpk in real time, a drift detection AI that catches process shifts within minutes rather than weeks, and a recipe parameter audit function that systematically identifies which process inputs are responsible for the variation being measured. Book a Demo to see how the cadence maps to your critical-to-quality parameters.
The Cpk–PPM Relationship: Understanding What Each Improvement Step Is Worth
Translating Capability Numbers Into Operational and Financial Terms
Before designing an improvement roadmap, CI leads need a precise understanding of what each incremental Cpk improvement is worth — both in defect rate reduction and in financial terms. The table below maps the Cpk-to-PPM relationship and provides annualized financial context for a mid-volume discrete manufacturer producing 500,000 units per year at an average scrap and rework cost of $18 per defect event.
| Cpk Value |
Sigma Level |
Defect PPM |
Annual Defect Events (500K units) |
Annual Defect Cost ($18/event) |
| 0.90 |
2.7σ |
2,700 ppm |
1,350 events |
$24,300 |
| 1.00 |
3.0σ |
1,350 ppm |
675 events |
$12,150 |
| 1.10 |
3.3σ |
480 ppm |
240 events |
$4,320 |
| 1.33 |
4.0σ |
64 ppm |
32 events |
$576 |
| 1.50 |
4.5σ |
6.8 ppm |
3.4 events |
$61 |
| 1.67 |
5.0σ |
0.6 ppm |
<1 event |
<$11 |
The financial case for Cpk improvement is rarely presented at this resolution in CI planning sessions — and that absence is one reason improvement programs are chronically underfunded. The move from Cpk 0.9 to 1.33 alone eliminates 97.6% of defect cost on the affected characteristic. At any realistic production volume and defect cost, the investment in a live SPC and drift detection platform pays back within the first quarter of the improvement program. Book a Demo to model this calculation against your actual production economics.
The 90-Day Cpk Uplift Cadence: Phases, Milestones, and Operating Actions
A Structured Execution Framework, Not a Project Plan
Days 1–14 · Phase 1
Capability Baseline and Measurement System Validation
Before any improvement action is taken, iFactory establishes the actual Cpk baseline for each critical-to-quality (CTQ) characteristic — not from QMS exports or historical sample data, but from 100% of production data collected via direct sensor and gauge integration. Gauge R&R analysis is run simultaneously to confirm that measurement system variation is not inflating the observed process variation. In most plants, 15–25% of apparent process variation is attributable to measurement system issues that have never been formally quantified. Eliminating measurement error before taking corrective action prevents the common CI failure mode of adjusting process parameters to compensate for measurement noise rather than real variation.
Days 14–30 · Phase 2
Live SPC Deployment on Critical Parameters
With the baseline confirmed, iFactory deploys live SPC on the 3–6 process parameters most highly correlated with the CTQ characteristics showing the lowest Cpk. Control charts update on every unit — not on sampling intervals — and Western Electric rule violations generate real-time alerts to the responsible CI engineer and process operator. The immediate effect of switching from periodic to continuous SPC is a significant reduction in the lag between a process shift occurring and a corrective action being initiated. In most deployments, this phase alone reduces the frequency of out-of-control events within the first two weeks, as the increased visibility changes operator behavior around process setpoint maintenance.
Days 30–60 · Phase 3
Drift Detection AI and Recipe Parameter Audit
iFactory's drift detection AI begins building correlation models between upstream recipe parameters — tool offsets, feed rates, temperature setpoints, material lot variables — and the Cpk performance measured on each CTQ. This is the analytical layer that most CI programs are missing: the ability to identify which specific process inputs are driving the variation being observed in the output characteristic, rather than relying on engineering judgment and one-factor-at-a-time experiments. The recipe parameter audit runs continuously in the background, surfacing the parameter combinations that consistently produce lower Cpk and those that consistently produce higher Cpk — providing the CI team with a data-confirmed optimization target for parameter settings rather than a hypothesis.
Book a Demo to see the drift AI in action on a representative CTQ characteristic.
Days 60–90 · Phase 4
Parameter Optimization, Verification, and Customer Reporting
Using the recipe parameter audit findings from Phase 3, process parameter adjustments are implemented and their effect on Cpk is verified in real time through the live SPC layer — not estimated from a sample study run weeks after the change. Cpk improvement is confirmed characteristic by characteristic, with control charts showing the before-and-after distribution shift. iFactory's automated customer reporting module generates the capability summary report — Cpk values by CTQ, control charts, measurement system data, and corrective action documentation — in the format required by your customer's supplier quality portal, eliminating the manual report-building that typically consumes 8–12 hours of CI engineering time per customer per quarter.
The 5 Process Variables Most Responsible for Low Cpk in U.S. Manufacturing
What the Recipe Parameter Audit Typically Finds
01
Setpoint Drift Without Detection
Process setpoints that were correct at initial validation drift over time due to tool wear, thermal changes, and equipment aging — but without continuous SPC, the drift goes undetected until a quality event occurs. iFactory's drift AI detects gradual setpoint deviation through trend analysis on process parameter data, alerting the CI team when a parameter is trending toward its control limit rather than after it has crossed it.
02
Material Lot Variation Absorbed as Process Variation
Incoming material variation — hardness, chemistry, dimensional tolerance — is frequently absorbed into the process Cpk measurement without being separated from true process variation. iFactory's sensor fusion layer stratifies the Cpk calculation by material lot, identifying whether low capability is driven by process inconsistency or incoming material variation — two root causes requiring fundamentally different corrective actions.
03
Operator-to-Operator Setup Inconsistency
Setup variation between shifts and operators is one of the most consistent sources of within-characteristic Cpk spread in job shop and mixed-model manufacturing environments. iFactory tracks Cpk by operator and shift, identifying setup-driven variation that is invisible in aggregate capability data — and providing the CI team with the specific setup parameters where operator discipline is most critical to maintaining capability.
04
Tooling and Fixture Wear Not Correlated to Quality Data
Tool wear and fixture degradation are well-understood failure modes — but in most plants, tooling replacement intervals are calendar-based rather than capability-based. iFactory correlates Cpk trends with tool life data, establishing the actual relationship between tool age or usage and capability performance — allowing tool change intervals to be set at the point where capability starts to decline rather than at an arbitrary interval that may be too early or too late.
05
Temperature and Environmental Variation Unaccounted in Process Models
Ambient temperature variation, coolant temperature drift, and thermal cycling in the equipment affect process output in ways that are rarely incorporated into existing process control models. iFactory's sensor fusion capability ingests environmental sensor data alongside process parameters, identifying thermal correlation patterns that explain Cpk variation that otherwise appears random — and enabling temperature-compensated control limits that reflect the actual process envelope rather than assuming constant environmental conditions.
iFactory Cpk Uplift Architecture: How the Four Modules Operate Together
A Closed-Loop System, Not Four Separate Tools
Module 1
Live SPC Engine
Continuous Cpk calculation on 100% of production data from sensors and gauges. Control charts update on every unit with real-time Western Electric rule detection. Cpk tracked by characteristic, by part number, by operator, and by shift — simultaneously.
Module 2
Drift Detection AI
Trend-based AI that detects gradual parameter drift before it produces a control chart violation. Alerts issued when process parameters show directional movement toward control limits — enabling preventive correction rather than reactive response.
Module 3
Recipe Parameter Audit
Automated multi-variate correlation engine that maps upstream recipe parameters to CTQ Cpk outcomes. Identifies the specific parameter combinations responsible for low capability — providing data-confirmed optimization targets rather than engineering hypotheses.
Module 4
Automated Customer Reporting
Auto-generated capability reports in customer-specified formats — Cpk by CTQ, control charts, Gauge R&R data, CAPA documentation. Eliminates 8–12 hours of manual report preparation per customer per quarter and ensures report data matches the live SPC records exactly.
"We had been running a Cpk improvement program on our critical bore diameter for two quarters with minimal progress. The problem was that we were working from monthly SPC reports — by the time we identified a pattern and implemented a corrective action, three more shifts had run under the same conditions. When we deployed iFactory's live SPC and drift AI on that characteristic, the first 30 days produced more actionable findings than the prior six months. The recipe parameter audit identified that our Cpk performance was strongly correlated with coolant temperature at setup — a variable no one had been tracking in the quality data. We adjusted our coolant conditioning procedure and Cpk moved from 1.04 to 1.48 within four weeks. The customer report that used to take our quality engineer a full day to compile is now generated automatically."
Continuous Improvement Lead
Precision Machining Facility, Ohio — 220,000 units/year
Live SPC · Drift AI · Recipe Audit · Cpk Verification
Your Cpk Improvement Program Needs Continuous Data, Not Monthly Reports.
iFactory's 90-day Cpk uplift platform gives CI teams the live process signal, drift detection AI, and recipe parameter audit capability needed to move from 2,700 ppm to sub-1 ppm — with verifiable milestones and automated customer reporting built in.
Conclusion: Capability Improvement Is a Cadence, Not a Project
The CI teams that consistently achieve and sustain Cpk targets above 1.67 are not running better projects — they are running a better operating cadence. They have live Cpk data in front of them every day, not every month. They know which process parameters are drifting before those parameters produce a defect. They can tell a customer exactly what their capability numbers are on any characteristic, for any production run, without a three-day report preparation cycle. iFactory's 90-day Cpk uplift cadence is designed to establish exactly this operating structure: a continuous intelligence layer that makes capability improvement self-sustaining rather than dependent on periodic improvement initiatives that compete with production priorities for attention and resources. The 90-day framework gets you to Cpk 1.67. The continuous SPC and drift detection infrastructure keeps you there. Book a Demo with iFactory's CI engineering team to map the 90-day cadence to your highest-priority CTQ characteristics.
Frequently Asked Questions
What is the difference between Cp and Cpk, and which one matters more for a PPM reduction program?
Cp measures process spread relative to tolerance width without accounting for centering; Cpk measures the same spread but adjusted for how far the process mean is from the nearest specification limit. For PPM reduction, Cpk is the relevant metric because a well-centered process (high Cp) that is off-target still generates disproportionate defects on the side closest to the violated limit.
Can iFactory integrate with our existing SPC software or QMS, or does it replace them?
iFactory integrates with existing SPC platforms, QMS systems, and process historians through standard API connections, functioning as the real-time intelligence and drift detection layer rather than replacing established quality record-keeping infrastructure. Most integrations are operational within one to two weeks without process disruption.
How many CTQ characteristics can iFactory monitor simultaneously under the 90-day program?
iFactory scales to monitor the full CTQ characteristic set for a given part family simultaneously, with no practical limit on the number of parallel SPC streams. Most 90-day programs prioritize the 3–8 characteristics with the lowest baseline Cpk to maximize the measurable improvement within the program timeframe.
What level of process data infrastructure is required before the 90-day cadence can begin?
iFactory requires access to process sensor or gauge data — either via OPC-UA, MQTT, or a Level 2 historian — and quality measurement records from the existing QMS or CMM system. A data readiness assessment determines the exact analytics scope achievable before any commitment is made.
How does iFactory's automated customer reporting handle different customer-specific format requirements?
iFactory's reporting module maintains configurable templates for each customer's required format — AIAG PPAP-aligned summaries, IATF 16949 supplier reports, or customer-specific portals — and auto-populates them from the live SPC data record, ensuring the reported Cpk values are always traceable to actual production data rather than manually compiled estimates.
RECOVER YOUR CAPABILITY MARGINS
Get a 90-Day Cpk Uplift Plan Built Around Your Highest-Priority CTQ Characteristics
Our CI engineering team will baseline your current Cpk by characteristic, identify the top three process parameters driving variation, and map a 90-day operating cadence that delivers verified improvement from your current capability level to Cpk 1.67 — with automated customer reporting built in from day one.