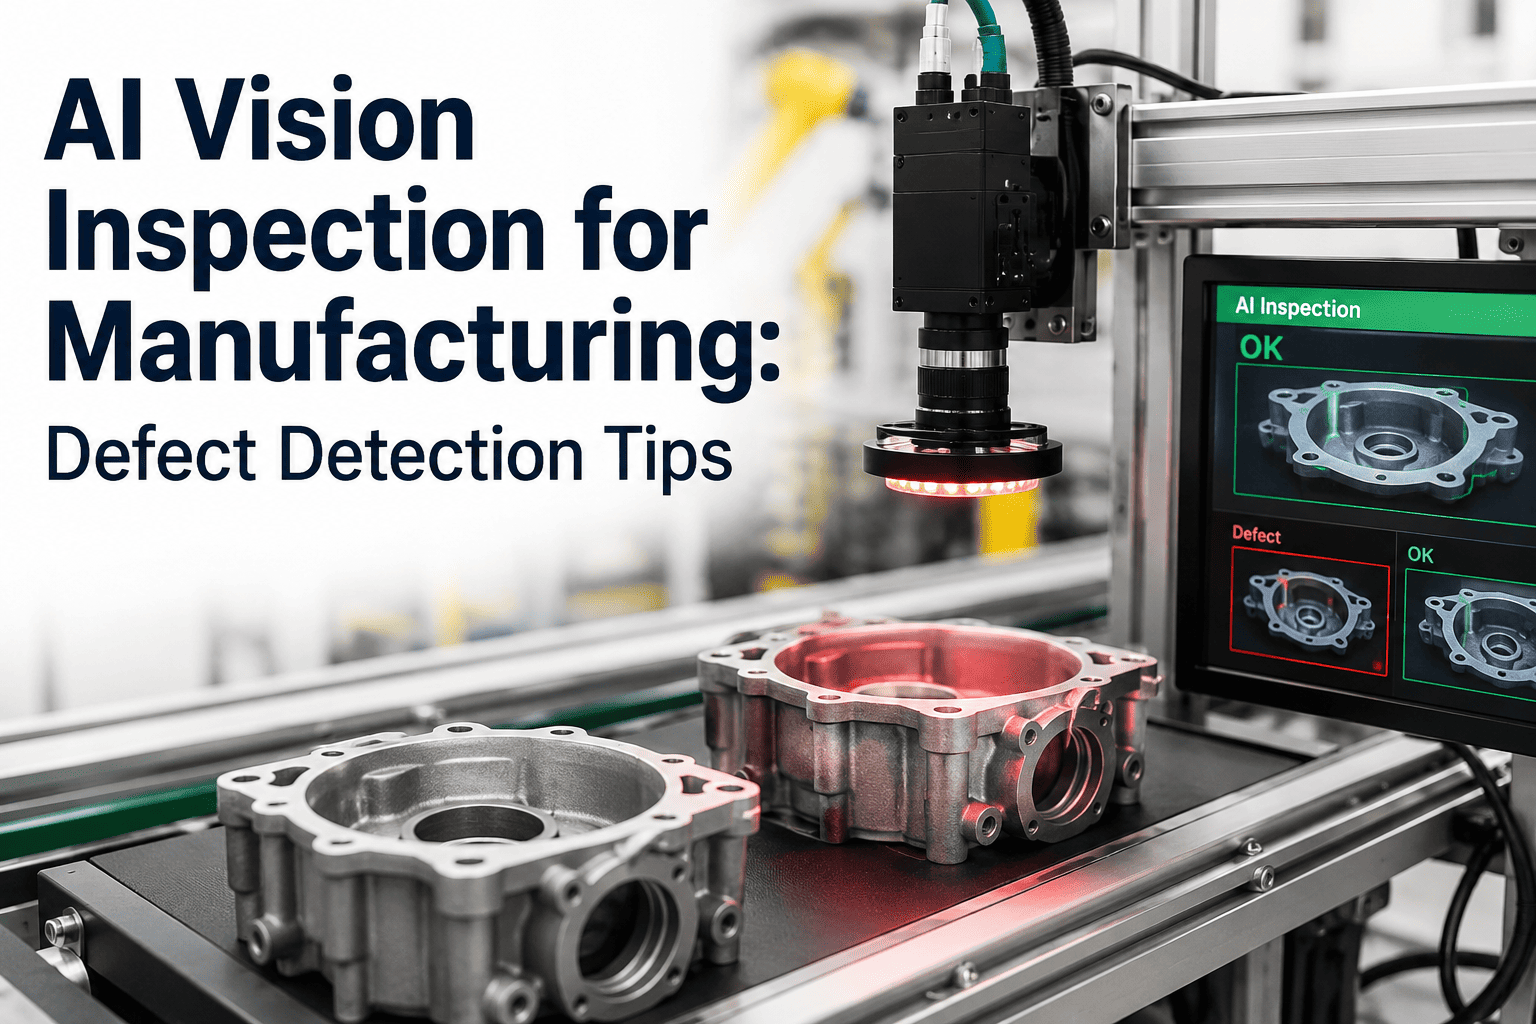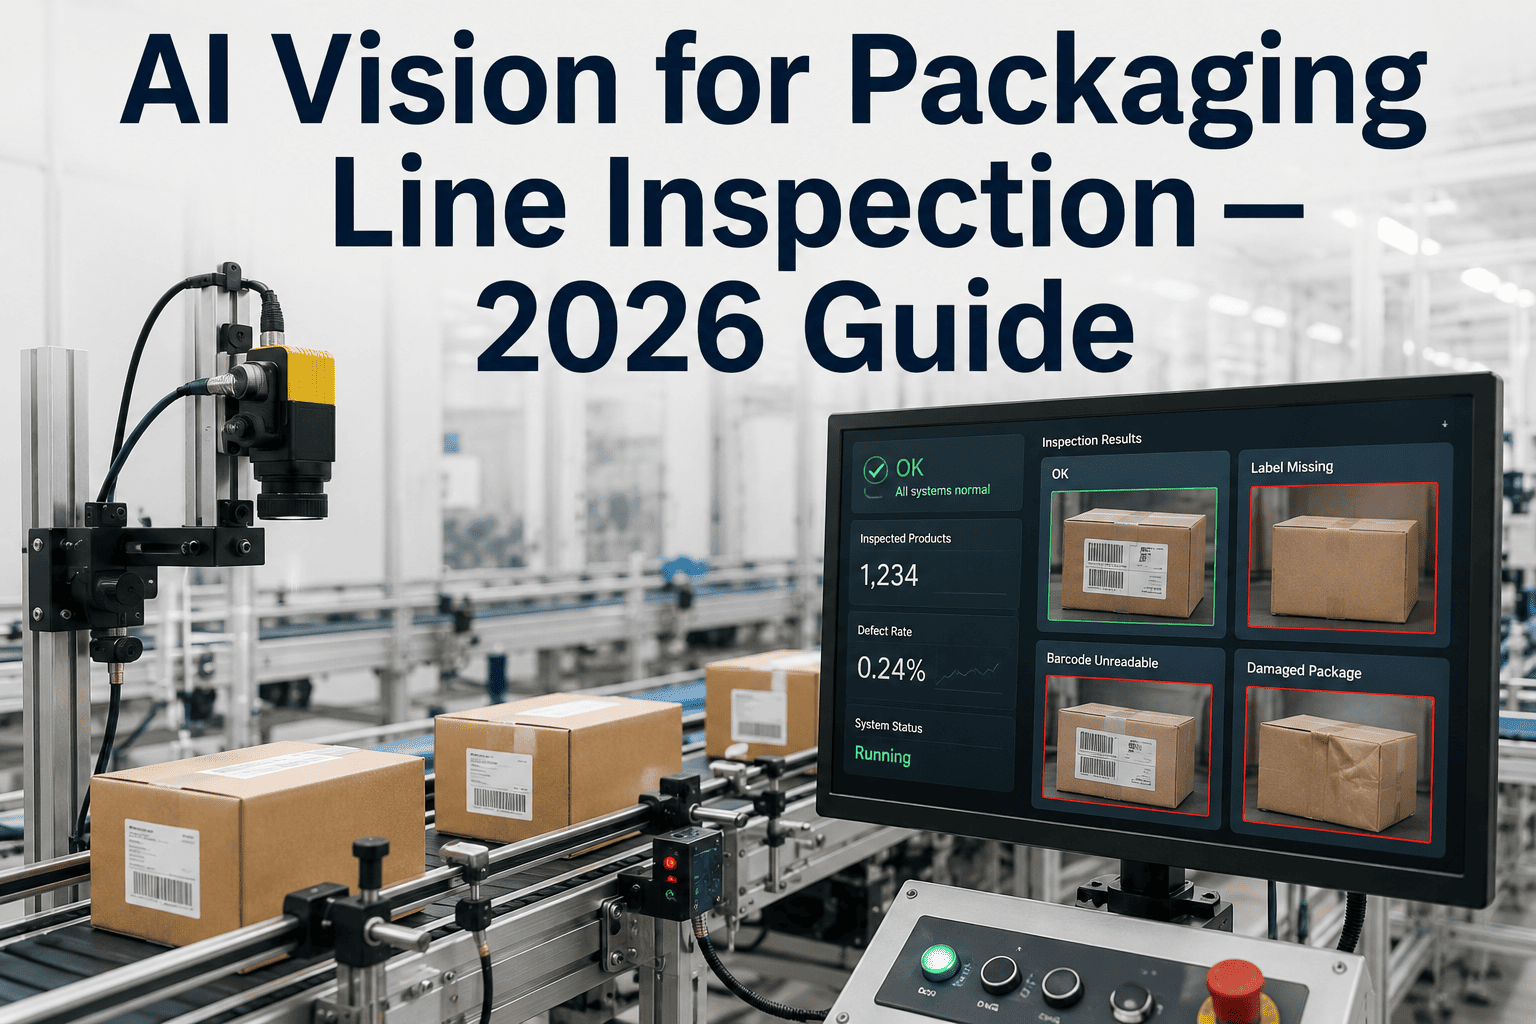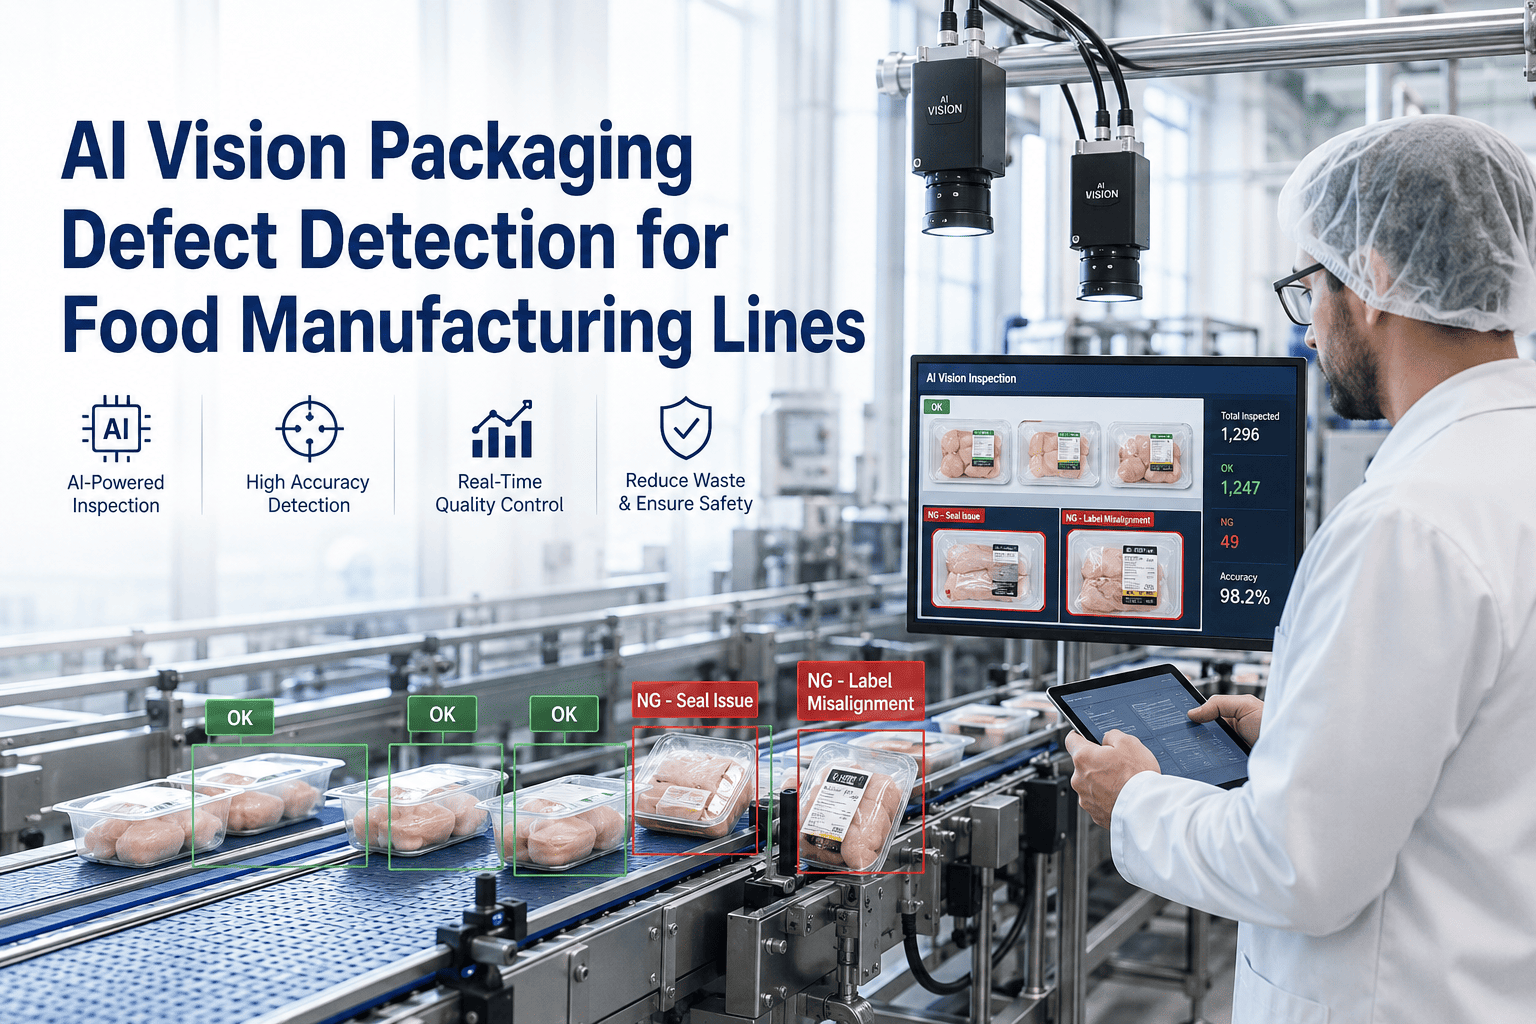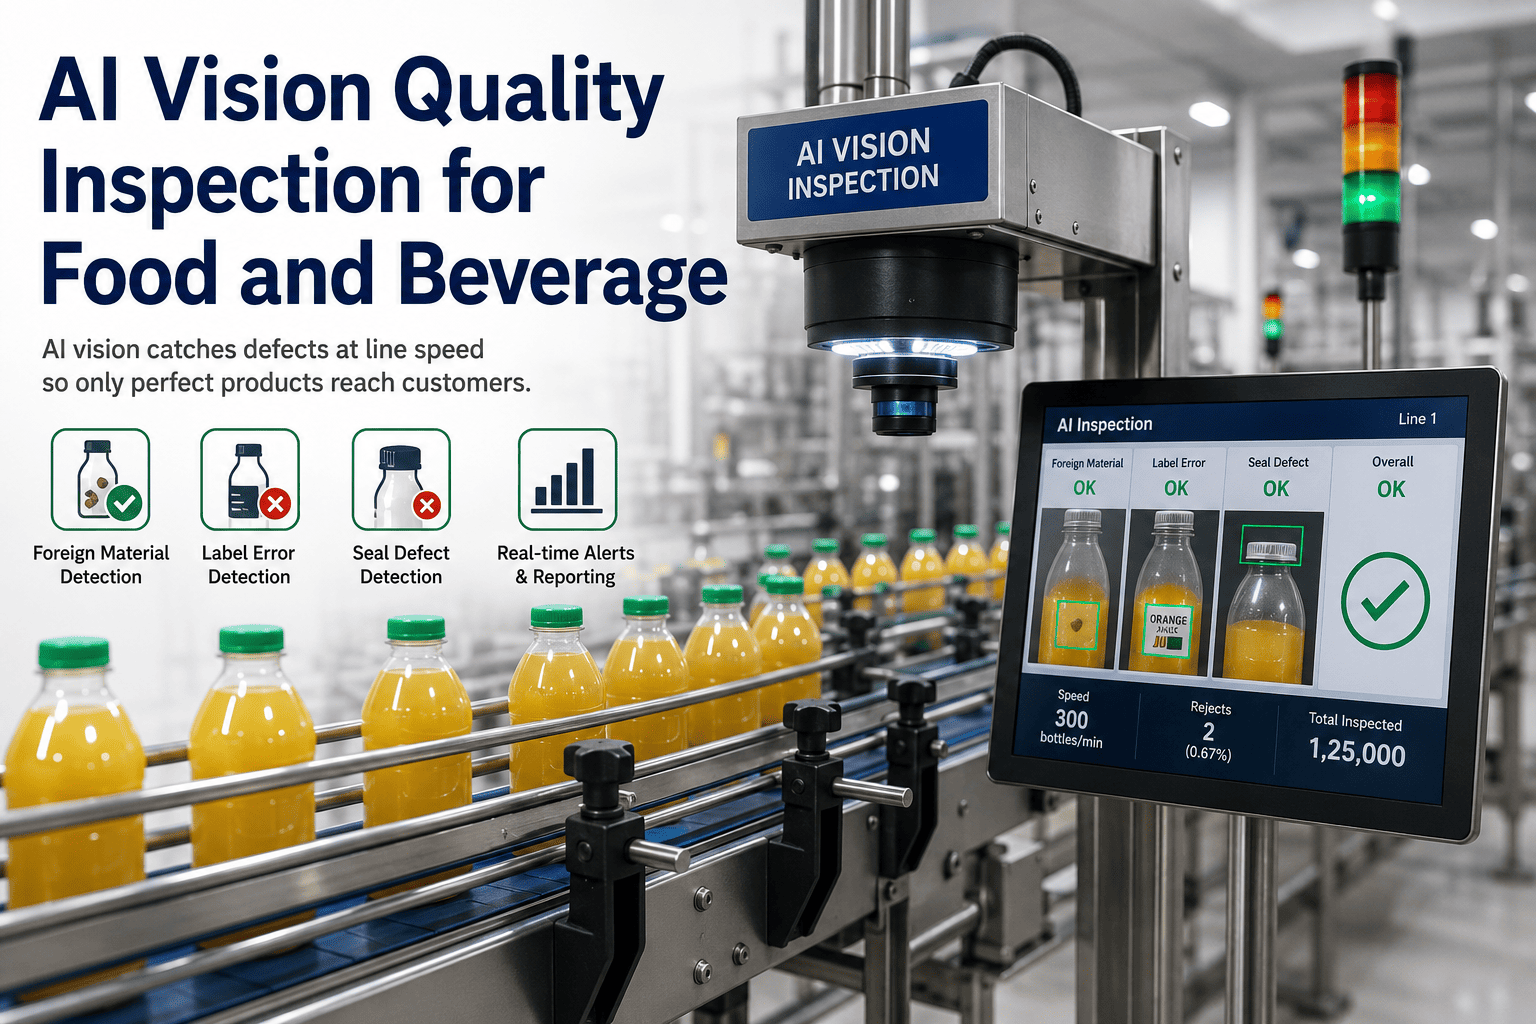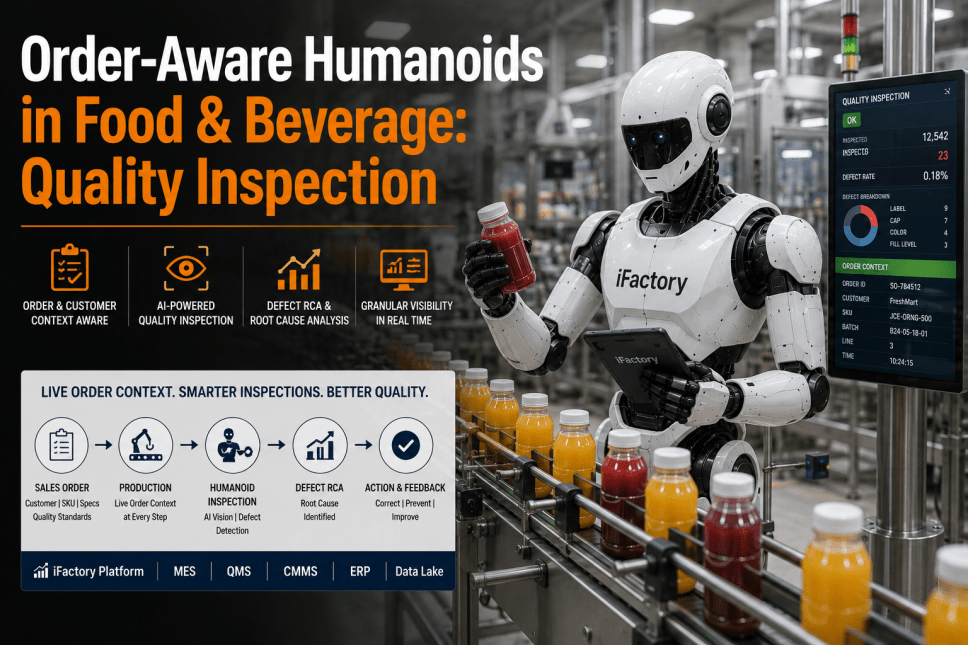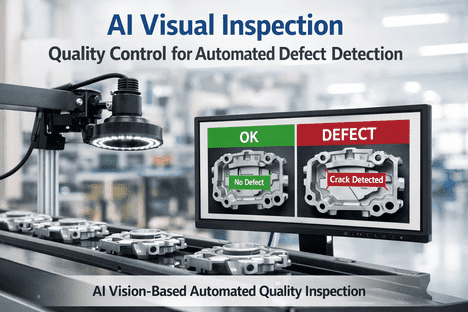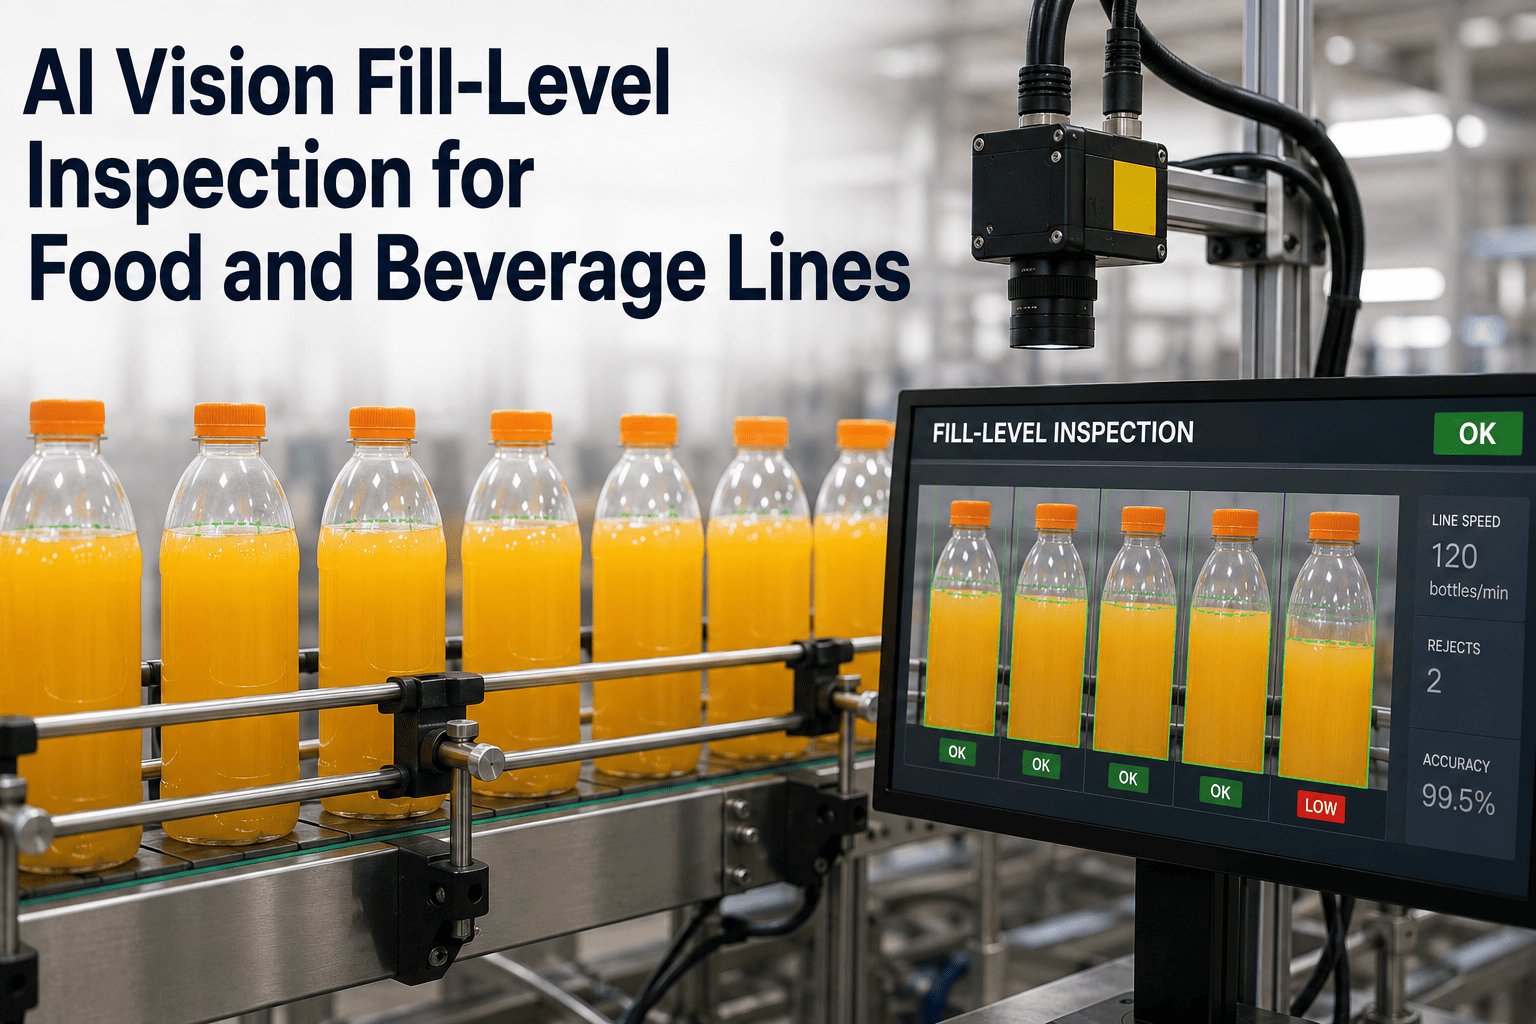
On a 600-bottle-per-minute water line, a 3 mm underfill on every container means roughly 14,000 litres of giveaway product per shift — and a single cocked cap that reaches a retailer can trigger a category-wide recall. iFactory's AI vision system inspects every unit at line speed, reading fill height, cap seating, label skew and code legibility through a single GPU-backed inspection station, then signalling the reject gate before the next container arrives.
Catch every underfill, cocked cap and skewed label — at 300+ units per minute
On-prem NVIDIA GPU inference runs inside your plant network, inspecting each container against spec and rejecting out-of-spec units through your existing reject gate. No cloud round-trip, no frame drops, no recall exposure.
Fill and closure defects that matter
Not every defect carries the same cost. Underfill erodes margin silently; overfill gives product away; a missing cap is a contamination event. The matrix below maps each defect type to its detection signal and its downstream cost class.
Want this matrix built for your specific container and SKU set? Send parts or images to our support team for a feasibility read.
Why manual and photo-eye checks miss them
A photo-eye beam triggers on presence, not on fill level. A human inspector sampling one in fifty bottles catches a steady-state drift only after hundreds of out-of-spec units have already passed. The comparison below shows why line-speed vision is not an upgrade — it is a different category of inspection.
Photo-eye + manual sampling
- Beam detects cap presence, not seating angle — cocked caps pass
- No fill-level measurement; only gross absence of liquid
- Manual sample rate: 1 unit per 50, 2% coverage
- Drift detected after 200+ defective units shipped
- No image record; disposition is verbal or paper
Per-unit vision + auto-reject
- Backlit frame measures meniscus height to ±0.5 mm per unit
- Dome-lit frame reads cap seating angle and thread engagement
- 100% coverage — every container inspected, every shift
- Drift flagged in real time; reject gate fires within one container pitch
- Image, timestamp, defect class and disposition written to QMS
Imaging setup for fill and caps
Fill inspection and closure inspection demand opposite lighting geometries. Fill height needs a collimated backlight so the meniscus casts a sharp edge; cap seating needs a diffuse dome so the thread silhouette and tilt are visible without specular blowout. The diagram below shows the two-station layout used on a typical line.
| Defect target | Lighting geometry | Optics | Typical tolerance |
|---|---|---|---|
| Fill height | Collimated backlight | 5 MP global shutter, 12 mm lens | ±0.5 mm |
| Cap presence | Diffuse dome | 5 MP global shutter, 16 mm lens | Binary present/absent |
| Cap seating (cocked) | Diffuse dome + polariser | 5 MP, 16 mm, polarising filter | Tilt threshold 2° |
| Label skew | Front dome, 45° ring | 8 MP, 8 mm lens | ±1.5 mm edge offset |
| Code legibility (OCR) | Coaxial spot, 850 nm | 2 MP monochrome, 25 mm macro | Confidence > 0.92 |
AI model and detection benchmarks
The model runs on a rack-mounted NVIDIA GPU inside your plant network — no frames leave the floor. Detection performance is benchmarked per defect class on a held-out validation set of 40,000 labelled containers across five SKUs. The bars below show precision and recall against the production threshold.
Automated reject and records
When the model classifies a container as out-of-spec, a reject signal is sent to the PLC within one container pitch — typically 80 to 120 milliseconds at 600 bpm. Every rejected unit is logged with the original image, defect class, confidence score and final disposition, written directly to your QMS or MES.
Root cause from line data
A spike in cocked-cap rejects at 14:00 every Tuesday is not random — it correlates with a filler-head maintenance window. Because every defect is timestamped and tagged to line position, the system surfaces shift-level and head-level patterns that manual sampling cannot see. The heatmap below shows a real pattern from a deployed carbonated-soft-drink line.
Root cause surfaced: Filler head H3 shows a 3.2% cocked-cap rate at 14h — traced to a capping-head torque drift after the midday changeover. The pattern repeats every Tuesday and Thursday. Maintenance was scheduled; the spike disappeared the following week.
Pilot scoping
A pilot runs on one line, one SKU family, for four to six weeks. The goal is to prove catch rate and false-reject rate against your own containers before scaling to the full plant. Below is the standard three-phase roadmap from kickoff to production handoff.
You send 200–500 sample containers (good + defective). We build the imaging rig, tune lighting for your container material and run initial model training on labelled images.
Pre-configured NVIDIA AI server is racked and ready on your floor. Cameras and lighting are mounted over the conveyor. Model is calibrated against live line speed and container pitch.
PLC reject signal is wired to your existing reject gate. QMS/MES integration is configured. Operators are trained on the chat interface for real-time line queries.
Frequently asked questions
Yes. Backlight intensity and exposure are tuned per container material during Phase 1. Frosted PET requires a higher-intensity collimated source; opaque HDPE uses a reflected-light geometry instead of backlight for fill detection. We validate against your actual containers before deployment.
The system outputs a dry-contact or EtherCAT reject signal to your PLC, timed to your container pitch and gate position. We do not replace your reject arm — we drive it. Integration with MES and QMS is configured via OPC-UA or REST API during Phase 3.
Standard deployment handles up to 600 units per minute sustained. Higher speeds (up to 1,200 bpm) are supported with a dual-camera station and frame-drop buffering on the GPU. Inference latency stays under 40 ms per unit regardless of speed.
Yes. The NVIDIA GPU server runs inside your plant network. No image data leaves the floor unless you explicitly export it. Model updates can be pushed via a secure local network path or loaded from a sealed USB by your IT team.
Typically 2–3 days. You provide 200–500 labelled samples of the new container (good and defective). The model is fine-tuned on-prem and validated against a held-out set before the new SKU goes live on the line.
The system runs a self-check routine every 15 minutes against a reference target. If exposure or alignment drifts beyond tolerance, it raises a maintenance alert and switches to a hold-and-log mode — it will not pass uninspected product through.
Send us your containers — we will tell you what we can catch
Ship 200 sample bottles or send images of your defect set. Within two weeks you receive a per-defect accuracy report, an imaging plan and a pilot quote. No commitment, no cloud dependency.