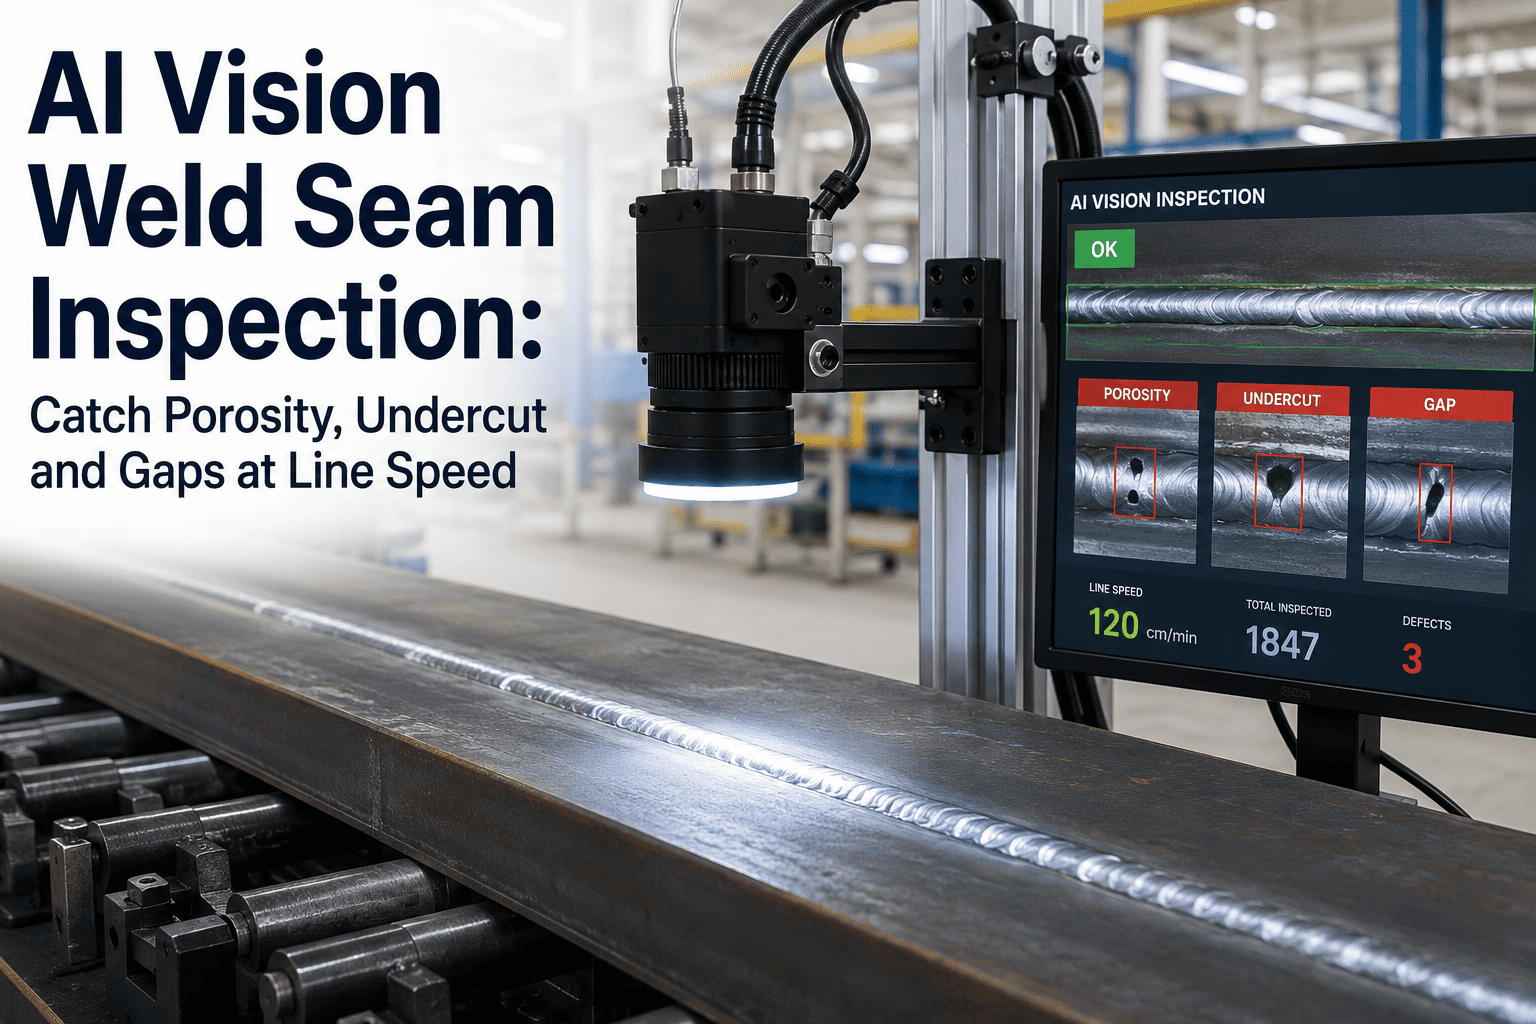
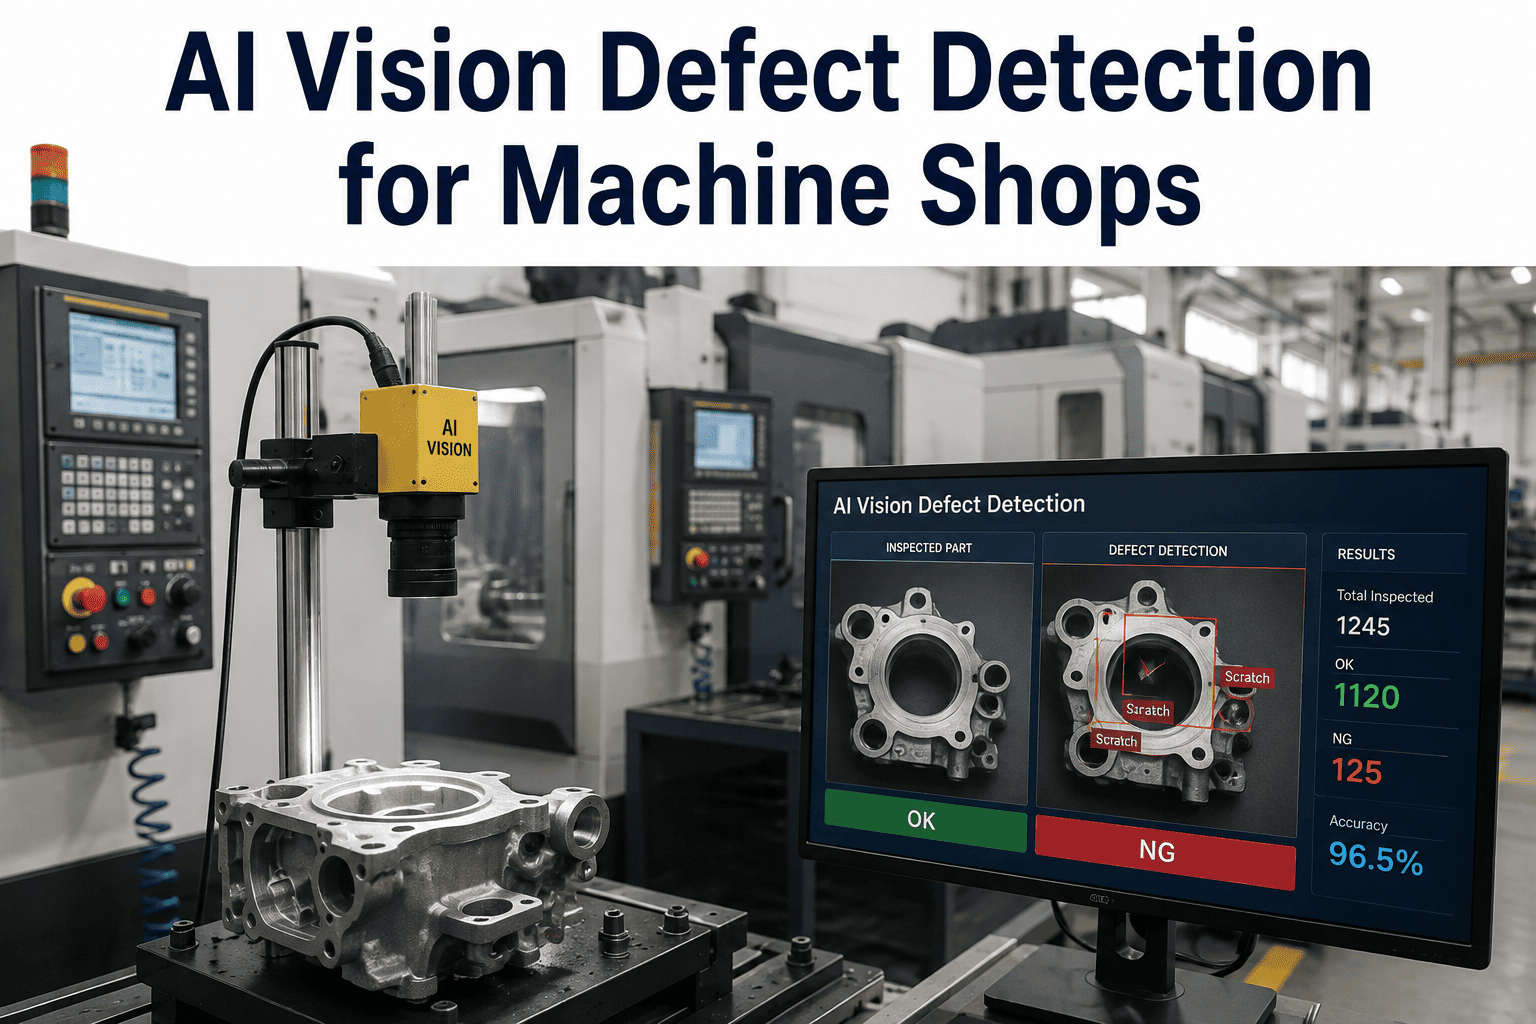
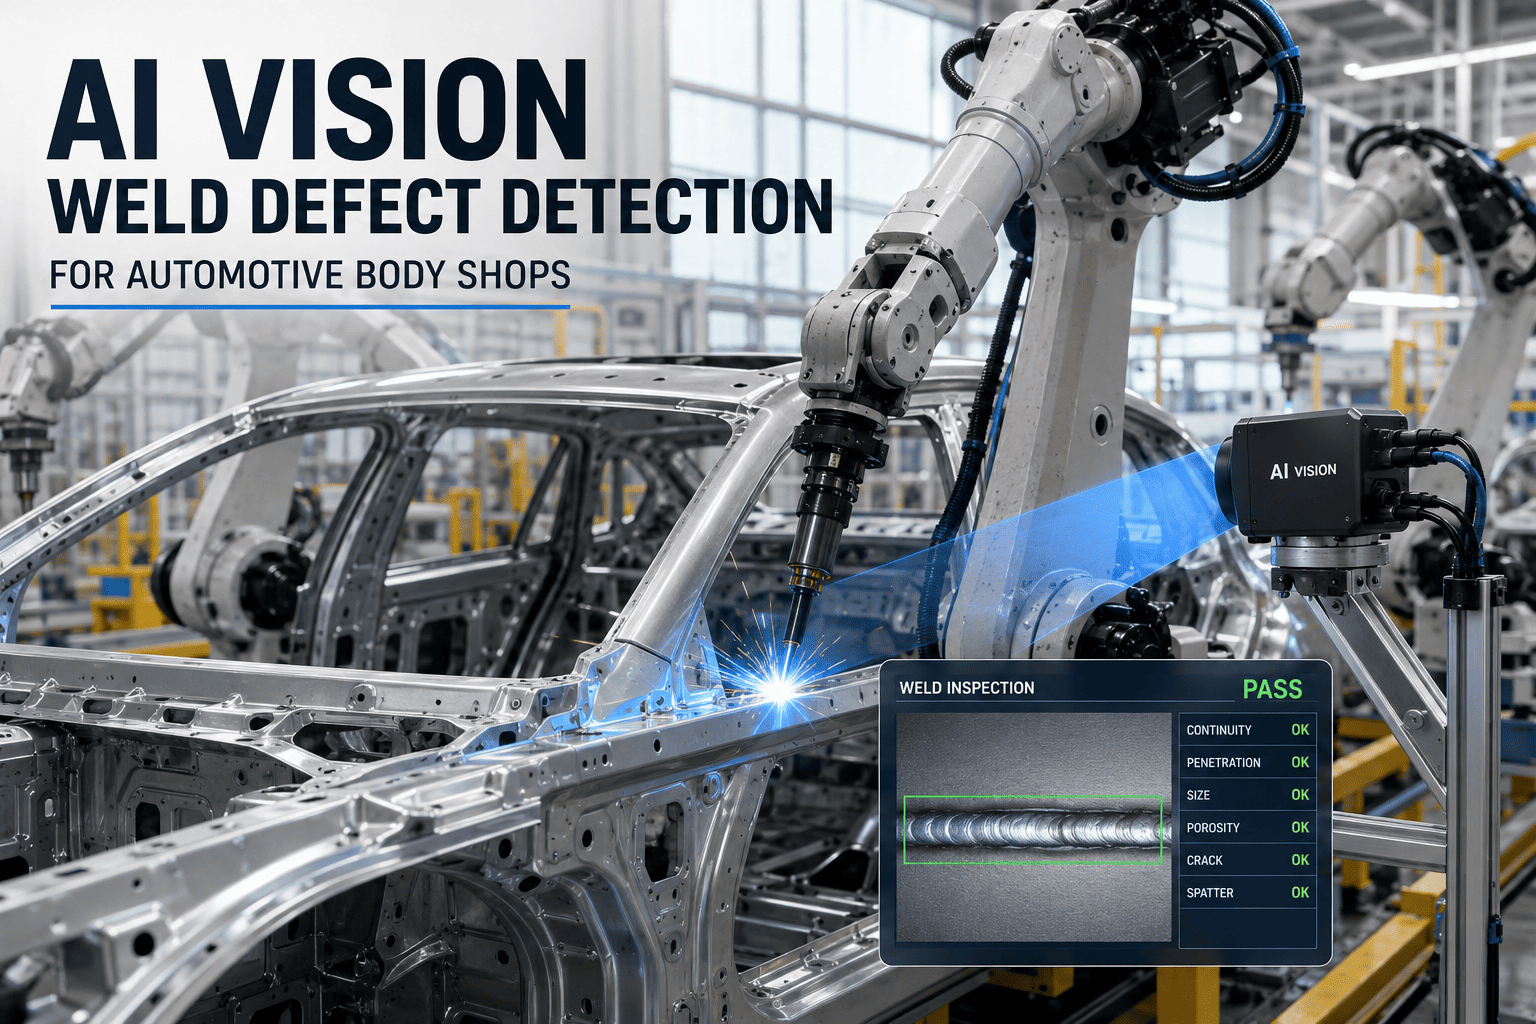
AI Vision Weld Seam Inspection: Catch Porosity, Undercut and Gaps at Line Speed
By Josh Brook on July 7, 2026
Weld seams fail in milliseconds. A 2% drift in wire-feed speed under a slightly unstable arc and a previously sound bead begins carrying porosity along its toe — invisible to the operator, invisible to a rule-based camera, but caught by a deep-learning vision model that has seen ten thousand variations of that same defect under that same lighting. This page walks through how AI vision inspects weld seams at line speed: what each defect looks like, why conventional inspection misses it, the imaging geometry that makes the seam readable, how models are trained and validated, and how every detection is routed to good, rework, or scrap in milliseconds through your existing Level 2 PLC.
AI VISION FOR WELD SEAM INSPECTION
Catch porosity, undercut, spatter and gaps at line speed — before the part leaves the cell.
Deep-learning vision retrofitted to your existing weld cells. On-prem NVIDIA GPU inference routes every detection to good, rework, or scrap through your Level 2 PLC, and writes the QMS record with image, severity, and PLC tags before the next part indexes.
Detection rate on porosity, undercut, spatter, gaps
<40 ms
Inference latency per frame, on-prem GPU
6
Defect classes covered out of the box
99.9%
Uptime across 1000+ industrial clients
Understanding weld seam defects
Every weld defect has a signature shape, a cause rooted in process physics, and a severity window. The model needs to recognize the shape; the engineer needs to understand the cause. Below: the six defect classes the system is trained on, what they look like on the bead, and the process condition that produces them.
Porosity
Gas bubbles trapped in the solidifying puddle. Caused by contaminated base metal, moisture in shielding gas, or excessive arc length.
Severity tiers: cosmetic / rejectable / critical
Undercut
A continuous groove melted along the toe of the weld where the parent metal was not refilled. Linked to high travel speed or excessive current.
Severity tiers: surface / depth-measured
Spatter
Molten metal droplets ejected alongside the bead. Caused by arc instability, excessive wire-feed, or improper gas coverage. Cosmetic on most parts, functional on precision assemblies.
Severity tiers: cosmetic / functional
Burn-through
The arc penetrates fully through the base metal, leaving a hole. Caused by excessive current on thin stock, slow travel, or a wide root gap.
Severity: always critical
Incomplete fusion
The weld metal does not bond with the parent metal at the interface. Caused by low heat input, incorrect torch angle, or surface contamination.
Severity: rejectable to critical
Gap / mismatch
Excessive root opening or lateral misalignment between parts before welding. A fit-up defect that propagates into the bead if not caught upstream.
Severity: dimensional / structural
Why manual and rule-based inspection miss them
A human inspector working an 8-hour shift on a moving line catches roughly 70% of visible defects — fatigue and lighting variability do the rest. Rule-based vision does worse on welds: a threshold-based edge detector calibrated for one bead geometry breaks the moment part variant, wire lot, or ambient lighting shifts. The comparison below shows the same weld image processed three ways.
Manual inspector
~70%
detection rate
Fatigue after 4 hours. Lighting drift across the cell. Inconsistent severity calls between shifts. No image record of what was passed.
vs
Rule-based vision
~55%
detection rate
Edge thresholds and blob-size filters calibrated on one bead geometry. Breaks on part variants, wire-lot changes, or a 15% shift in ambient light. Endless re-tuning.
vs
iFactory AI vision
98.4%
detection rate
Deep-learning model trained on real weld images across variants and lighting. Holds detection rate as conditions drift. Every frame stored with severity and PLC tags.
Where rule-based vision breaks down — six failure modes
Part variant change25%
Ambient light shift30%
Wire-lot surface change35%
Bead geometry variation28%
Reflection / glare20%
Spatter near bead32%
Bars show rule-based vision detection rate per condition. Deep-learning models trained on varied weld imagery hold above 95% across all six.
Imaging setup that works
A weld bead is a curved, specular surface sitting inside a cell lit by arc glare, ambient shop light, and shadow. Reading it reliably requires a deliberate combination of camera, optics, and lighting geometry — not a generic industrial camera bolted overhead. The diagram below shows the configuration iFactory deploys.
Camera
5 MP global-shutter, 35 mm lens, 60 mm working distance. Freeze motion at line speeds up to 30 m/min.
Lighting
Dual low-angle LED strips at 22 degrees for toe and undercut relief, plus a diffuse on-axis ring to kill specular glare off the bead crown.
Optics
Telecentric option for gap and mismatch measurement. Standard macro for porosity, spatter, and burn-through classification.
Trigger
Part-present sensor or PLC tag. Frame captured within 50 ms of weld completion, before the part indexes.
AI model training and validation
A weld defect model is only as good as the imagery it was trained on. iFactory trains on real weld images collected from production cells — not synthetic renderings — labeled by certified welding inspectors across three severity tiers. The pipeline below shows how raw images become a validated, deployable model.
01
Image collection
10,000+ weld images per defect class, captured across part variants, lighting conditions, and wire lots from real production cells.
02
Expert labeling
Certified welding inspectors tag defect class, location, and severity tier. Double-labeled with adjudication on disagreements above 5%.
03
Augmentation
Lighting shifts, rotation, blur, and noise augmentation to harden the model against the drift it will see in production.
04
Validation
Held-out set of 2,000+ images per class. Per-class precision and recall reported. No model ships below 95% recall on critical defects.
Defect class
Cosmetic
Rejectable
Critical
Porosity
Surface pores < 0.5 mm
Cluster density above spec
Pipe-type or aligned pores
Undercut
Visible groove, depth < 0.3 mm
Depth 0.3 to 0.5 mm
Depth above 0.5 mm or continuous
Spatter
Isolated droplets outside functional zone
Droplets on mating surface
Spatter in thread or seal zone
Burn-through
—
—
Always critical
Incomplete fusion
—
Localized at start or stop
Continuous along interface
Gap / mismatch
Within tolerance band
Tolerance exceeded
Structural joint, out of spec
Containment: stop, route, record
When the model flags a defect, the response has to happen before the next part indexes. iFactory writes the disposition decision to your Level 2 PLC in under 40 milliseconds and creates the QMS record in parallel. The flow below traces a single detection from frame capture to archived record.
Frame captured
0 ms
Inference
~35 ms
Disposition
~38 ms
GOOD
PLC tag: PASS. Part indexes forward. No record created unless sampled.
REWORK
PLC tag: ROUTE_REWORK. Divert to rework station. QMS record with image and severity.
SCRAP
PLC tag: ROUTE_SCRAP. Divert to scrap bin. QMS record with image, severity, and PLC snapshot.
PLC tags written at defect time — captured for root-cause analysis
WELD_CELL_IDcell_03
ARC_CURRENT218.4 A
WIRE_FEED_RATE7.2 m/min
TRAVEL_SPEED0.42 m/min
SHIELDING_GAS_FLOW14.1 L/min
TORCH_ANGLE12.3 deg
PART_IDAX-2048-K
DEFECT_CLASSporosity
SEVERITY_TIERrejectable
Want to see this routing against your own PLC tag map? Book a demo and we will walk through the integration on your cell.
Root cause analysis from production data
Every detection is stored with the PLC snapshot from the moment the defect formed. Over days and weeks, patterns emerge: a particular cell drifting high on arc current, a wire lot producing surface changes, a torch angle creeping out of spec. The heatmap below shows defect frequency by cell and shift over a 30-day window from a real deployment.
Porosity detections per cell per shift — 30-day window
Shift A
Shift B
Shift C
Weekend
Cell 01
3
7
2
0
Cell 02
4
9
14
5
Cell 03
16
28
31
11
Cell 04
2
3
6
1
Cell 05
1
2
4
0
LowHigh
Root cause found
Cell 03, Shift C: arc current drifted 8% above setpoint over 30 days. Torch angle off by 4 degrees. Corrective action: recalibrate cell 03 power supply and retrain operator on torch positioning. Porosity dropped 72% the following week.
Benchmarks and pilot scoping
Below: per-class detection performance from the last three production deployments, and the pilot scope we run to validate the system on your welds before full rollout.
0.99
Defect class
Precision
Recall
F1
False positives / 1000 parts
Porosity
0.97
0.98
0.97
2.1
Undercut
0.96
0.95
0.96
3.4
Spatter
0.98
0.99
0.98
1.2
Burn-through
0.99
0.99
0.3
Incomplete fusion
0.94
0.92
0.93
4.8
Gap / mismatch
0.97
0.96
0.96
2.7
Pilot scope — live in 6 to 12 weeks on a 3-phase roadmap
Phase 1
Sample evaluation
Send 50 to 200 weld images or physical samples. We label, train a baseline model, and report per-class feasibility within 2 weeks.
Weeks 1 to 2
Phase 2
Cell integration
Camera and lighting installed on one weld cell. PLC tag mapping, QMS API connection, and on-prem NVIDIA GPU racked and ready.
Weeks 3 to 8
Phase 3
Production validation
Parallel run with manual inspection for 2 to 4 weeks. Detection rate confirmed against ground truth. Sign-off and rollout plan.
Weeks 9 to 12
Operator-to-AI dialogue — live cell terminal
Operator
Cell 03 flagged three parts in a row for porosity. Is it the wire?
iFactory AI
Porosity cluster detected on cell 03, shift C. Arc current averaging 224 A against setpoint 210 A. Wire-feed rate stable. Shielding gas flow dropped to 11 L/min at 14:32. Recommend: check gas regulator and verify arc current calibration.
Operator
Gas regulator was loose. Fixed. Can you re-evaluate the last 10 parts?
iFactory AI
Re-evaluated parts 2041 through 2050. Parts 2041 to 2044 retain rejectable porosity. Parts 2045 to 2050 show no porosity. Gas flow restored to 14.1 L/min. Cell 03 cleared for production.
Frequently asked questions
Can the system inspect welds on parts we have never run before?
Yes, with a short fine-tuning cycle. Send 50 to 200 images of the new part's welds. We label, fine-tune the model, and validate against a held-out set. Typical turnaround is 5 to 10 business days for a new part variant.
Does it run inside our plant network, or in the cloud?
On-prem. A pre-configured NVIDIA AI server is racked inside your facility and runs inference inside your plant network. No weld images leave your site unless you explicitly push them to a QMS or ERP system via API.
How does the system handle lighting drift over time?
The diffuse on-axis ring and low-angle strips are actively monitored for intensity drift. The model is also trained on augmented imagery with brightness shifts up to 20%, so minor drift does not affect detection. Major drift triggers a maintenance alert.
What PLC protocols are supported for containment routing?
EtherNet/IP, Profinet, Modbus TCP, and OPC UA. The system writes disposition tags directly to your Level 2 PLC. Tag mapping is configured during Phase 2 integration and tested against your divert logic before production validation.
How are QMS records created, and what do they contain?
Each rejected part generates a QMS record via API to your existing system (SAP, Plex, IQMS, or custom). The record contains the defect image, defect class, severity tier, PLC snapshot at defect time, part ID, cell ID, and timestamp. Records are created in parallel with PLC routing, so they do not add latency to the line.
What is the false-positive rate, and how do you control it?
Typical false-positive rate is 2 to 5 per 1000 parts, depending on defect class. We control it through double-labeling during training, a held-out validation set with per-class precision thresholds, and a confidence-score threshold that can be tuned per defect class during production validation.
DEFECT-SAMPLE EVALUATION
Send us your weld samples or images. We will give you a feasibility read in 2 weeks.
Send 50 to 200 weld images or physical samples. Our team labels them, trains a baseline model on your defect classes, and reports expected detection rates per class before you commit to a pilot. No cost, no obligation.