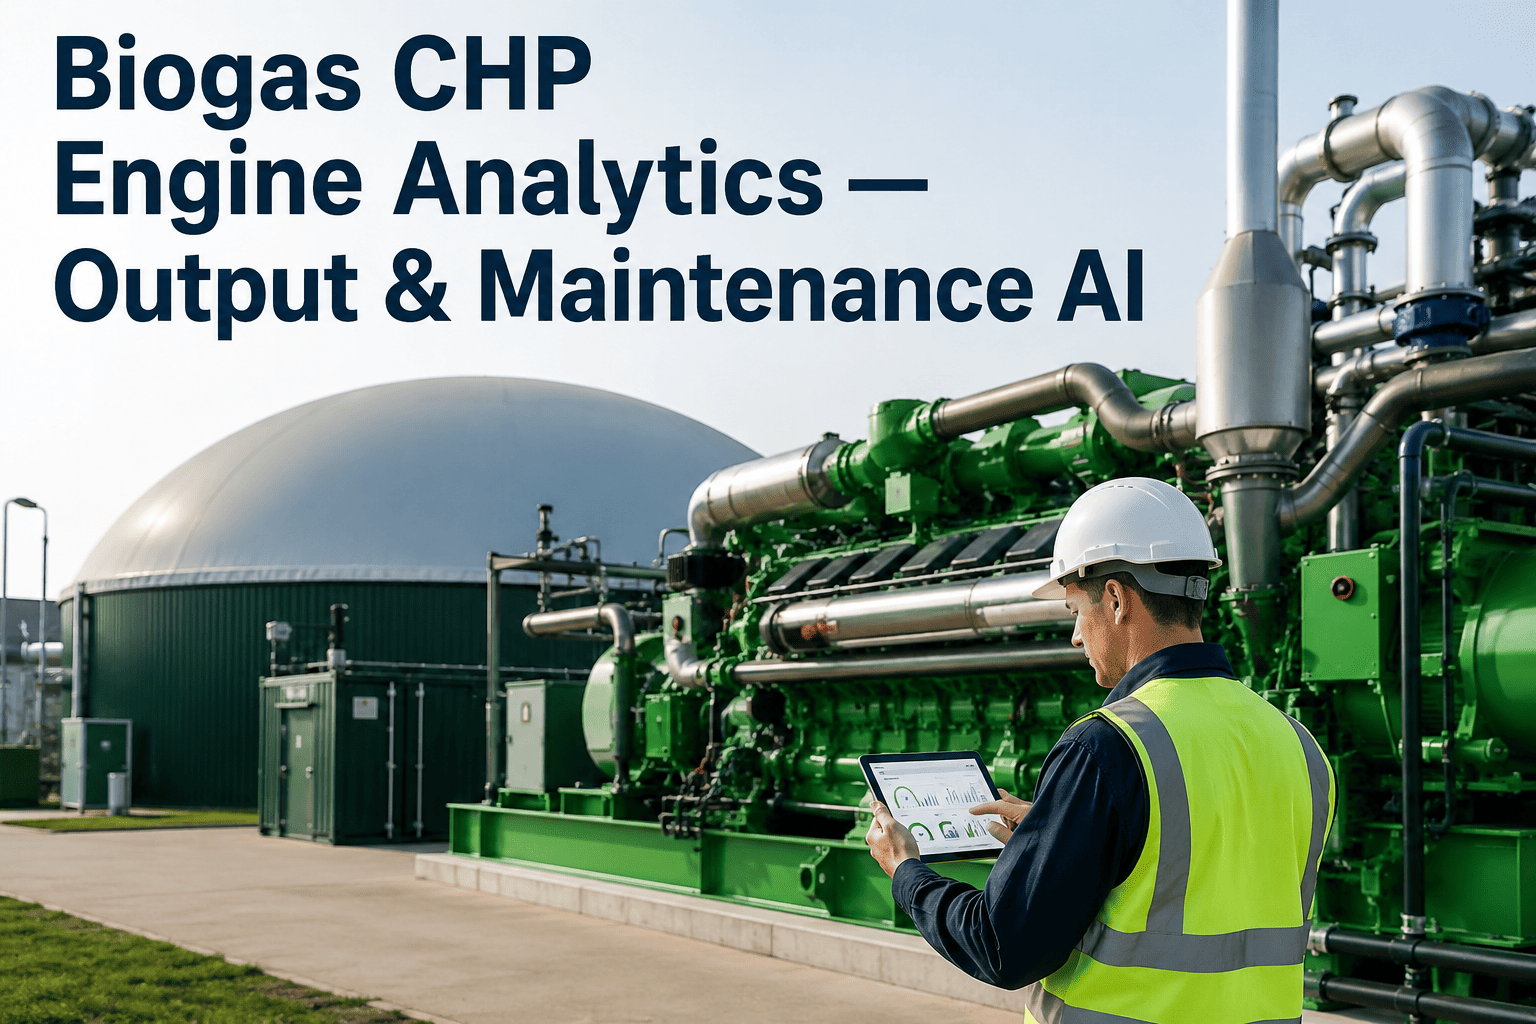
A biogas CHP engine running on methane-rich gas with elevated hydrogen sulfide content ages nothing like a natural gas engine. Oil acidifies faster, spark plugs wear down sooner, and valve seat recession shows up at a fraction of the interval a standard service schedule assumes, which is exactly why plants applying natural gas maintenance schedules to biogas units keep hitting unplanned shutdowns at 1,800 to 2,200 hours that should have been caught at the 1,500-hour service. A single 500 kWe unit down for 72 unplanned hours can cost between $6,300 and $12,600 in lost electricity revenue before an emergency contractor even arrives, which is why more operators are moving engine oversight from a calendar to a live condition-monitoring dashboard instead.
Know Your Engine's Health Before It Tells You the Hard Way
iFactory tracks electrical output, thermal recovery, oil condition, and exhaust composition on every CHP unit continuously, maximizing power generation revenue and extending overhaul intervals well beyond a fixed calendar schedule.
Two Numbers That Determine Every CHP Unit's Return
Electrical Efficiency Target
Automatic calibration against real-time process models lifts electrical efficiency from a typical 21% baseline toward a 42% target.
Thermal Efficiency Target
Heat recovery from engine cooling water and exhaust gas is tracked continuously against a 50% thermal efficiency target.
Fuel Utilization Target
Combined electrical and thermal output measured against total fuel input, with real-time calibration lifting utilization toward 90%.
The Failure Modes a Fixed Schedule Always Misses
Oil Acidification
H₂S content in biogas accelerates oil breakdown well beyond natural gas engine norms, and oil analysis trending catches the drift before lubrication failure damages bearings.
Spark Plug & Valve Wear
Combustion chemistry differences from methane variability wear ignition components faster, and vibration and combustion drift monitoring flags replacement before misfire starts.
Scrubber & Filter Exhaustion
Differential pressure and gas composition analysis track scrubber media depletion, scheduling replacement before corrosive gas reaches the engine and causes secondary damage.
Exhaust Anomalies
Abnormal exhaust plume signatures and thermal anomalies are detected continuously, catching combustion issues that scheduled inspection rounds run right past.
Condition-Based Maintenance Changes the Overhaul Math
Longer engine life from condition-based maintenance versus reactive repair
Typical savings per overhaul cycle from condition-based versus calendar-based service
Annual runtime a biogas CHP engine sustains under continuous condition monitoring
Higher unplanned downtime risk plants face from undetected thermal and exhaust anomalies
Watch Your CHP Engine's Health Score in Real Time
Our engineers will configure a live predictive dashboard for your specific CHP unit so you can see early failure detection before you commit.
Calendar-Based Service vs. Condition-Based Monitoring
| Maintenance Task | Calendar-Based Schedule | iFactory Condition Monitoring |
|---|---|---|
| Oil condition assessment | Fixed sample interval | Continuous trending, early warning |
| Spark plug replacement | Fixed hour count | Triggered by combustion drift data |
| Scrubber media service | Estimated depletion schedule | Differential pressure-triggered |
| Overhaul planning | Fixed hour interval regardless of condition | Remaining useful life calculated live |
| Efficiency tracking | Monthly kWh review | Continuous electrical and thermal curve |
Frequently Asked Questions
How does monitoring connect to our existing CHP engine controls?
Vibration, temperature, pressure, oil quality, and current draw sensors are mounted directly on the CHP engine and connect to your existing SCADA system through standard protocols such as Modbus, OPC-UA, or HART, so no control system rewiring is required. Data streams at sub-second intervals once connected, giving continuous visibility into engine condition rather than the periodic snapshots a manual inspection round provides. You can review the specific sensor and protocol setup for your engine model with our team through this booking link.
How long before the system learns what normal looks like for our specific engine?
Machine learning models typically spend two to four weeks learning baseline behavior for each piece of equipment under varying load, feedstock, and ambient conditions, and historical failure records accelerate that training so the system isn't starting from a blank baseline. Once established, each asset receives a continuously updated health score, and the AI calculates remaining useful life and failure probability whenever sensor patterns deviate from what's been learned as normal for that specific unit.
Why does biogas require different maintenance thinking than natural gas CHP?
Biogas contains hydrogen sulfide and runs at different methane concentrations than natural gas, which accelerates oil acidification, speeds spark plug wear, and causes valve seat recession at a fraction of the interval a natural gas service schedule assumes. Plants that apply standard natural gas maintenance intervals to biogas units are the ones most likely to hit unplanned shutdowns between 1,800 and 2,200 hours, right where a natural gas schedule would have called the engine healthy. Condition-based monitoring accounts for these biogas-specific wear patterns directly rather than relying on a generic interval.
Does this help reduce false alarms compared to simple threshold-based alerts?
Yes, one of the core advantages of a trained baseline model over simple threshold alerts is that it distinguishes normal operational variation, such as load changes or feedstock shifts, from genuine equipment degradation. Threshold-based systems tend to either miss slow degradation that never crosses a fixed line, or generate so many false alarms from normal variation that operators start ignoring them. A continuously updated health score avoids both failure modes by learning what normal actually looks like for your specific engine.
What's the realistic payback timeline for a single CHP unit?
Most facilities identify their first significant savings opportunity within 30 to 45 days of live monitoring, typically from catching a developing CHP engine issue or pump seal degradation that would otherwise have caused unplanned downtime. Given that a single unplanned 72-hour outage on a 500 kWe unit can cost over $10,000 in lost revenue alone, avoiding even one such event in the first months of deployment often covers a meaningful share of the monitoring investment. For a payback estimate specific to your unit size and runtime, reach out through our support page.
Stop Losing Revenue to Engines That Fail Between Services
Schedule a personalized walkthrough and see exactly how AI monitors your digester, CHP engine, and pumps in real time.