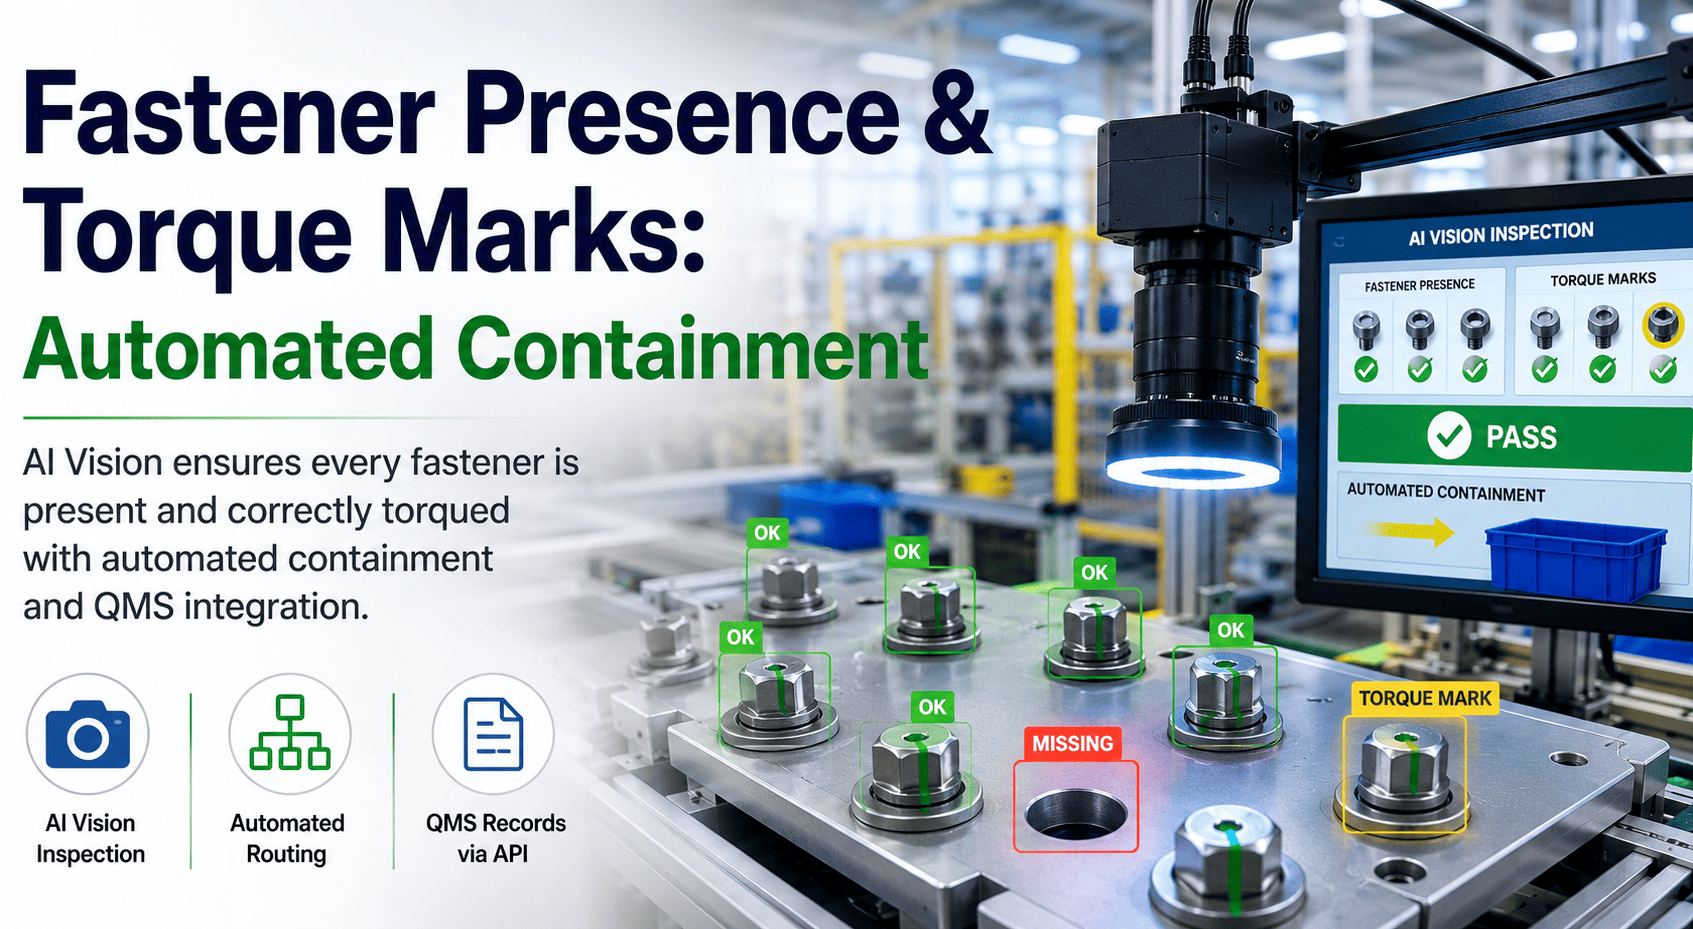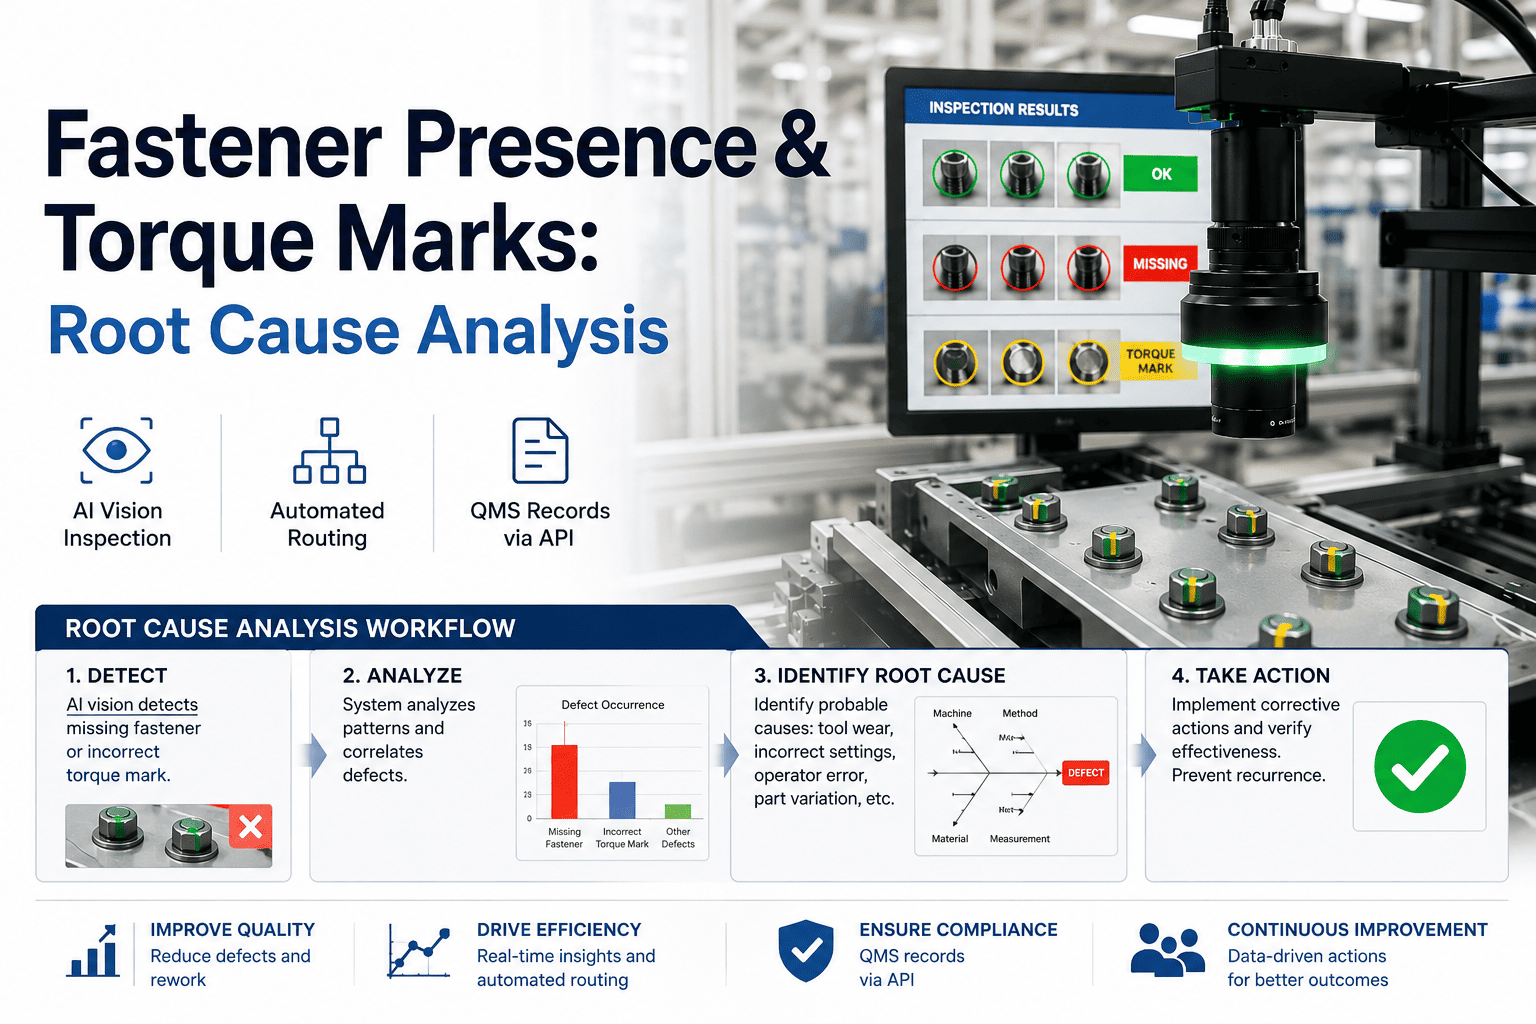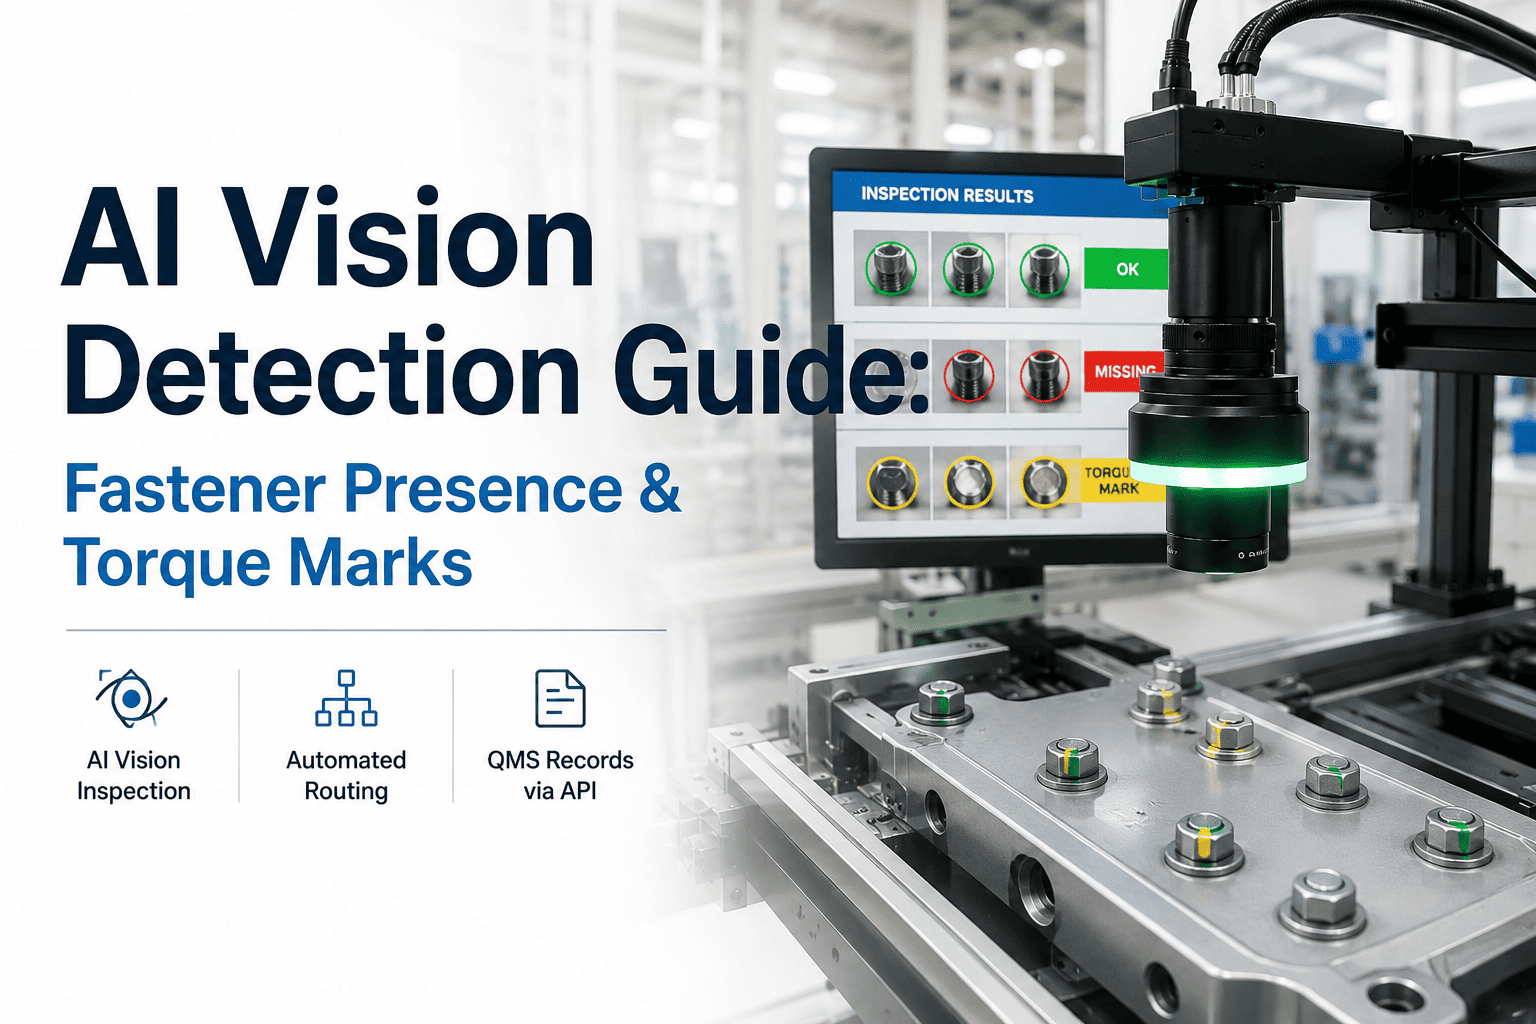
Bolted assemblies fail in two quiet ways: a fastener that never made it into the hole, and a fastener seated but never torqued. The first leaves an empty bore and a loose clamp load of zero. The second leaves a bolt head with no rotational witness mark, meaning the operator or driver skipped the final angle, the bit slipped on the hex, or the torque-and-angle sequence aborted mid-cycle. Both defects are invisible to downstream functional tests until vibration, leak, or field return exposes them weeks later. AI vision closes that gap by reading presence and witness marks at line speed, then routing the part before it leaves the cell.
Fastener Presence & Torque Marks on Bolted Assemblies
Deep-learning models sustain detection rates manual inspection cannot — across shifts, lighting drift, and part variants — then fire containment in milliseconds through Level 2 PLC/DCS integration.
1. Understanding Fastener Presence & Torque Marks
A bolted joint is a clamp: the fastener stretches under tension, pressing the joined members together with a force equal to the applied torque divided by the friction coefficient of the thread and bearing surfaces. If the fastener is absent, clamp load is zero. If the fastener is present but untorqued, clamp load is also zero — the bolt sits finger-tight, free to back out under vibration. The torque mark, also called a witness mark, is the rotational scuff left on the bolt head or washer face when the driving tool bit contacts and turns the fastener through its final angle. Its presence proves the driver engaged; its angular position can even confirm the torque-and-angle strategy executed correctly.
- Clamp load: zero on that joint
- Root causes: feeder jam, bit slip, operator skip
- Visual signal: empty hole, no head silhouette
- Clamp load: near zero, finger-tight
- Root causes: aborted angle, bit slip on hex
- Visual signal: clean head, no rotational scuff
Both defects share a failure mode: the joint passes assembly but fails in service. The difference is what the vision system must detect — silhouette absence versus surface-texture absence — and they demand different imaging strategies, covered in Section 3.
2. Why Manual and Rule-Based Inspection Miss Them
Manual inspection fails on attention, not competence. A line operator checking 1,200 assemblies per shift cannot sustain the fixation discipline required to catch a 0.3 percent defect rate — that is roughly one defect every 27 minutes, buried among parts that all look correct. Rule-based vision systems fail differently: they rely on edge-detection or blob-analysis thresholds calibrated to a specific part pose, surface finish, and lighting level. When any of those drift — a new lot of castings with a rougher flange, a fluorescent tube aging 200 lumens, a fixture wearing 1.5 mm of play — the threshold either over-triggers false rejects or silently stops catching the defect.
Attention decay after 20 minutes of repetitive search; shift-to-shift variance uncontrolled.
Deep features tolerate pose, finish and lighting drift; no threshold to lose calibration.
Blob/edge thresholds calibrated to one pose, one finish, one lux level. Recalibration is manual and reactive.
Learns defect features, not pixel thresholds. New variants added with 50-200 labeled samples, no recoding.
The core tradeoff: rule-based vision is brittle but explainable — you can trace exactly which threshold fired. Deep learning is robust but opaque unless you instrument it with Grad-CAM attention maps and confidence calibration, which iFactory deploys by default so every reject decision ships with a visual explanation overlay.
3. Imaging Setup That Works
Detection is downstream of imaging. If the camera cannot see the defect, no model will find it. The two defect classes demand opposite lighting geometries: missing-fastener detection needs high-contrast silhouette lighting to resolve an empty bore against the part surface, while torque-mark detection needs directional grazing light to cast the micro-scratches of the witness mark into visible relief. A single camera with a programmable strobe controller can capture both in sequence within a 60 ms window.
Camera & Optics
Global shutter prevents motion smear at belt speeds up to 1.2 m/s. Rolling shutter at that speed stretches bolt-head geometry and creates phantom false rejects.
Silhouette Lighting
Resolves hole presence/absence against the casting surface. The bolt head silhouette drops to near-black, giving the model a clean binary signal.
Grazing Lighting
Low-angle light rakes across the bolt head, casting rotational scuff marks into visible relief. Polarizer kills specular bloom off the hex face.
Trigger & Sync
Syncs image capture to part position so the same bolt pattern lands in the same pixel window every cycle — critical for stable model inference and RCA tag alignment.
4. AI Model Training and Validation
A fastener detection model is only as good as the label distribution it was trained on. The dominant failure mode in production AI vision is not architecture — it is class imbalance: 5,000 images of good parts and 12 images of defects produces a model that predicts "good" 99.8 percent of the time and feels accurate in validation, then misses every real defect on the line. iFactory enforces a minimum defect-class sample count and uses targeted augmentation (rotation, lighting jitter, synthetic occlusion) to close gaps where real defect samples are scarce.
Labeling Strategy
Augmentation pipeline applies rotation (0-360 degrees), brightness shift (plus or minus 30 percent), Gaussian noise, and synthetic bolt-head occlusion. This inflates the effective defect sample count 8-12x without collecting field defects for months.
Validation Confusion Matrix
Diagonal = correct. The 1.1 percent untorqued-as-good is the residual risk the containment tier in Section 5 is designed to catch via confidence thresholding.
The model architecture is a fine-tuned detection backbone (YOLO-class or Faster R-CNN, selected per part complexity) running on an on-prem NVIDIA GPU. Inference stays inside the plant network — no images leave the facility — which satisfies ITAR, proprietary-design, and data-residency constraints that cloud-vision vendors cannot meet. Talk to Support about your specific variant count and we will scope the labeling effort.
5. Containment: Stop, Route, Record
Detection without containment is a dashboard. The value is in what happens in the 40 milliseconds after the model fires: the part must be routed to the correct destination before it leaves the cell, and the event must be recorded for traceability. iFactory uses a three-tier confidence routing scheme that mirrors how a human inspector would triage — high-confidence good parts proceed, borderline parts divert to manual rework review, and hard failures drop to scrap quarantine — all fired through Level 2 PLC/DCS integration.
The routing decision is written to the PLC as a tag write, not a human-readable alert. The diverter actuates on the physical tag, not on an operator reading a screen and pressing a button. This is what makes the containment reliable: there is no human in the 40 ms loop.
6. Root Cause Analysis from Production Data
When a defect spikes, the question is never just "what did the camera see?" — it is "what changed upstream?" iFactory captures PLC tags at the exact moment of defect detection: driver torque curve, bit engagement signal, feeder bowl vibration level, cycle time, operator ID, and material lot. This means every defect image ships with its full process context, and RCA becomes a query against a time-aligned dataset rather than a forensic reconstruction from shift logs.
Defect Rate vs. Driver Bit Wear
Defect rate stays under 0.2 percent through 25k cycles, then climbs sharply as bit hex rounds over — the driver engages but slips on the final angle, producing seated-but-untorqued fasteners. iFactory flags the trend at the inflection, not at the spike.
PLC Tags Captured at Defect Time
These tags are stored against the defect image and pushed via API to MES/ERP, so a quality engineer querying "why did untorqued defects spike on shift 2 last Thursday" gets the answer in one query, not a cross-system forensic dig.
7. Benchmarks and Pilot Scoping
Realistic benchmarks matter because they set the contract between quality engineering and production. The numbers below are from deployed iFactory fastener-detection systems across automotive powertrain, aerospace structures, and heavy-equipment assembly lines. Your line will vary based on part geometry, lighting stability, and defect rate — but these ranges hold across the installations we have instrumented.
| Metric | Manual Inspection | Rule-Based Vision | iFactory AI Vision |
|---|---|---|---|
| Fastener presence recall | 58-67% | 88-93% | 99.0-99.5% |
| Torque mark recall | 45-60% | 72-85% | 97.5-99.0% |
| False reject rate | 0.5-1.2% | 2.0-4.5% | 0.1-0.3% |
| Containment latency | Seconds to minutes | 200-500 ms | 35-45 ms |
| Variant changeover effort | Retraining operators | Recalibrate thresholds, 2-8 hrs | 50-200 labeled samples, no recoding |
| QMS record creation | Manual log entry | Batch export, hourly | Real-time API, under 200 ms |
Pilot Scoping — 4 Weeks to First Number
Ship 20-50 physical parts or 200+ field images. We classify defect modes and confirm imaging geometry.
Defect samples labeled, augmentation pipeline built, model trained on your variant set. Runs on our test GPU rig.
Confusion matrix delivered. We show you the false negatives and false positives, not just the headline accuracy.
You receive a detection-rate commitment, imaging BOM, and integration plan for PLC routing and QMS API records.
8. FAQ
Can the model detect partial torque, or only full presence/absence?
Partial torque is the hardest class because the witness mark is faint and incomplete. We train a dedicated "ambiguous" class with 300+ labeled borderline samples and route those parts to manual rework rather than auto-accepting or auto-rejecting. This is why the three-tier containment exists — the model does not have to be perfect, it has to know when it is uncertain.
How does the system handle a new bolt pattern or part variant?
You collect 50-200 images of the new variant (good and any defect samples available), label them, and trigger a fine-tune job. The model weights update without recoding thresholds or recalibrating blob detectors. The full retraining cycle runs in under 4 hours on the on-prem GPU.
Does inference run on-prem or in the cloud?
On-prem. iFactory deploys an NVIDIA AI inference server inside your plant network. Images never leave the facility, which satisfies ITAR, proprietary-design, and data-residency requirements. The only data that crosses the network boundary is aggregated QMS records via API, and you control exactly which fields are pushed.
What PLC and DCS protocols are supported for containment routing?
EtherNet/IP, PROFINET, Modbus TCP, and OPC UA are supported natively. The routing decision is written as a PLC tag within 4 ms of inference completion. We also support hardwired I/O for legacy cells where network tags are not available.
How are defect images and records pushed to our QMS?
A REST API call fires within 200 ms of the routing decision, pushing the defect image (base64 or object-store URL), severity class, confidence score, PLC tag snapshot, serial number, and timestamp. The payload schema is configurable and maps to standard QMS record fields. We also provide widgets that render the same data inside any existing portal or dashboard.
What detection rate can we realistically expect on our line?
For fastener presence, 99.0-99.5 percent recall is typical once imaging is dialed in. For torque marks, 97.5-99.0 percent is the realistic range — the residual gap is partial-torque cases that route to manual rework. We commit to a specific number after the Week 3 validation on your holdout set, not before.
Send parts or images. Get a feasibility read in 4 weeks.
Ship 20-50 physical parts or 200+ field images of your bolted assemblies. We will classify the defect modes, train a model on your variants, and return a detection-rate commitment with a confusion matrix — not a slide deck.