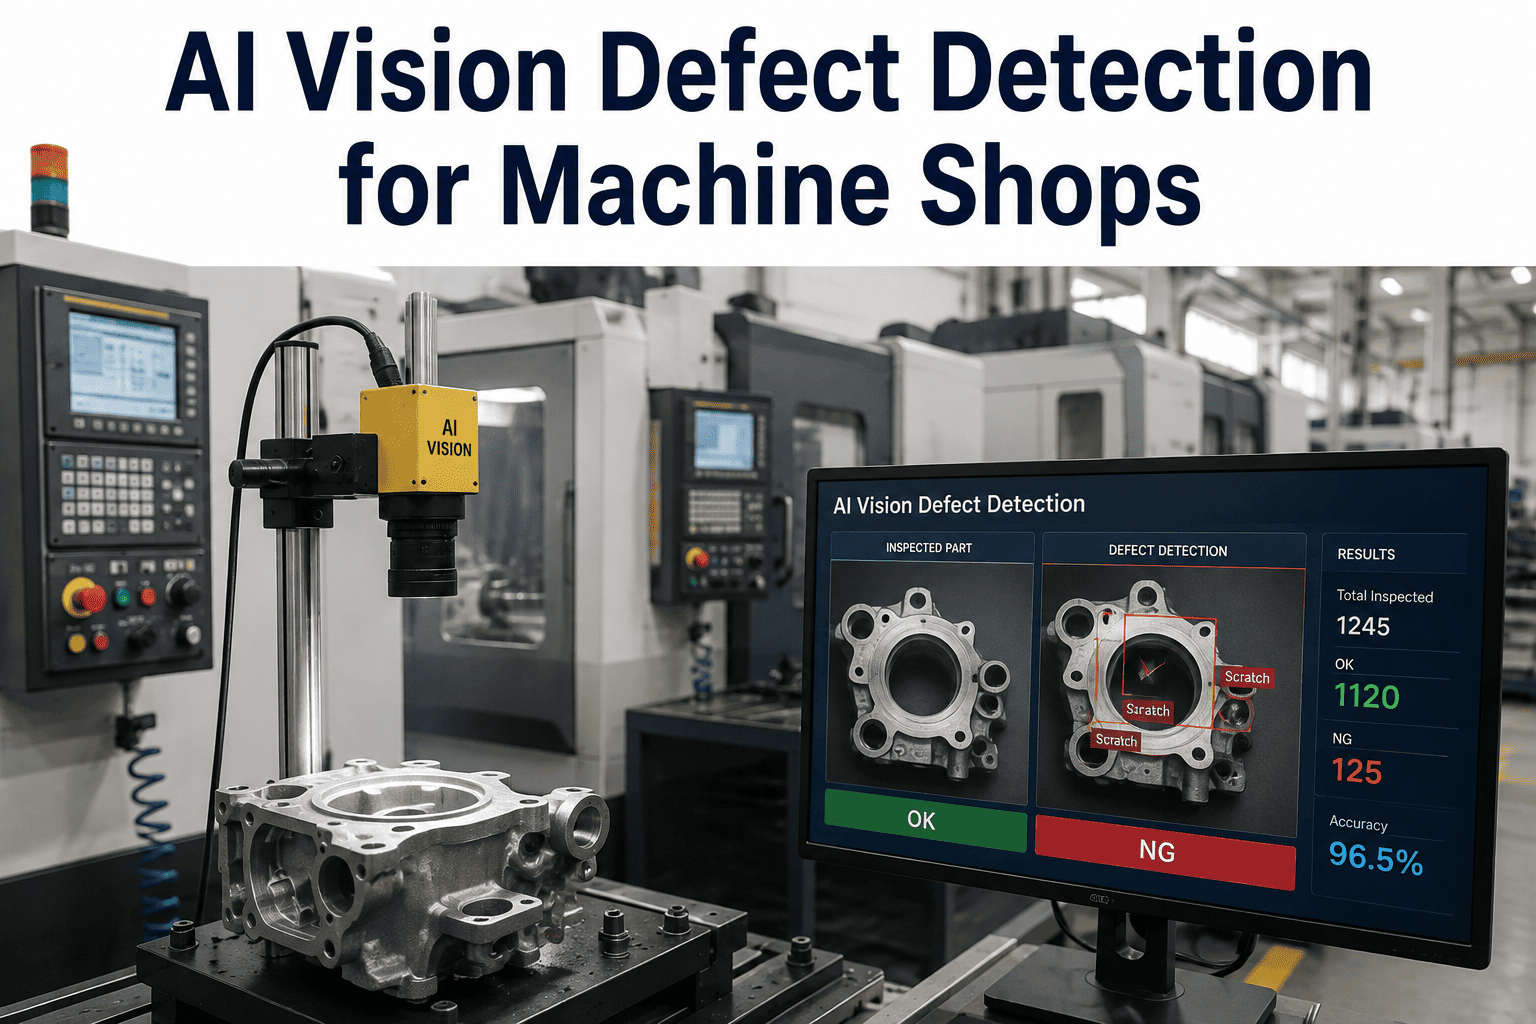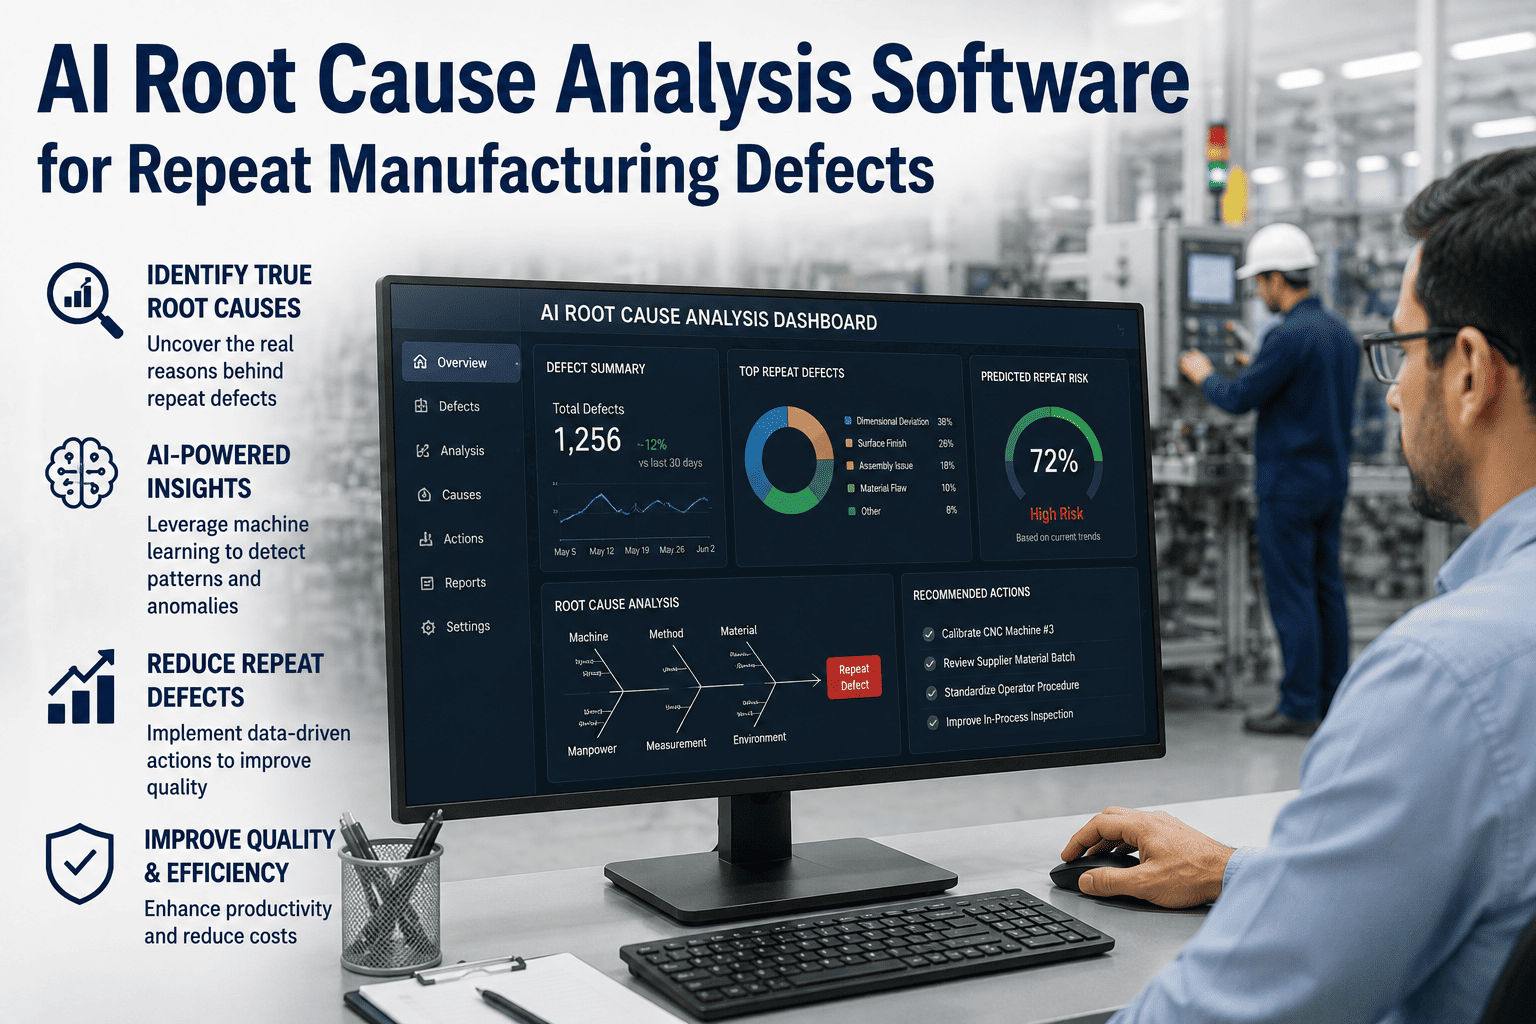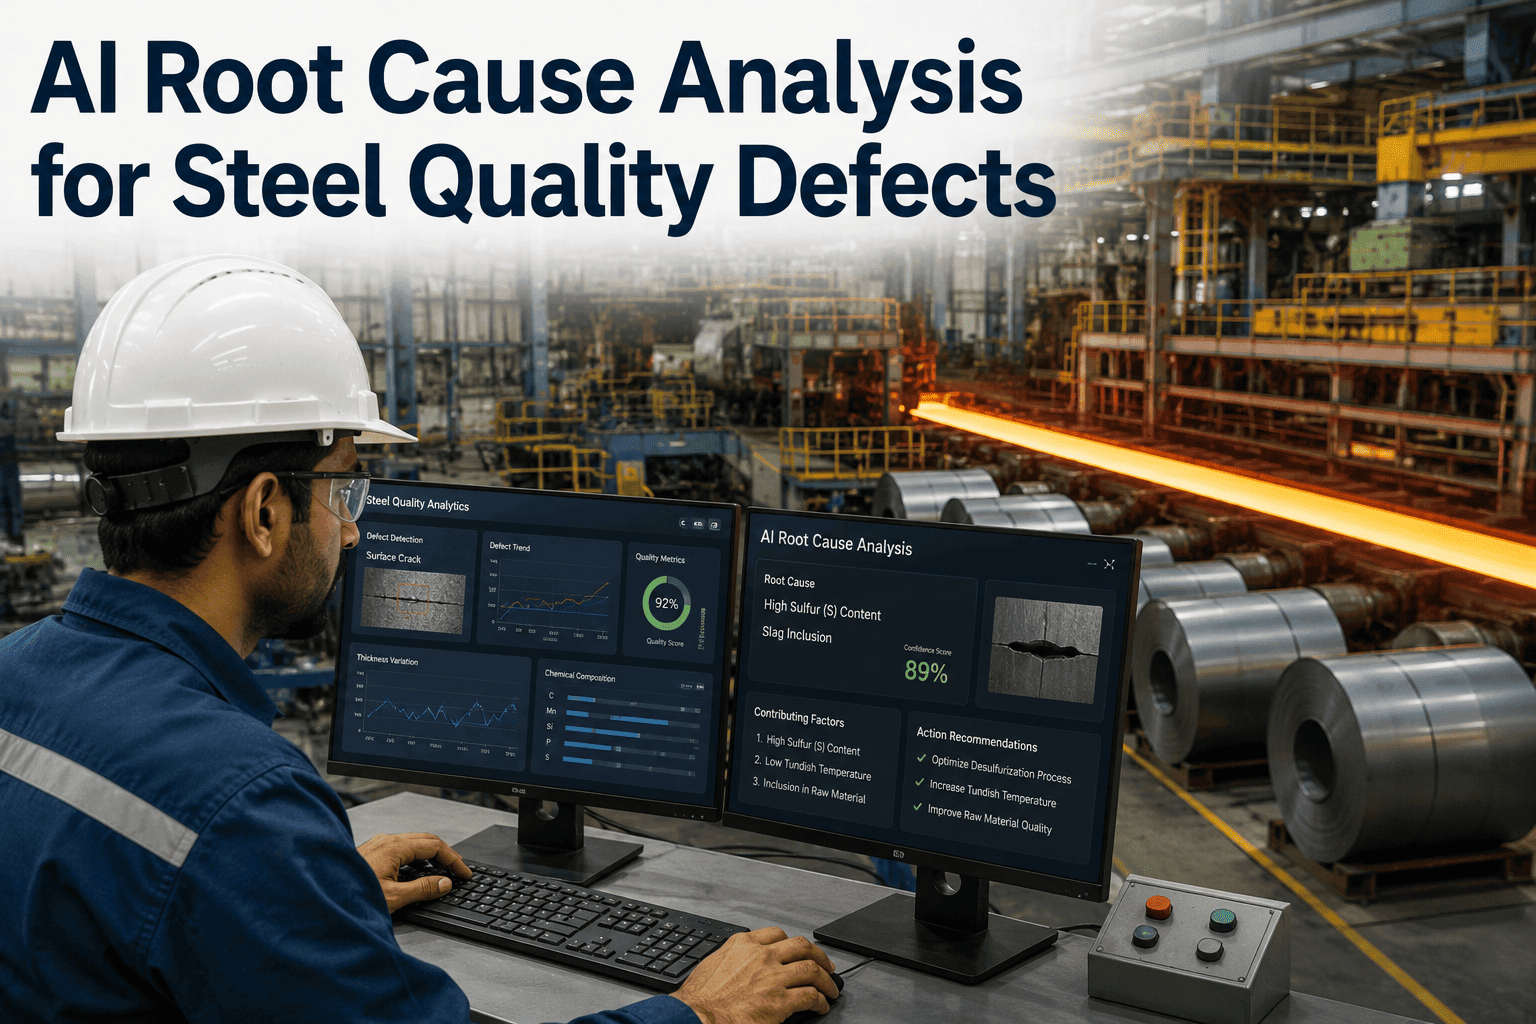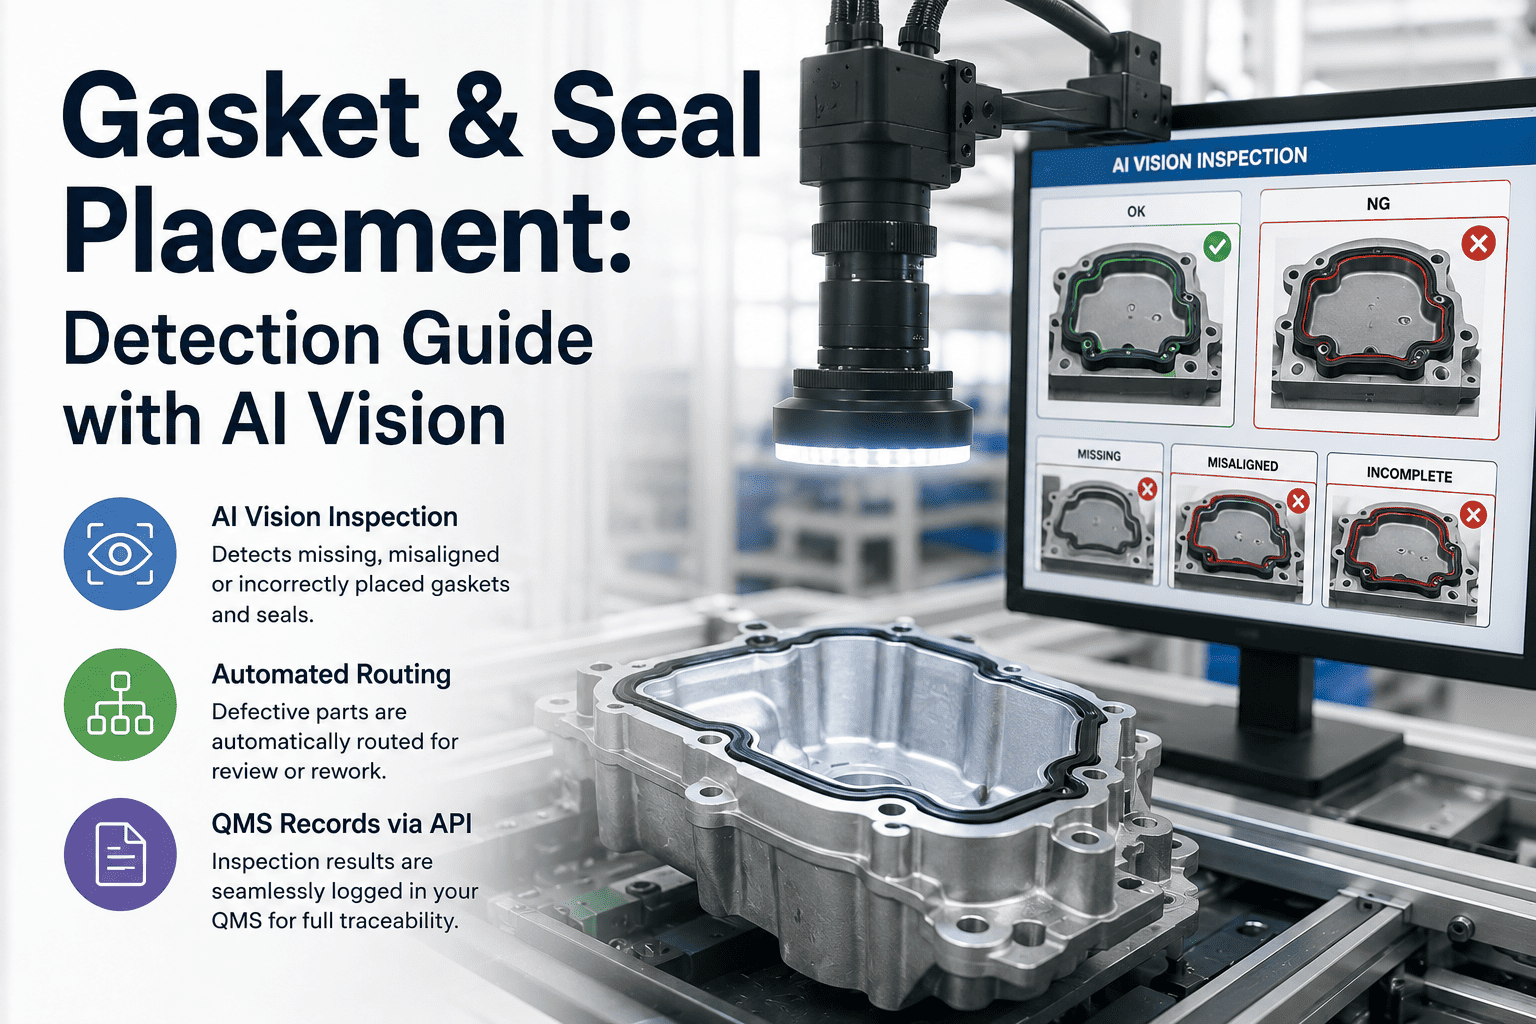
When a molded rubber gasket lands 0.4 mm off its groove on a die-cast aluminum housing, the leak test downstream catches it — but by then the part has already been assembled, pressurized, and routed. The cost of that late catch compounds: the housing is scrapped, the sealed electronics inside are written off, and the line takes a 12-minute hit to clear the station. Gasket and seal placement failures on sealed housings and enclosures are not random events; they are systematic deviations driven by tooling wear, dispense-valve drift, robot teach-pendant offsets, and material viscosity changes that compound across a shift. This page walks through how AI vision detects placement defects at line speed and, more importantly, how detection events get traced back to their root cause through PLC tag correlation and automated QMS records.
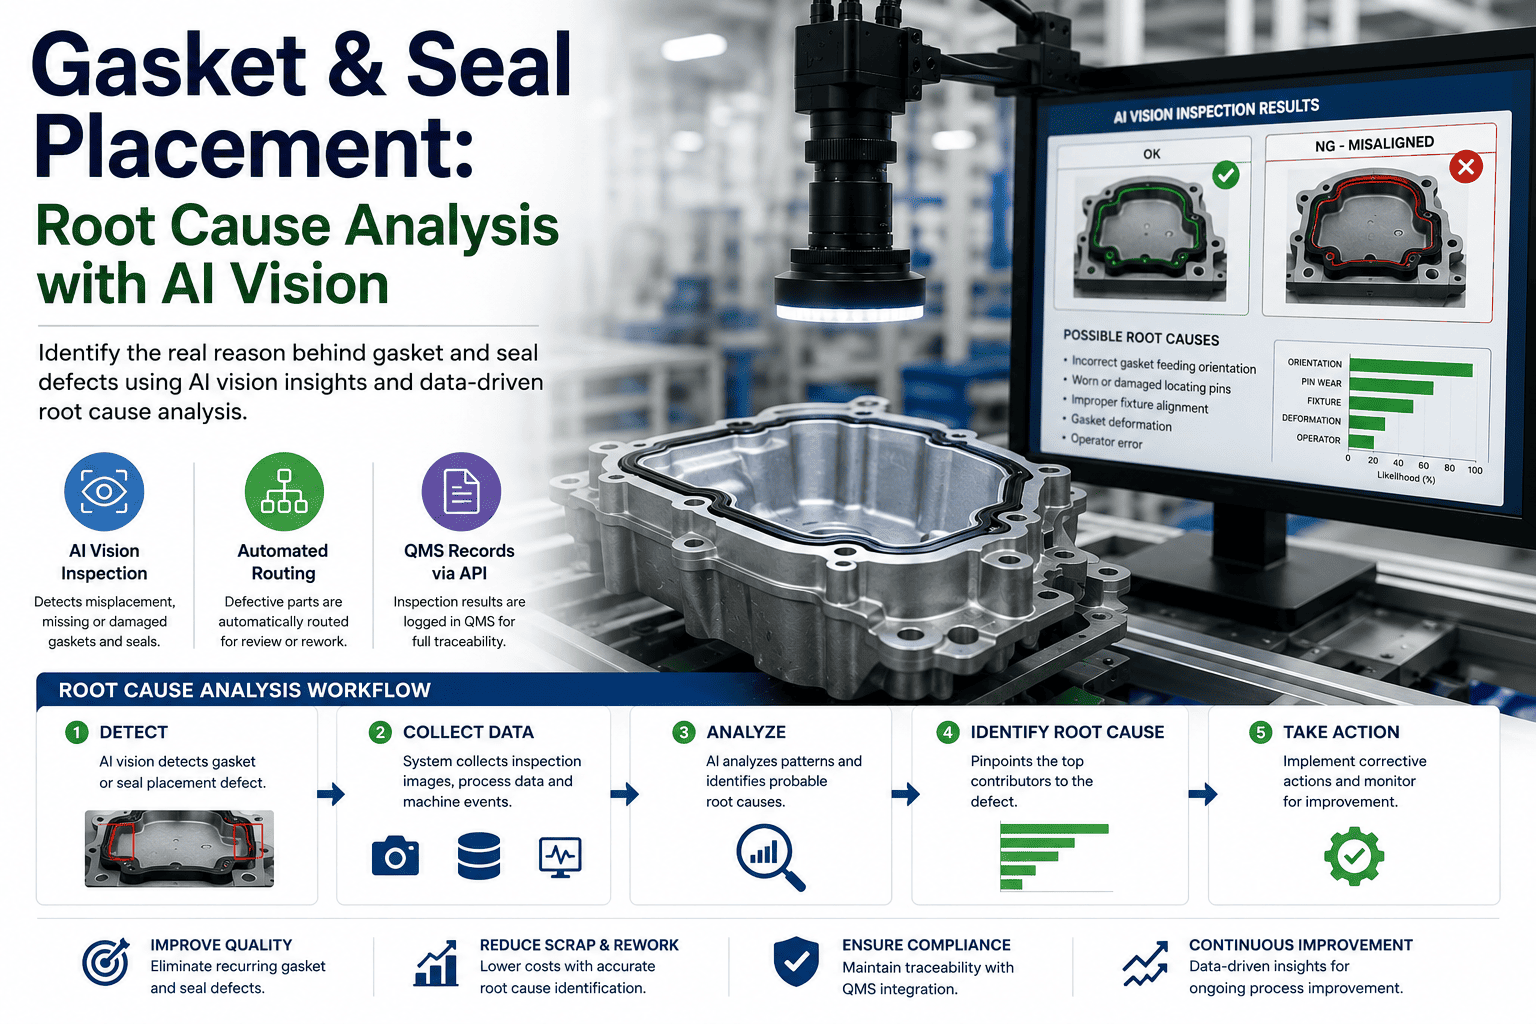
Gasket & Seal Placement: Root Cause Analysis with AI Vision
Detect placement deviations at line speed, contain them in milliseconds via Level 2 PLC integration, and trace every defect back to its machine-setting origin — all on-prem, inside your plant network.
Understanding Gasket & Seal Placement Failures
A seal placement defect is any deviation between the intended geometry of a gasket, O-ring, or dispensed bead and its actual position on the part. On sealed housings and enclosures, these defects cluster into four failure modes, each with a distinct physical origin and a distinct signature under structured light.
Offset / Misregistration
The gasket sits parallel to its groove but shifted laterally. Root cause: robot teach-pendant drift, worn locating pins, or fixture clamp-force variation across part variants.
Bead Gap / Discontinuity
A dispensed RTV or form-in-place gasket has a visible break. Root cause: valve clog, low material pressure, or viscosity drift from temperature change in the dispense drum.
Twist / Kink
An O-ring or pre-formed gasket rotates out of its seat. Root cause: installation tooling misalignment, static charge on the elastomer, or insufficient lubrication during assembly.
Missing Segment
A section of the gasket is entirely absent. Root cause: feeder empty, pick-and-place vacuum loss, or a broken pre-form that passed an upstream check.
Want a feasibility read on your specific failure mode? Book a 30-minute evaluation — send us parts or images and we will return a detection-confidence estimate.
Why Manual and Rule-Based Inspection Miss Them
Manual inspection on a 60-parts-per-minute line gives an operator roughly 0.8 seconds per housing. Sustained detection of a 0.3 mm offset under fluorescent lighting degrades sharply after the first two hours of a shift. Rule-based vision systems — edge detection, blob analysis, template matching — handle the easy cases but fracture when part color, mold flash, or lighting drifts by even 15%.
Imaging Setup That Works
Detection quality is bounded by image quality. A model cannot learn what the sensor never captured. For gasket and seal placement on metal housings, the dominant imaging challenge is specular reflection off machined or cast surfaces — it washes out the gasket edge and creates false-positive blobs. The setup below is what we deploy on sealed-assembly lines.
AI Model Training and Validation
A gasket-placement model is only as good as the labeled data behind it. The goal is not maximum accuracy on a clean test set — it is a confusion matrix that holds up across part variants, shift lighting, and the long tail of rare-but-critical failure modes. Below is the data pipeline and the realistic benchmarks we deliver.
Collect
2,000–5,000 images spanning all part variants, both shifts, and at least 3 lighting states. Include 15% near-boundary cases.
Label
Polygon segmentation masks for each gasket segment. Severity tags: offset distance, gap width, twist angle. Dual-annotator agreement check.
Train
Transfer learning from a COCO-pretrained backbone. Fine-tune on plant data for 80–120 epochs with focal loss to up-weight rare failure classes.
Validate
Hold-out set of 400+ images never seen in training. Measure per-class F1, not just mAP. Acceptance gate: F1 above 0.95 on critical classes.
Validation Confusion Matrix — Sealed Housing Line
Diagonal = correct predictions. Off-diagonal = misclassifications. Overall F1: 0.982. No critical-class misses (missing segment never misclassified as OK).
Containment: Stop, Route, Record
Detection without automated containment is just expensive photography. When the model fires, the inference result is pushed to the Level 2 PLC/DCS in under 12 milliseconds. The part is routed — good parts proceed, borderline parts divert to rework, hard failures drop to scrap — and a QMS record is created via API with the image, severity score, and disposition. No operator keystrokes. No paper traveler.
Good Part
Proceeds on main conveyor. No action. Image archived for drift monitoring.
Borderline
Diverts to rework station. Operator reviews on screen. Reworked part re-inspected on next cycle.
Hard Fail
Drops to scrap chute. PLC fires diverter arm. QMS record auto-created with full image trace.
Event Timeline — Detection to Disposition
Total elapsed: 52 ms from trigger to QMS record committed. All four steps complete before the part reaches the diverter gate at 1.2 m/s belt speed.
Root Cause Analysis from Production Data
A detection event is a symptom. The root cause lives in the machine data: PLC tags for clamp force, dispense pressure, robot position, and mold temperature. iFactory captures those tags at the exact defect timestamp and correlates them across the production history. When offset defects spike at 14:30 on die-cast housing line B, the system surfaces that dispense-valve pressure drifted 0.4 bar below setpoint — not after a shift-end report, but within minutes.
Defect Rate vs. Dispense Pressure — 8-Hour Shift
PLC Tags Captured at Defect Timestamp
| Tag | Setpoint | Actual | Deviation |
|---|---|---|---|
| Dispense pressure | 4.2 bar | 3.8 bar | -0.4 bar |
| Clamp force | 12.0 kN | 11.9 kN | -0.1 kN |
| Robot X position | 142.00 mm | 142.03 mm | +0.03 mm |
| Mold temp | 185 C | 184 C | -1 C |
| Cycle time | 0.92 s | 0.93 s | +0.01 s |
Flagged row: dispense pressure deviation correlates with the 14:00–14:30 defect spike. iFactory surfaces this automatically — no manual data export or spreadsheet pivot required.
Need this kind of traceability on your line? Talk to Support about retrofitting iFactory AI onto your existing sealed-assembly station.
Benchmarks and Pilot Scoping
Realistic benchmarks matter. Below is what we deliver on sealed-housing gasket placement, and what a pilot looks like end to end. The numbers are from production deployments, not lab conditions.
Production Benchmarks — Sealed Housing Gasket Placement
Pilot Roadmap — 6 to 12 Weeks
Feasibility & Data Capture
Ship 20–50 sample parts (good + defective). We image them in our lab, label, and return a detection-confidence report. If F1 is below 0.90 on your samples, we tell you before you commit.
On-Station Deployment
Camera, lighting, and NVIDIA GPU inference box retrofitted to your existing line. No line stoppage required — installed during a single maintenance window. PLC integration for divert commands.
RCA & QMS Integration
PLC tag capture at defect time. API integration to your QMS (SAP, Windchill, or custom). Widgets deployed to existing dashboards. Shift-end RCA reports auto-generated.
Why iFactory AI, Not a Point Camera
On-prem NVIDIA GPU inference retrofitted to existing lines. ERP, MES, and QMS identity and records via API. PLC tags captured at defect time for automated RCA. Widgets that display results in any existing portal. One system, not a stack of disconnected point tools.
Standalone vision box. Detection only. No PLC correlation. No QMS records. No root-cause traceability. Operator reads a screen and decides manually. Data dies in the camera's local storage.
Frequently Asked Questions
Can AI vision detect gasket placement on dark or reflective metal housings?
Yes. The key is lighting, not the model. We use cross-polarized diffuse dome illumination to eliminate specular reflection off polished or cast aluminum. Once the image is clean, the CNN resolves placement to within 0.3 mm consistently. If your housing is chrome-plated or mirror-finish, we will test it in our lab before committing.
How many images do we need to provide for training?
Typically 2,000–5,000 images covering all part variants and at least three lighting states. About 15% should be defective or near-boundary cases. If you do not have enough defect images, we can use augmentation and synthetic generation to close the gap, but real defect samples always produce a stronger model.
Does the system run inside our plant network, or in the cloud?
On-prem. The NVIDIA GPU inference box sits on your line, inside your plant network. No images leave your facility. The only outbound traffic is optional API calls to your QMS or ERP if those systems are hosted externally. This is critical for ITAR, proprietary part designs, and air-gapped production environments.
How does the system handle a new part variant added to the line?
You capture 200–300 images of the new variant (good parts only for the first batch), label them, and trigger a fine-tuning run. The model updates in under 2 hours on the on-prem GPU. No full retraining needed — transfer learning from the existing weights adapts to the new geometry quickly.
What happens if the model confidence drops during production?
The system monitors its own confidence distribution in real time. If the mean confidence drops below a configured threshold — typically due to lighting drift or a new part variant — it raises an alert and automatically routes all subsequent parts to the borderline (rework) path until an engineer acknowledges the drift and re-validates.
Can we send parts or images for a feasibility evaluation before committing?
Yes. Ship us 20–50 sample parts spanning good and defective units, or send high-resolution images. We will image them, run a quick-label training pass, and return a detection-confidence report within 5 business days. If the F1 score on your samples is below 0.90, we will tell you upfront and explain what imaging changes would close the gap.
Send Us Your Parts. Get a Feasibility Read.
Ship 20–50 sample housings or send high-resolution images. We will run a detection-confidence evaluation and return a report within 5 business days — no commitment, no cost for the initial assessment.