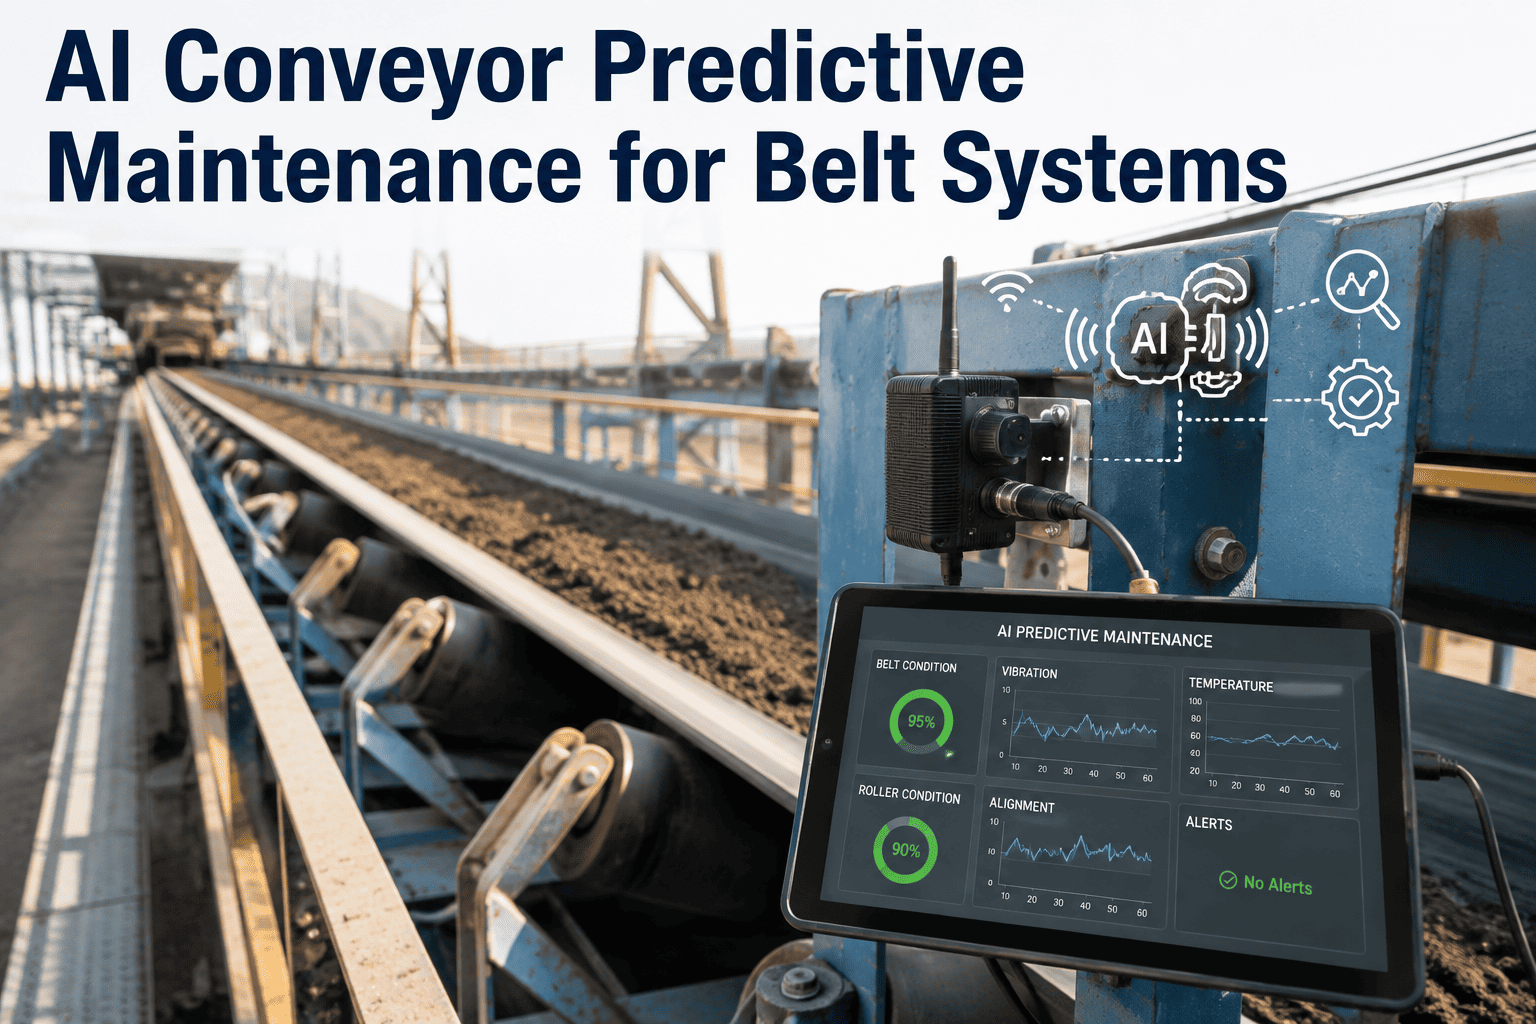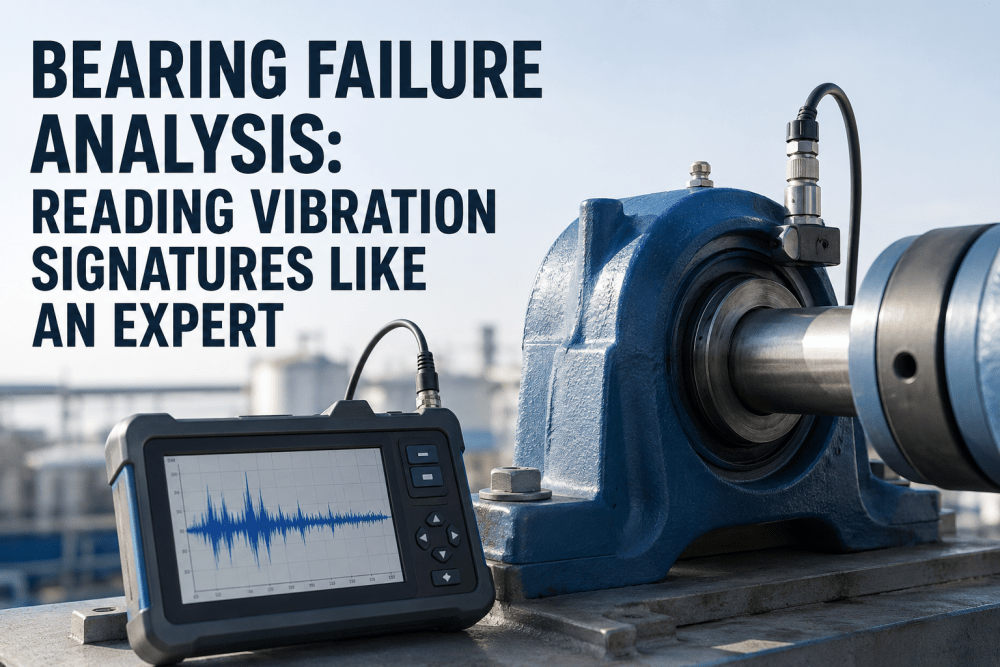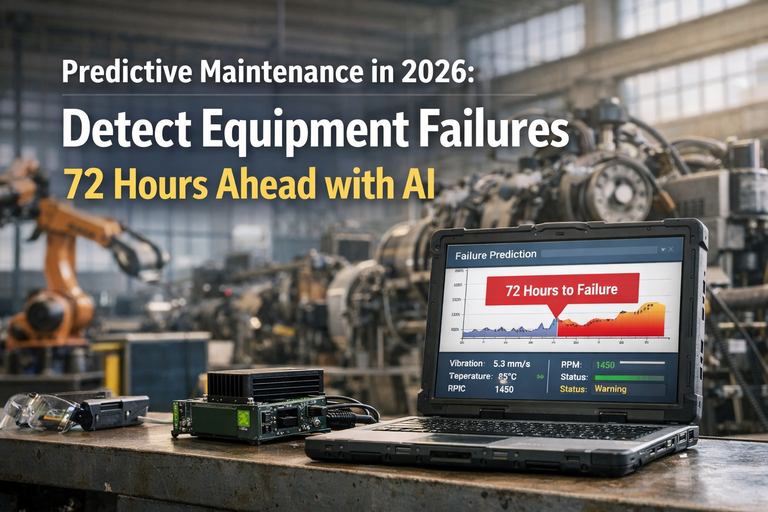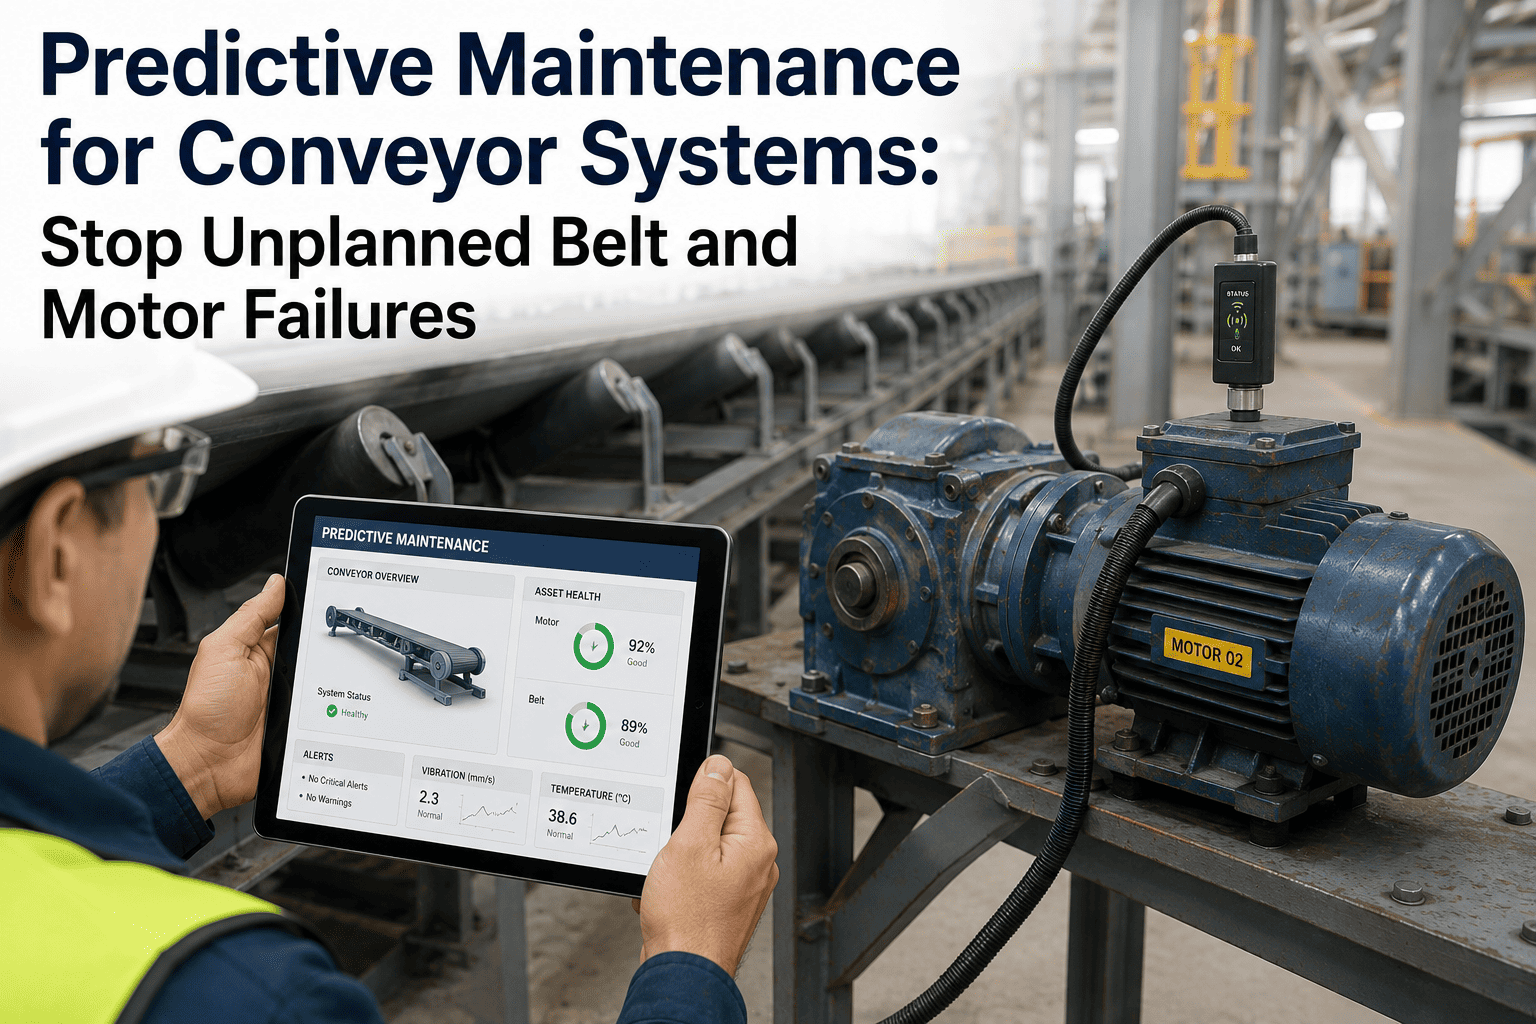
A belt conveyor running at 3.2 metres per second doesn't fail in an instant. The failure begins three weeks earlier, as a single roller bearing on the return strand starts throwing high-frequency harmonics into the vibration spectrum — a 6 kHz crest that a handheld stethoscope would never catch. By the time the bearing seizes, the belt has already mistracked 18 millimetres, the drive motor is pulling 14% over nameplate current, and the gearbox oil has crossed 78°C. iFactory's predictive maintenance system reads those signatures from continuous sensor data and forecasts the failure weeks before it reaches the floor — then writes the work order itself.
Forecast belt, roller and drive failures weeks before they stop the line
Vibration, motor-current and thermal data from every conveyor asset — processed on an on-prem NVIDIA AI server inside your plant network. No data leaves the building.
Where conveyor systems fail — and why
Conveyors fail along a small, well-characterised set of modes. Each one leaves a signature in the data long before the mechanical symptom appears. The chart below maps the four dominant failure modes against how early each becomes detectable in continuous sensor streams versus when it actually causes a stoppage.
Bearing wear and gearbox thermal rise are the longest-lead modes — they announce themselves in vibration and temperature data nearly a month ahead. Motor current drift is shorter because the electrical signature often only becomes pronounced once mechanical drag has already developed. Book a demo to see the detection windows on your conveyor inventory.
Why time-based PM misses it
Time-based preventive maintenance assumes failure is a function of calendar hours. Conveyor components don't wear on a schedule — they wear as a function of load, tonnage, dust ingress, ambient temperature, and start-stop frequency. Two identical rollers on the same belt can differ in service life by a factor of four.
- Miss Bearing fails between PM intervals — 9 days before next scheduled inspection
- Waste Healthy rollers replaced at calendar interval regardless of condition
- Blind No visibility into tonnage-driven acceleration of wear between checks
- Catch Bearing wear detected 28 days before failure — work order auto-issued at Wk -2
- Save Only assets approaching threshold are flagged for service
- Track RUL estimate updates every shift as tonnage and temperature shift
Sensing setup and data sources
Predictive coverage requires four complementary data streams. Each one captures a failure signature the others miss. The table below maps every sensor type to the failure modes it detects, its sample rate, and where the signal lives in your existing architecture.
| Sensor / source | Failure modes covered | Sample rate | Signal path | Latency to model |
|---|---|---|---|---|
| Tri-axial accelerometer on roller bearings and gearbox housing | Bearing wear (BPFO/BPFI), gear tooth pitting, shaft imbalance | 25.6 kHz continuous | Edge gateway to on-prem AI server | < 2 s |
| Motor current transducer (3-phase CT on drive motor) | Motor current drift, stator fault, mechanical load increase | 10 kHz per phase | MCC to PLC to AI server | < 1 s |
| PT100 / thermocouple on gearbox oil sump and motor windings | Gearbox overheating, lubricant degradation, motor overload | 1 Hz | PLC analog input to AI server | < 5 s |
| Belt-tracking laser displacement at head and tail pulley | Belt mistracking, pulley misalignment, idler jam | 50 Hz | Direct to AI server via OPC UA | < 3 s |
The entire data path stays inside the plant network. The on-prem NVIDIA AI server ingests sensor streams from your existing PLC and SCADA — no new cabling to the cloud, no data egress. The only outbound signal is the work order written to your CMMS.
The predictive model and RUL estimates
The model fuses vibration spectra, motor current RMS, thermal slope and tracking displacement into a per-asset health index that decays toward zero. When the index crosses a confidence band, the system estimates Remaining Useful Life (RUL) in operating hours and assigns a risk tier. The gauge below shows a live snapshot for four assets on a single conveyor line.
RUL confidence narrows as the health index drops. A bearing at 84% health has a wide prediction interval (plus or minus 300 hours); the same bearing at 18% has a tight interval (plus or minus 8 hours) because the wear signature is no longer ambiguous.
From detection to auto work order
When an asset crosses its risk threshold, the system doesn't just raise an alert. It compiles the evidence — which sensor, which frequency band, what trend slope — and writes a structured work order into your CMMS with the parts, tools and procedure pre-filled. The sequence below shows the five-stage pipeline.
Root cause from production data
A failure signature is only half the answer. The other half is why the wear accelerated. iFactory correlates the detected fault with production variables — tonnage spikes, start-stop frequency, ambient temperature, dust loading — to pinpoint the root cause. The heatmap below shows how production conditions map to failure acceleration across four detected incidents.
The B-12 bearing failure correlates most strongly with tonnage spikes and dust contamination — not with start-stop frequency. That tells the maintenance planner the root cause is material loading, not operator behaviour, and the fix includes a dust seal upgrade rather than just a bearing swap.
Rollout roadmap and benchmarks
iFactory deploys in three phases over 6 to 12 weeks. The pre-configured NVIDIA AI server arrives racked and ready — your team provides the sensor list and PLC tag map, and we handle model training against your historical data. The roadmap below shows what happens in each phase and where the benchmarks land.
- Pre-configured NVIDIA AI server racked in your server room
- PLC/SCADA tag map imported — vibration, current, thermal, tracking
- Historical sensor data backfilled (minimum 90 days)
- Baseline health index established per asset
- Failure-mode models trained on your historical incident log
- RUL estimation calibrated against known failure events
- Detection thresholds tuned per asset class
- CMMS integration tested — work order round-trip validated
- System live on all instrumented conveyors
- Operator dashboard and AI chat deployed to maintenance team
- First predictive work orders auto-created and fulfilled
- 99.9% uptime SLA active, quarterly model retrain scheduled
FAQ
Stop replacing bearings on a calendar. Start replacing them on evidence.
Book a 30-minute demo and we'll scope a predictive maintenance pilot on one of your conveyor lines — sensor list, PLC tag map, and expected detection windows included.