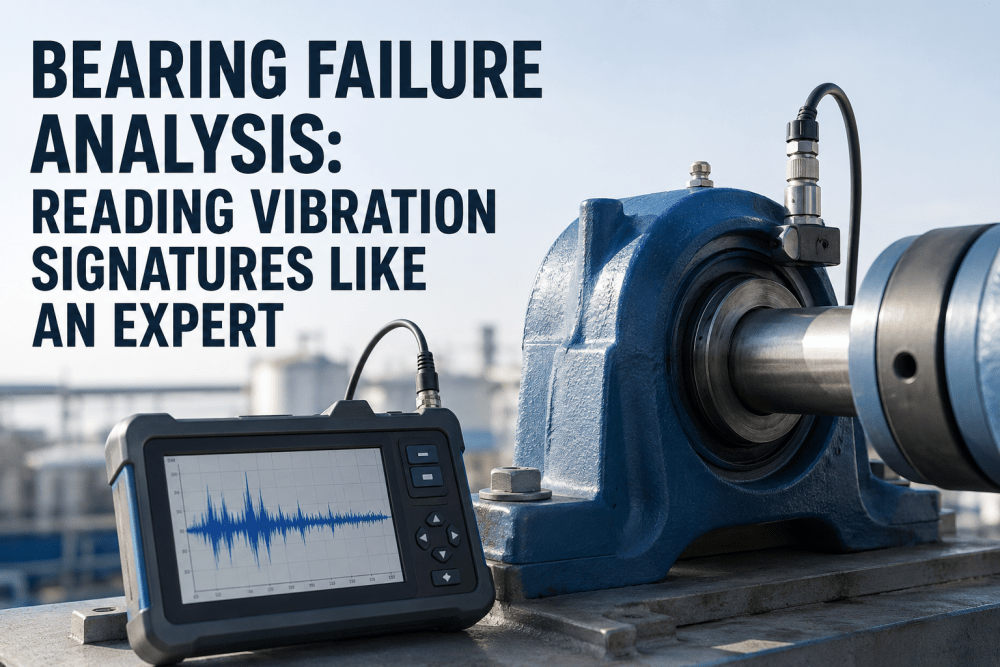
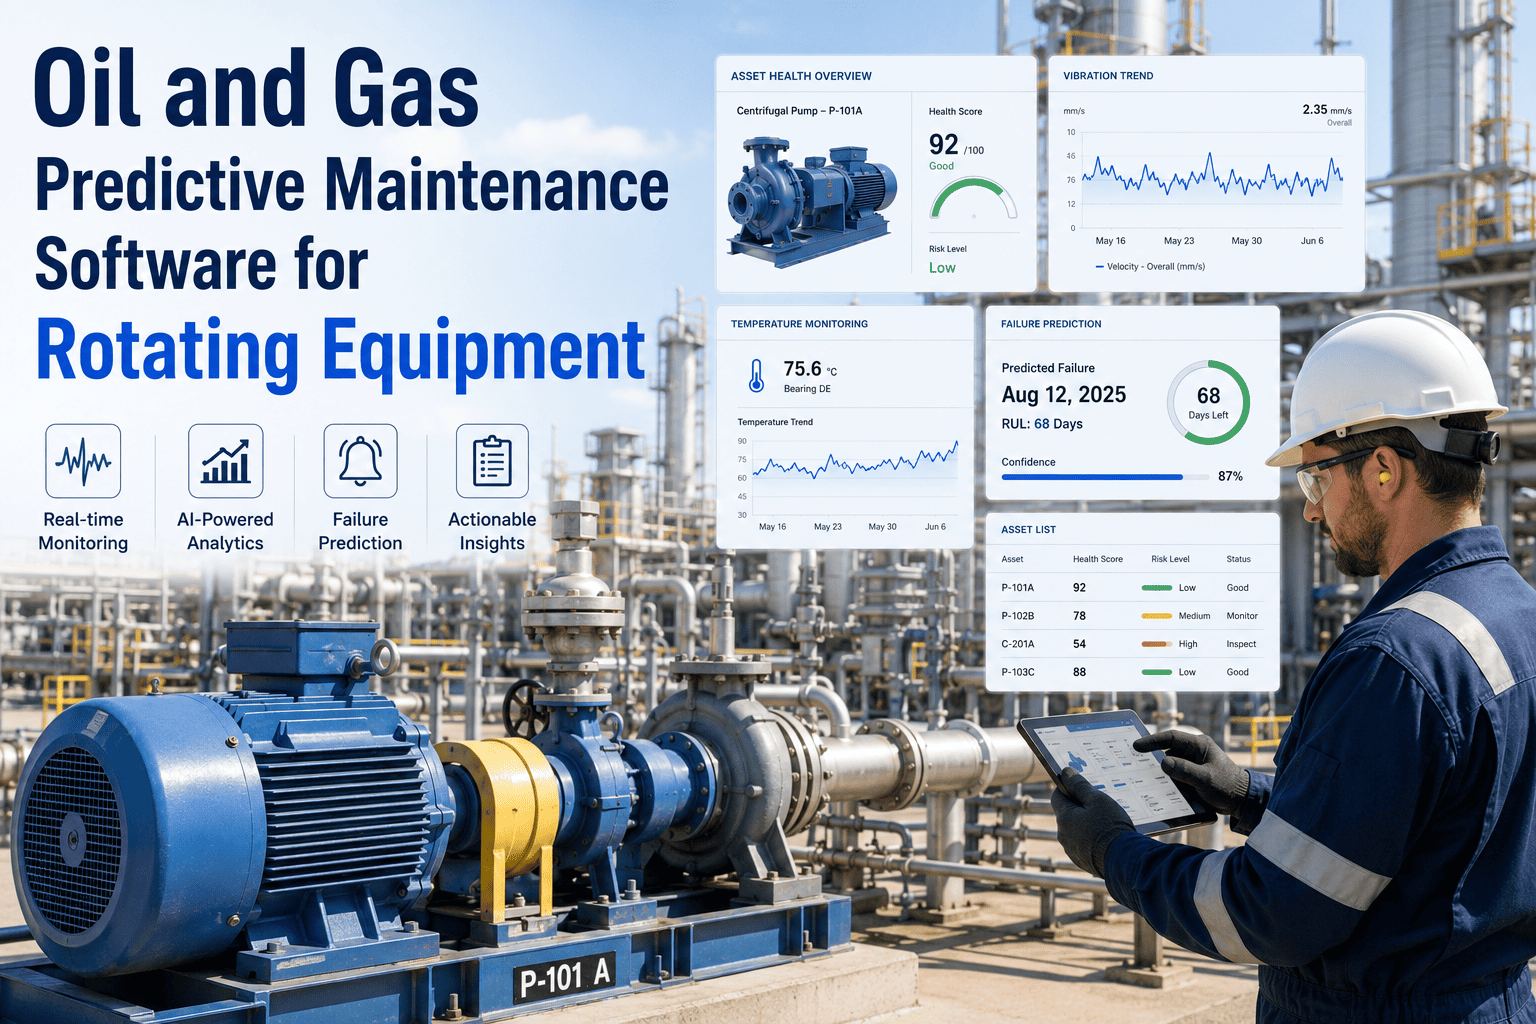
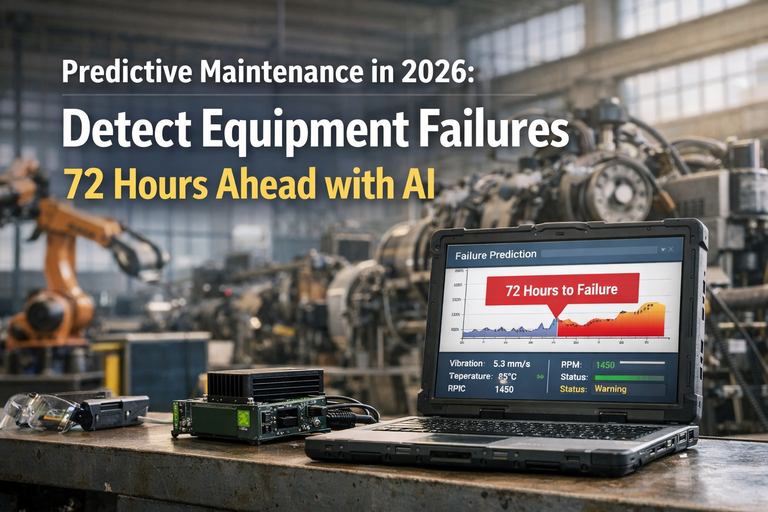
Bearing failures account for roughly 40–50% of all rotating equipment breakdowns — yet nearly every one of them announces itself weeks or months in advance through four mathematically predictable vibration frequencies. The problem isn’t detection; the problem is reading the signal before the bearing turns into shrapnel. Modern condition monitoring programs use BPFO, BPFI, BSF, and FTF — the four characteristic defect frequencies generated by rolling-element bearings — alongside envelope analysis, shock pulse measurement, and AI-driven trending to catch a developing fault while it’s still a sub-surface crack invisible to the human ear. iFactory’s Predictive Maintenance module operationalizes this exact workflow: accelerometer ingestion, FFT spectrum analysis, fault-frequency overlays, and AI severity scoring across every critical bearing in your plant. Book a predictive maintenance demo to see how vibration signatures become work orders before the failure hits.
40–50%
of rotating equipment failures caused by bearings
2–4 weeks
earlier detection with envelope analysis vs. standard FFT
20–60 kHz
ultrasonic range where Stage 1 defects first appear
4 stages
of bearing degradation, each with its own signature
The Four Bearing Defect Frequencies: What Each One Tells You
A rolling-element bearing has four components that can fail: the outer race, the inner race, the rolling elements themselves, and the cage that separates them. Each component, when defective, generates a specific repeating impact frequency tied to bearing geometry and shaft speed. These are the four signatures every vibration analyst learns to read first — because the frequency tells you exactly which part is degrading and roughly how far the damage has progressed.
BPFO
Ball Pass Frequency — Outer Race
BPFO = (Nb/2) × [1 − (Bd/Pd)cosø] × shaft speed
The rate at which rolling elements pass over a fixed point on the stationary outer race. This is the most common bearing defect mode — the outer race is stationary, so any defect sits in the load zone and gets hit on every revolution.
Signature pattern
Discrete peak at BPFO plus harmonics. No sidebands in classic outer-race defects since the defect doesn’t move through a varying load.
BPFI
Ball Pass Frequency — Inner Race
BPFI = (Nb/2) × [1 + (Bd/Pd)cosø] × shaft speed
The rate at which rolling elements strike a defect on the rotating inner race. Always higher than BPFO. As the defect rotates through the load zone, the impact amplitude modulates — producing the giveaway sideband pattern.
Signature pattern
BPFI peak with sidebands spaced at 1× running speed. The sidebands are how analysts distinguish inner race from outer race defects.
BSF
Ball Spin Frequency
BSF = (Pd/2Bd) × [1 − (Bd/Pd)2cos2ø] × shaft speed
The rate at which each rolling element spins on its own axis between the inner and outer raceways. A defect on a ball or roller strikes both races per revolution, producing complex vibration patterns.
Signature pattern
Often appears at 2×BSF since the defect strikes twice per ball revolution. Frequently shows FTF sidebands as the cage carries the defective element through the load zone.
FTF
Fundamental Train Frequency
FTF = (1/2) × [1 − (Bd/Pd)cosø] × shaft speed
The rotation rate of the cage that holds the rolling elements. A sub-synchronous frequency (lower than shaft speed) that indicates cage wear, breakage, or bearing-induced rotor instability.
Signature pattern
Low-amplitude peak below shaft speed. Often appears as a modulation envelope on BSF rather than as a clean discrete peak.
Quick approximations when geometry is unavailable
For standard deep-groove ball bearings with a 0° contact angle: BPFO ≈ 0.4 × Nb × shaft speed and BPFI ≈ 0.6 × Nb × shaft speed. These are reliable within roughly ±5% for most bearings and useful when manufacturer data isn’t at hand.
The Four Stages of Bearing Failure: When to Act
Bearings don’t fail overnight. They follow a predictable degradation path that climbs from ultrasonic stress waves invisible to standard sensors all the way to broadband random noise audible from across the plant floor. Reading the right frequency band at the right stage is the entire game — and Stage 3 is almost always the optimal intervention window: detectable in normal velocity spectra, but the machine is still running safely.
Sub-Surface Stress
Ultrasonic: 20–60 kHz
Sub-surface micro-cracks form. No vibration in standard velocity spectra. No audible noise, no temperature rise. Only ultrasonic techniques like shock pulse (SPM), PeakVue, or Spike Energy detect anything.
Action: Note the trend. Verify lubrication. No replacement yet.
Bearing Resonance Excited
High-frequency: 500–2000 Hz region
Small defects excite the bearing’s natural resonance. Envelope analysis and demodulation begin showing fault-specific energy. Sidebands start to appear around resonant peaks. Defect type becomes identifiable.
Action: Schedule replacement at next planned outage. Monitor weekly.
Discrete Fault Frequencies Visible
Low-frequency velocity spectrum: <1 kHz
Classic BPFO, BPFI, BSF, FTF peaks now visible in standard velocity spectra. Multiple harmonics appear. BPFI shows clear 1× running speed sidebands. Machine is fully operational but degrading visibly.
Action: Optimal replacement window. Plan immediate intervention.
Random Broadband Noise
Broadband: noise floor lifts
Severe spalling. Discrete fault frequencies disappear and are replaced by random broadband vibration that lifts the noise floor across the spectrum. Audible noise and heat now obvious. Secondary damage imminent.
Action: Stop the machine. Critical bearings should never reach Stage 4.
Want to see how Stage 1 ultrasonic detection looks in a real spectrum? Book a 30-minute demo and we’ll walk through actual case studies from production assets.
How to Actually Read a Vibration Spectrum
The math behind BPFO and BPFI is straightforward. The diagnostic skill is recognizing which pattern of peaks, harmonics, and sidebands corresponds to which fault — under conditions where shaft speed varies, multiple defects coexist, and process noise drowns out low-amplitude signals. Here’s the diagnostic logic every reliability engineer applies.
| Spectrum Observation |
Likely Fault |
Confirmation Technique |
| Peak at BPFO + 2–3 harmonics, no sidebands |
Outer race spall or pit |
Envelope analysis around bearing resonance |
| Peak at BPFI with 1× running speed sidebands |
Inner race defect |
Trend BPFI amplitude over weeks |
| Peak at 2×BSF with FTF sidebands |
Damaged rolling element |
Shock pulse for impact confirmation |
| Sub-synchronous peak below 1× shaft speed |
Cage wear or breakage |
Look for FTF modulation on BSF |
| Broadband noise floor lifted, no discrete peaks |
Stage 4 — severe spalling |
Stop machine. Visual inspection. |
| High-frequency energy rising, no low-freq peaks |
Stage 1 sub-surface cracks |
PeakVue, Spike Energy, or SPM |
| Multiple harmonics of BPFO & BPFI both present |
Severe wear across multiple components |
Plan immediate replacement |
The Diagnostic Workflow: From Sensor to Work Order
Catching a developing bearing fault isn’t one measurement — it’s a closed loop that runs continuously on every critical asset. Here’s how the workflow runs inside iFactory’s Predictive Maintenance module, from raw accelerometer data to the work order that hits the maintenance scheduler.
1
Data Acquisition
Accelerometers mounted near bearing housings sample at 25.6 kHz or higher. Wired or wireless sensors stream to edge gateways. Sampling rate, bandwidth, and frequency resolution are tuned per asset.
2
FFT & Envelope Processing
Time-domain waveform converted to frequency spectrum via Fast Fourier Transform. Envelope demodulation isolates high-frequency impacts modulating bearing resonance — the technique that buys 2–4 extra weeks of warning.
3
Fault Frequency Overlay
Bearing database (SKF, FAG, NSK, NTN, Timken) provides geometry. iFactory calculates BPFO, BPFI, BSF, FTF per asset and overlays them on the spectrum. Cursor matching highlights any peak within tolerance.
4
AI Severity Scoring
Trend models flag rising harmonic amplitudes, sideband emergence, and stage progression. AI compares against baseline and peer assets to assign severity 1–4 and predict remaining useful life.
5
Auto Work Order
At Stage 3 detection, a work order is auto-generated with the failure mode, recommended replacement window, required parts from inventory, and CMMS routing to the right technician.
Turn Vibration Data Into Action, Not Reports
iFactory’s Predictive Maintenance module ingests accelerometer streams, overlays BPFO/BPFI/BSF/FTF, scores severity with AI, and routes work orders automatically — so reliability engineers spend time fixing problems, not chasing peaks across spreadsheets.
How iFactory Operationalizes Bearing Failure Analysis
Knowing the four defect frequencies is reliability engineering 101. Scaling that knowledge across hundreds of bearings on dozens of critical assets — without missing the one that’s about to drop a $2M production line — is what separates a vibration program from a vibration spreadsheet. Here’s what the Predictive Maintenance module brings to that scale problem.
Continuous FFT & Envelope Analysis
Both standard FFT spectra and envelope-demodulated spectra computed continuously per asset. No more waiting for a monthly route walk to catch a Stage 2 fault.
Pre-Loaded Bearing Database
BPFO, BPFI, BSF, and FTF pre-calculated for tens of thousands of bearing models. Drop in the bearing designation — the fault frequencies overlay automatically on every spectrum.
Stage-Based Severity Scoring
AI maps each asset to its bearing failure stage (1–4) based on harmonic patterns, sideband emergence, and trended energy bands — not just amplitude thresholds.
Work Order Auto-Routing
Stage 3 detection auto-generates a CMMS work order with failure mode, recommended action, parts checklist, and the historical context the technician needs on arrival.
Digital Twin Integration
Bearing health feeds into the asset’s digital twin, where remaining useful life predictions inform maintenance scheduling, spares planning, and capital replacement budgeting.
Cross-Asset Pattern Learning
AI learns from every fault diagnosed across your fleet. A BPFI signature on one pump improves Stage 2 detection accuracy on every similar pump in the plant.
Curious how this maps to your specific assets and bearing fleet? Book a tailored demo with our predictive maintenance team.
Expert Perspective
"The most expensive bearing failures we investigate aren’t the ones nobody saw coming — they’re the ones where the spectrum was screaming Stage 3 for six weeks and nobody opened the right report. Discrete BPFO harmonics with rising amplitude is the easiest fault pattern in rotating machinery to diagnose, and it’s also the one most often ignored because reliability teams are drowning in data they can’t triage. The shift to AI-scored severity and auto-routed work orders isn’t about replacing the analyst — it’s about making sure the Stage 3 signature actually reaches the person who can act on it before Stage 4 arrives."
— Reliability Engineering Practice, 2026 industry insight
5–10 mo
typical advance warning from Stage 1 ultrasonic detection
~±5%
accuracy of BPFO/BPFI approximations for standard bearings
3+
harmonics typically trigger immediate replacement planning
Conclusion: The Frequency Was Always There
Every bearing that fails catastrophically was generating its own warning signal for weeks or months before the breakdown. The four characteristic frequencies — BPFO, BPFI, BSF, and FTF — aren’t exotic diagnostic techniques; they’re basic physics tied to bearing geometry and shaft speed, and every modern vibration sensor captures them. The hard part has never been detection. The hard part is making sure the right signal reaches the right person at the right stage — ideally Stage 3, when the fault is unambiguous but the machine is still safe to run to a planned outage. That’s the gap iFactory’s Predictive Maintenance module closes: continuous FFT and envelope analysis, pre-loaded bearing databases, AI severity scoring, and auto-routed work orders, all running on the assets that matter most to production.
Stop Reading Spectra. Start Acting on Them.
Get a 30-minute walkthrough of how iFactory’s Predictive Maintenance module turns BPFO, BPFI, BSF, and FTF signatures into prioritized work orders — mapped to your actual asset fleet.
Frequently Asked Questions
What is the difference between BPFO and BPFI in vibration spectra?
BPFO (Ball Pass Frequency Outer race) and BPFI (Ball Pass Frequency Inner race) both describe how often rolling elements strike a defect, but they behave very differently in the spectrum. BPFO is always the lower of the two frequencies, and because the outer race is stationary, an outer race defect produces a clean discrete peak with harmonics but typically no sidebands. BPFI is always higher, and because the inner race rotates, the defect moves through the load zone once per shaft revolution — producing amplitude modulation that shows up as classic sidebands spaced at 1× running speed around the BPFI peak. The sideband pattern is the single most reliable way to distinguish inner-race from outer-race defects in a real-world spectrum.
Why is Stage 3 considered the optimal bearing replacement window?
Stages 1 and 2 detect faults so early that you can’t reliably predict when failure will occur — bearings can sit in Stage 2 for months. Stage 4 is too late: discrete fault frequencies have already disappeared into broadband noise, secondary damage to shafts and housings is imminent, and emergency intervention is the only option. Stage 3 is the sweet spot. The defect frequencies are unambiguous in standard velocity spectra, harmonic counts give a clear severity read, the machine is still operable safely, and the failure timeline is short enough (typically 1–4 weeks) to justify scheduling immediate planned maintenance. Replacing at Stage 3 captures most of the bearing’s useful life while avoiding catastrophic failure costs.
Can vibration analysis detect bearing faults on slow-speed equipment?
Yes, but standard FFT-based vibration analysis struggles below about 100 RPM because impact energy at low speeds is too weak to rise above process noise in conventional spectra. For slow-speed equipment — agitators, slow-rotating gearboxes, large fans — reliability programs typically combine three techniques. Envelope analysis (demodulation) isolates the high-frequency impacts even when shaft speed is low. Ultrasonic methods like Shock Pulse Monitoring or PeakVue detect the stress waves generated by metal-to-metal contact regardless of shaft speed. And temperature trending plus oil analysis provide supporting evidence. iFactory’s module supports all three signal types so slow-speed assets get the same Stage 1–4 framework as high-speed ones.
How does envelope analysis improve early bearing fault detection?
Standard FFT analysis looks at the raw vibration signal across the full frequency range. In Stages 1 and 2 of bearing failure, the actual defect impact energy is tiny and gets buried under process noise and low-frequency vibration from imbalance, misalignment, and other sources. Envelope analysis (also called amplitude demodulation) takes a band-pass filtered slice of the spectrum around the bearing’s resonant frequency — typically a few hundred Hz to a few kHz — and extracts the modulation envelope of that signal. Because bearing defect impacts excite the bearing resonance, this technique amplifies the repetitive defect impact pattern while filtering out everything else. The result is that BPFO, BPFI, BSF, and FTF signatures emerge clearly in the envelope spectrum 2–4 weeks before they appear in the standard velocity spectrum — a critical lead time for planning maintenance.
What happens if you can’t find the bearing’s geometry to calculate fault frequencies?
For most reliability programs this isn’t an issue — modern vibration analysis software, including iFactory’s Predictive Maintenance module, ships with pre-calculated fault frequencies for tens of thousands of bearing models from SKF, FAG, NSK, NTN, Timken and other major manufacturers. The bearing designation is enough to populate BPFO, BPFI, BSF, and FTF automatically. For old, custom, or uncommon bearings where exact geometry is unavailable, two reasonable approximations work for standard deep-groove ball bearings with a roughly 0° contact angle: BPFO ≈ 0.4 × number of balls × shaft speed, and BPFI ≈ 0.6 × number of balls × shaft speed. These are accurate within about ±5%, which is usually close enough to identify a fault peak when it appears in the spectrum. When precision matters, parameters can also be estimated from measured outer diameter, inner bore, and bearing width.