Predictive maintenance in cement plants delivers 300-500% ROI within 12-18 months—yet only 15% of plants have implemented it. The math is simple: ₹3-5 crore investment prevents ₹15-25 crore in annual failures, downtime, and maintenance waste. A typical 3,000 TPD plant saves ₹8-12 crore yearly through early failure detection, optimized maintenance schedules, and extended asset life. Leading plants like UltraTech and Ambuja report payback periods of 3-6 months. This guide provides concrete ROI calculations, real plant examples and a step-by-step framework to justify predictive maintenance investment. Calculate your plant's ROI to see specific returns, or continue reading.
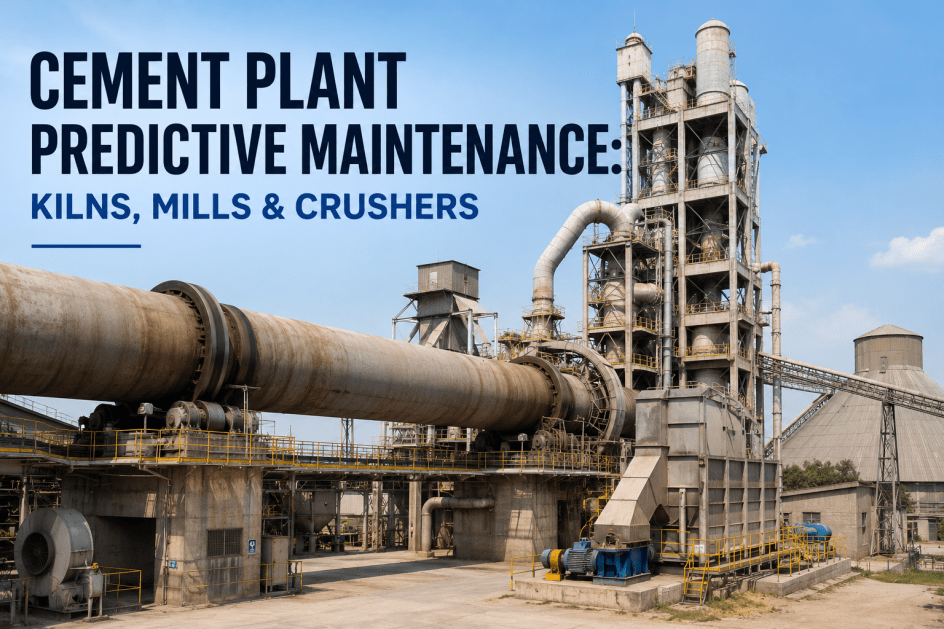
ROI of Predictive Maintenance in Cement Manufacturing
Calculate Returns, Reduce Failures & Optimize Maintenance Costs
The Business Case for Predictive Maintenance
Three Revenue Streams from Predictive Maintenance
1. Prevent Downtime (60%)
Eliminate major failures: Predict kiln, mill, crusher issues 2-6 weeks early
Value: Prevent 2-3 failures worth ₹5-15 crore each = ₹10-25 crore saved
ROI driver: Single prevented kiln failure pays for entire system
2. Optimize Maintenance (25%)
Reduce waste: Maintain only when needed, not on fixed schedules
Value: Cut maintenance costs 25-35% = ₹4-6 crore annually
ROI driver: Eliminate unnecessary interventions, reduce inventory
3. Extend Asset Life (15%)
Prolong equipment: Optimal operating conditions extend life 15-25%
Value: Defer ₹8-12 crore CAPEX, reduce replacement frequency
ROI driver: Better asset utilization, lower depreciation. See full calculation.
Traditional maintenance either over-maintains (wasting ₹4-6 crore annually) or under-maintains (causing ₹10-25 crore in failures). Predictive maintenance eliminates both wastes—maintaining exactly when needed. This dual benefit drives 300-500% ROI compared to single-benefit improvements.
ROI Calculation Framework
Step-by-Step ROI Formula
Calculate Investment
Equipment: Sensors, software, cameras = ₹2-3 Cr
Implementation: Installation, integration = ₹80-120 L
Training: Technician certification = ₹20-30 L
Total: ₹3-5 Cr one-time
Calculate Annual Value
Downtime prevented: 400-600 hrs × ₹10L/hr = ₹4-6 Cr
Maintenance optimized: 30% × ₹15 Cr = ₹4.5 Cr
Asset life extended: ₹1-2 Cr/year
Total: ₹9.5-14.5 Cr/year
Compute ROI
Formula:
ROI = (Annual Value - Investment) ÷ Investment × 100%
Example:
(₹12 Cr - ₹4 Cr) ÷ ₹4 Cr = 200% Year 1
Payback: 4 months. Get custom model.
Calculate Your Plant's Predictive Maintenance ROI
Custom ROI analysis based on your plant size, equipment age, current downtime. See exact investment, returns, and payback period.
Investment Breakdown
What Does Predictive Maintenance Cost?
Vibration Monitoring
Cost: ₹1.2-1.8 Cr
Covers: 30-40 critical machines (mills, crushers, fans)
Payback: Prevents 1 mill failure (₹7-10 Cr)
Thermal Imaging
Cost: ₹8-12 L
Covers: Cameras, training, inspection routes
Payback: Prevents 1 kiln failure (₹12-18 Cr)
Oil Analysis
Cost: ₹25-40 L/year
Covers: Monthly sampling, lab analysis, trending
Payback: Extends gearbox life 30-40%
Digital CMMS
Cost: ₹80-120 L
Covers: Software, integration, mobile apps
Payback: Reduces MTTR 30-40% (saves 50+ hrs/month)
Predictive Analytics
Cost: ₹60-90 L
Covers: AI platform, algorithms, dashboards
Payback: Optimizes maintenance 25-35%
Total Investment: ₹3-5 Crore
One-time CAPEX spread over 6-12 months implementation. Ongoing costs minimal (₹30-50 lakh/year for consumables, licenses). System life 5-7 years. This means ₹3-5 Cr investment delivers ₹50-100 Cr total value over system life.
Need help prioritizing investments? Our ROI specialists can build phased approach — Start with highest-return items first.
Annual Value Generation
How Predictive Maintenance Creates Value
Downtime Prevention
Eliminate 400-600 hours unplanned downtime annually
400 hrs × ₹10 lakh/hr = ₹4 Cr minimum
Plus prevent 1-2 major failures worth ₹7-18 Cr each
Maintenance Optimization
Reduce maintenance costs 30% through condition-based approach
₹15 Cr annual maintenance × 30% = ₹4.5 Cr
Plus ₹1-2 Cr inventory reduction
Asset Life Extension
Extend equipment life 20% through optimal operation
Defer ₹50 Cr replacement CAPEX by 2-3 years
NPV benefit ₹1-2 Cr annually. See calculation.
Energy & Quality
Secondary benefits: Equipment runs at peak efficiency
Energy savings 3-5% = ₹60-100 L
Quality improvement reduces rework ₹40-60 L
Conservative estimate for 3,000 TPD plant. Actual value depends on current downtime, maintenance practices, equipment age. Plants with poor reliability see higher returns (₹15-20 Cr). Well-maintained plants still achieve ₹8-12 Cr through optimization.
Phased Implementation ROI
Returns by Implementation Phase
Phase 1: Pilot (3 months)
₹80-120 LInvestment: Monitor 5-8 critical assets (kiln, main mill)
Quick wins: Prevent 1 failure = ₹3-8 Cr value
ROI: 400-900% in first 3 months
Purpose: Prove concept, build confidence
Phase 2: Expand (6 months)
₹1.5-2.5 CrInvestment: Scale to 30-40 assets, add predictive analytics
Value: Full downtime prevention ₹6-10 Cr
ROI: 300-500% cumulative
Purpose: Systematic coverage of critical equipment
Phase 3: Optimize (12 months)
₹3-5 CrInvestment: Complete system, secondary equipment, automation
Value: ₹12-18 Cr annual (all benefits)
ROI: 300-450% sustained
Purpose: Mature predictive culture, continuous improvement. Get phased plan.
Faster payback: See returns in 3-6 months vs 12-18 months full deployment. Lower risk: Prove value before major investment. Learning curve: Build expertise gradually. Budget flexibility: Spread CAPEX over 2-3 fiscal years. Most successful implementations start with 5-10 critical assets, achieve quick wins, then expand based on proven ROI.
See Your Plant's Phased ROI Roadmap
Custom implementation plan showing investment, returns, and payback for each phase. Start small, prove value, scale systematically.
Real Plant ROI Examples
Three Different Plant Profiles
3,000 TPD Plant (North India)
- Investment: ₹3.8 Cr (12 months)
- Downtime reduced: 820hr → 340hr
- Maintenance cost: ₹18 Cr → ₹12.5 Cr
- Annual value: ₹10.8 Cr
- ROI: 284% | Payback: 4.2 months
5,000 TPD Plant (Gujarat)
- Investment: ₹6.2 Cr (15 months)
- Downtime reduced: 1,100hr → 420hr
- Maintenance cost: ₹28 Cr → ₹18 Cr
- Annual value: ₹22.5 Cr
- ROI: 363% | Payback: 3.3 months
2,000 TPD Plant (Madhya Pradesh) - Brownfield Retrofit
Key insight: Older plants with higher failure rates achieve higher ROI from predictive maintenance. The worse your current reliability, the better your business case.
ROI Sensitivity Analysis
What If Reality Differs from Projections?
Conservative Case (25th Percentile Performance)
Only 50% of projected downtime reduction
Only 20% maintenance optimization
Implementation 20% over budget
Investment: ₹4.8 Cr
Annual value: ₹6.2 Cr
Net benefit: ₹1.4 Cr/year
29%
Payback: 10 months
Still positive ROI
Expected Case (50th Percentile Performance)
70% of projected downtime reduction
30% maintenance optimization
Implementation on budget
Investment: ₹4.0 Cr
Annual value: ₹10.8 Cr
Net benefit: ₹6.8 Cr/year
170%
Payback: 4.4 months
Typical performance
Best Case (75th Percentile Performance)
90% of projected downtime reduction
35% maintenance optimization
Implementation 10% under budget
Investment: ₹3.6 Cr
Annual value: ₹14.2 Cr
Net benefit: ₹10.6 Cr/year
294%
Payback: 3.0 months
Excellence performance
This is why predictive maintenance has such high adoption among plants that try it. Even if you only achieve 50% of projected benefits, you still get 29% ROI—better than most plant investments. The downside risk is minimal while upside potential is massive. This asymmetric risk-reward profile makes predictive maintenance one of the safest high-return investments available.
Predictive Maintenance ROI: Key Takeaways
- Typical ROI: 300-500% within 12-18 months with 3-6 month payback period—fastest return of any plant investment
- Investment range: ₹3-5 crore one-time CAPEX covers sensors, software, implementation, training for typical plant
- Annual value: ₹10-15 crore through downtime prevention (60%), maintenance optimization (25%), asset life extension (15%)
- Three value streams: Prevent failures, optimize maintenance schedules, extend equipment life—dual elimination of over and under-maintenance waste
- Phased approach: Start with ₹80-120 lakh pilot (5-8 assets) achieving 400-900% ROI in 3 months, then scale systematically
- Conservative case: Even at 50% projected performance, delivers 29% ROI with 10-month payback—minimal downside risk
- Older plants benefit more: Higher failure rates = higher ROI. Brownfield retrofits often outperform greenfield installations
- 5-year value: ₹50-100 crore total returns from ₹3-5 crore investment over system life
Ready to calculate your plant's predictive maintenance ROI?
Prove the ROI Before Full Investment
Get customized ROI calculation and phased implementation plan for your cement plant.
See investment, returns, and payback for pilot phase (₹80-120 lakh) vs full deployment (₹3-5 crore).