Every hour of unplanned downtime costs a cement plant ₹15-25 lakhs in lost production. The average Indian plant loses 480-720 hours annually—₹70-180 crores wasted. Yet 60-70% of these failures are predictable 72+ hours in advance with digital monitoring. This is your roadmap to eliminate unplanned downtime through intelligent maintenance. Schedule downtime assessment.
Why Cement Plants Face Unplanned Downtime
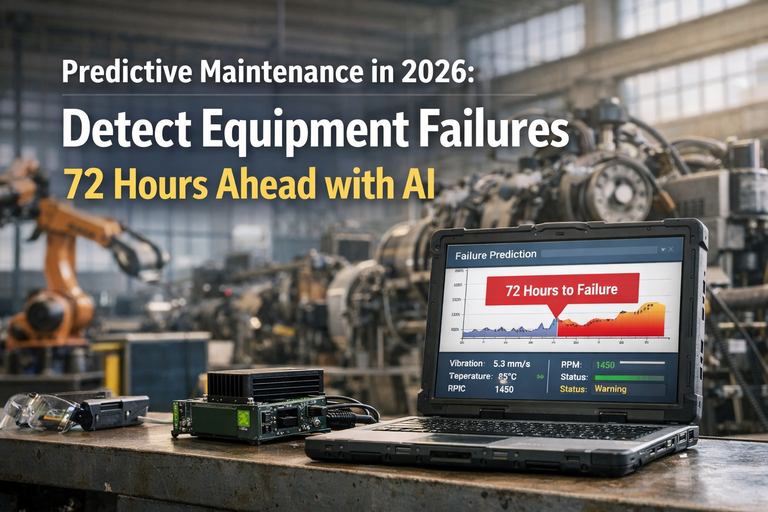
60-70% of Failures Are Predictable | ₹70-180 Cr Lost Annually
The True Cost of Downtime
Production Loss
3,000 TPD kiln × ₹4,000/ton margin or 150 TPH mill × ₹1,200/ton
Wasted Energy
800-1,200 tons coal wasted per kiln shutdown/restart cycle
Emergency Repairs
3x labor cost, 5x parts premium—reactive repairs cost 4-6x preventive
For typical 3-5 MTPA plant with 480-720 hours unplanned downtime. That's 2-5% of revenue—lost because failures aren't predicted.
Five Reasons Traditional Maintenance Fails
Time-Based Schedules Miss Reality
40-50% of failuresQuarterly maintenance ignores actual equipment condition. Bearings fail at month 6 (unplanned) or get replaced at month 3 when still healthy (waste). Equipment doesn't fail on schedules—it fails when stress exceeds design limits.
Human Senses Detect Too Late
25-30% of failuresOperators notice "rough sound" at 60-80% degradation—too late for planned intervention. Critical signals (0.1°C temp rise, 5% efficiency drop) are imperceptible. By the time humans notice and failure cascade already started.
Siloed Systems Miss Patterns
15-20% of failuresDCS shows kiln shell temp, SCADA tracks preheater pressure, maintenance logs bearing replacements—systems don't talk. Failures are multi-variable. Single-system monitoring misses correlations that predict problems.
Static Alarms Trigger Late
10-15% of failuresAlarms at fixed thresholds ("bearing temp > 85°C") miss gradual degradation. Equipment drifts 80°C → 86°C over 2 weeks—alarm triggers at 86°C, but damage already done. Need trend analysis, not static limits.
Critical Spare Not Available
10-15% of downtimeEven when failure predicted, spare not in stock. 3-7 day lead time extends downtime. Predictive maintenance must integrate with smart inventory—stock parts before failures, not after.
Where Downtime Hits Hardest
of total downtime comes from just 5-7 critical equipment types
Key Failures: Refractory (7-45 days downtime), bearings (24-48 hr), girth gear (3-5 days) • Predictability: 85-90% with multi-sensor monitoring
Key Failures: Mill liner wear (36-48 hr), separator issues (12-18 hr) • Predictability: 75-80% with performance analytics
Key Failures: Impeller damage, bearing failures (8-24 hr) • Predictability: 80-85% with vibration + thermal monitoring
Digital Monitoring: Reactive to Predictive
Sensor Network
150-200 sensors per plant monitoring vibration, temperature, pressure, power. Real-time (1-10 sec intervals) vs monthly inspections. 24/7/365 coverage vs 8-hour shifts. Detect 0.1°C changes invisible to humans.
Data Integration
Unified platform connecting sensors + DCS + SCADA + maintenance logs. Correlate multi-variable patterns—kiln shell temp + preheater pressure + clinker chemistry = coating failure signature.
AI Analytics
ML models trained on 1,000+ failure events. Pattern recognition for specific failure modes. 75-90% prediction accuracy vs 30-40% with time-based maintenance. Forecast Remaining Useful Life (RUL) for components.
Action Orchestration
Automated work orders, spare parts alerts, maintenance scheduling. AI alert triggers: (1) Work order in CMMS, (2) Check spare inventory, (3) Schedule window, (4) Notify team. Convert predictions into prevented downtime.
Traditional vs Digital: The Difference
Implementation: 12-18 Month Journey
Phase 1: Assessment & Quick Wins
Actions: Failure analysis, critical equipment prioritization, pilot deployment (3-5 assets), baseline metrics
Investment: 25% of budget (₹1.5-2.5 Cr) • Results: 10-15% downtime reduction in pilot areas
Phase 2: Scale & Intelligence
Actions: Full sensor deployment (150-200 points), DCS/SCADA integration, AI model training, workflow automation, operator training
Investment: 50% of budget (₹3-5 Cr) • Results: 40-50% downtime reduction, first major failure prevented
Phase 3: Optimization & Culture
Actions: AI refinement, expand to secondary equipment, predictive inventory, performance optimization, culture shift to predictive standard
Investment: 25% of budget (₹1.5-2.5 Cr) + ongoing OPEX • Results: 60-70% downtime reduction vs baseline
Critical Success Factors
Plant Head must champion cultural shift
40-hour training for each role
Weekly planning using AI forecasts
Measure MTBF, MTTR, accuracy
Proven Results: Indian Cement Leaders
UltraTech Cement
8 plants, 35 MTPA capacity1,500+ sensors, AI refractory monitoring, vibration analysis for mills/fans, SAP PM integration
Ambuja Cement
6 plants, 29 MTPA capacity120 critical assets monitored, predictive inventory module, mobile app for field teams
Industry Benchmark: Digital Advantage
Business Case: Investment vs Returns
Investment (3-5 MTPA Plant)
Annual Value
Key Takeaways
The Crisis: 480-720 hours annual downtime = ₹70-180 Cr losses per plant. 60-70% predictable but unpredicted.
Root Causes: Time-based mismatch, operator limitations, data siloes, static alarms, spare unavailability—all solvable with digital monitoring.
Focus Investment: 70-85% downtime from 5-7 asset types. Monitor 12-15 critical equipment for 70-80% downtime prevention.
The Solution: 4-layer architecture—sensors + data integration + AI analytics (75-90% accuracy) + action orchestration.
Implementation: 12-18 months, 3 phases. Quick wins in 3 months, full transformation in 18 months with culture change.
Proven ROI: 320-480% over 3 years. Payback 6-9 months. Industry standard: 60-70% downtime elimination.
Eliminate Unplanned Downtime in Your Plant
Start with a free downtime assessment—we'll analyze your failure patterns, identify critical equipment, and map your transformation path.